

Economics focus - the ultimate blog
Economics focus - the ultimate blog
Economics focus - the ultimate blog

You also want an ePaper? Increase the reach of your titles
YUMPU automatically turns print PDFs into web optimized ePapers that Google loves.
54 Finance and economics The Economist January 2nd 2010<br />
Global house prices<br />
Ratio rentals<br />
House prices are still far above <strong>the</strong>ir fair<br />
value in many countriesthough no<br />
longer in America<br />
WHEN The Economist last published its<br />
round-up of global house prices in<br />
September <strong>the</strong>re were only two countries<br />
(Switzerland and China) in which prices<br />
were higher than a year earlier. Since <strong>the</strong>n<br />
many housing markets have streng<strong>the</strong>ned.<br />
The latest survey shows that house-price<br />
ination has turned positive in six countries,<br />
and in Hong Kong <strong>the</strong> rate of increase<br />
is now in double digits. Even where prices<br />
are still falling year on year, markets are<br />
healing. In America <strong>the</strong> S&P/Case-Shiller<br />
index of prices in ten big cities was unchanged<br />
in October, after ve monthly increases.<br />
That has left prices 6.4% below<br />
<strong>the</strong>ir levels 12 months earlier; go back a<br />
year and house-price deation was almost<br />
three times as high.<br />
That markets are now stabilising could<br />
suggest that prices have fallen far enough<br />
to correct <strong>the</strong> excesses of <strong>the</strong> global housing<br />
bubble. To test that hypo<strong>the</strong>sis The<br />
Economist has created a fair-value measure<br />
for property based on <strong>the</strong> ratio of<br />
house prices to rents. The gauge is<br />
much like <strong>the</strong> price/earnings ratio<br />
used by stockmarket analysts. Just<br />
as <strong>the</strong> worth of a share is determined<br />
by <strong>the</strong> present value of future<br />
earnings, house prices<br />
should reect <strong>the</strong> expected value<br />
of benets that come from home<br />
ownership. These benets are<br />
captured by <strong>the</strong> rents earned by<br />
property investors, which are<br />
equivalent to <strong>the</strong> tenancy costs<br />
saved by owner-occupiers.<br />
Shares are deemed pricey<br />
when <strong>the</strong> p/e ratio is above its<br />
long-run average. Similarly,<br />
homebuyers are likely to be overpaying<br />
for property when <strong>the</strong><br />
price-to-rents ratio is higher than<br />
normal. By that yardstick house<br />
prices seem low in only a handful<br />
of countries in our survey, as <strong>the</strong><br />
nal column in <strong>the</strong> table shows.<br />
One is Japan, where steadily falling<br />
property prices mean <strong>the</strong><br />
price-to-rents ratio is 34% below<br />
its average since 1975. Switzerland’s<br />
ratio is also less than its<br />
long-run average. Germany looks<br />
cheap as well, and since our valuation<br />
benchmark goes back only<br />
to 1996 and so misses out a period<br />
when German house prices were<br />
frothier, may be cheaper still.<br />
The global housing bubble<br />
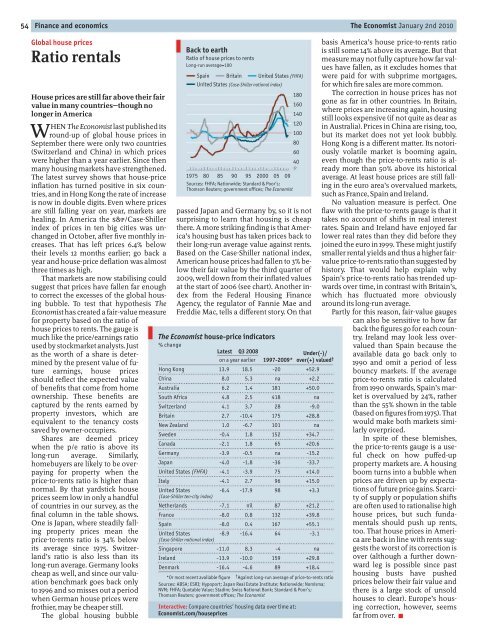
Back to earth<br />
Ratio of house prices to rents<br />
Long-run average=100<br />
Spain Britain United States (FHFA)<br />
United States (Case-Shiller national index)<br />
1975 80 85 90 95 2000 05 09<br />
Sources: FHFA; Nationwide; Standard & Poor’s;<br />
Thomson Reuters; government offices; The Economist<br />
180<br />
160<br />
140<br />
120<br />
100<br />
passed Japan and Germany by, so it is not<br />
surprising to learn that housing is cheap<br />
<strong>the</strong>re. A more striking nding is that America’s<br />
housing bust has taken prices back to<br />
<strong>the</strong>ir long-run average value against rents.<br />
Based on <strong>the</strong> Case-Shiller national index,<br />
American house prices had fallen to 3% below<br />
<strong>the</strong>ir fair value by <strong>the</strong> third quarter of<br />
2009, well down from <strong>the</strong>ir inated values<br />
at <strong>the</strong> start of 2006 (see chart). Ano<strong>the</strong>r index<br />
from <strong>the</strong> Federal Housing Finance<br />
Agency, <strong>the</strong> regulator of Fannie Mae and<br />
Freddie Mac, tells a dierent story. On that<br />
The Economist house-price indicators<br />
% change<br />
80<br />
60<br />
40<br />
Latest Q3 2008 Under(-)/<br />
on a year earlier 1997-2009* over(+) valued †<br />
Hong Kong 13.9 18.5 -20 +52.9<br />
China 8.0 5.3 na +2.2<br />
Australia 6.2 1.4 181 +50.0<br />
South Africa 4.8 2.5 418 na<br />
Switzerland 4.1 3.7 28 -9.0<br />
Britain 2.7 -10.4 175 +28.8<br />
New Zealand 1.0 -6.7 101 na<br />
Sweden -0.4 1.8 152 +34.7<br />
Canada -2.1 1.8 65 +20.6<br />
Germany -3.9 -0.5 na -15.2<br />
Japan -4.0 -1.8 -36 -33.7<br />
United States (FHFA) -4.1 -3.9 75 +14.0<br />
Italy -4.1 2.7 96 +15.0<br />
United States -6.4 -17.9 98 +3.3<br />
(Case-Shiller ten-city index)<br />
Ne<strong>the</strong>rlands -7.1 nil 87 +21.2<br />
France -8.0 0.8 132 +39.8<br />
Spain -8.0 0.4 167 +55.1<br />
United States -8.9 -16.4 64 -3.1<br />
(Case-Shiller national index)<br />
Singapore -11.0 8.3 -4 na<br />
Ireland -13.9 -10.0 159 +29.8<br />
Denmark -16.4 -4.6 89 +18.4<br />
*Or most recent available figure<br />
Sources: ABSA; ESRI; Hypoport; Japan Real Estate Institute; Nationwide; Nomisma;<br />
NVM; FHFA; Quotable Value; Stadim; Swiss National Bank; Standard & Poor’s;<br />
Thomson Reuters; government offices; The Economist<br />
† Against long-run average of price-to-rents ratio<br />
Interactive: Compare countries’ housing data over time at:<br />
Economist.com/houseprices<br />
basis America’s house price-to-rents ratio<br />
is still some 14% above its average. But that<br />
measure may not fully capture how far values<br />
have fallen, as it excludes homes that<br />
were paid for with subprime mortgages,<br />
for which re sales are more common.<br />
The correction in house prices has not<br />
gone as far in o<strong>the</strong>r countries. In Britain,<br />
where prices are increasing again, housing<br />
still looks expensive (if not quite as dear as<br />
in Australia). Prices in China are rising, too,<br />
but its market does not yet look bubbly.<br />
Hong Kong is a dierent matter. Its notoriously<br />
volatile market is booming again,<br />
even though <strong>the</strong> price-to-rents ratio is already<br />
more than 50% above its historical<br />
average. At least house prices are still falling<br />
in <strong>the</strong> euro area’s overvalued markets,<br />
such as France, Spain and Ireland.<br />
No valuation measure is perfect. One<br />
aw with <strong>the</strong> price-to-rents gauge is that it<br />
takes no account of shifts in real interest<br />
rates. Spain and Ireland have enjoyed far<br />
lower real rates than <strong>the</strong>y did before <strong>the</strong>y<br />
joined <strong>the</strong> euro in 1999. These might justify<br />
smaller rental yields and thus a higher fairvalue<br />
price-to-rents ratio than suggested by<br />
history. That would help explain why<br />
Spain’s price-to-rents ratio has trended upwards<br />
over time, in contrast with Britain’s,<br />
which has uctuated more obviously<br />
around its long-run average.<br />
Partly for this reason, fair-value gauges<br />
can also be sensitive to how far<br />
back <strong>the</strong> gures go for each country.<br />
Ireland may look less over-<br />
valued than Spain because <strong>the</strong><br />
available data go back only to<br />
1990 and omit a period of less<br />
bouncy markets. If <strong>the</strong> average<br />
price-to-rents ratio is calculated<br />
from 1990 onwards, Spain’s market<br />
is overvalued by 24%, ra<strong>the</strong>r<br />
than <strong>the</strong> 55% shown in <strong>the</strong> table<br />
(based on gures from 1975). That<br />
would make both markets similarly<br />
overpriced.<br />
In spite of <strong>the</strong>se blemishes,<br />
<strong>the</strong> price-to-rents gauge is a useful<br />
check on how pued-up<br />
property markets are. A housing<br />
boom turns into a bubble when<br />
prices are driven up by expectations<br />
of future price gains. Scarcity<br />
of supply or population shifts<br />
are often used to rationalise high<br />
house prices, but such fundamentals<br />
should push up rents,<br />
too. That house prices in America<br />
are back in line with rents suggests<br />
<strong>the</strong> worst of its correction is<br />
over (although a fur<strong>the</strong>r downward<br />
leg is possible since past<br />
housing busts have pushed<br />
prices below <strong>the</strong>ir fair value and<br />
<strong>the</strong>re is a large stock of unsold<br />
houses to clear). Europe’s housing<br />
correction, however, seems<br />
far from over. 7


![[ccebbook.cn]The Economist August 1st 2009 - the ultimate blog](https://img.yumpu.com/28183607/1/190x252/ccebbookcnthe-economist-august-1st-2009-the-ultimate-blog.jpg?quality=85)


![[ccebook.cn]The World in 2010](https://img.yumpu.com/12057568/1/190x249/ccebookcnthe-world-in-2010.jpg?quality=85)
![[ccemagz.com]The Economist October 24th 2009 - the ultimate blog](https://img.yumpu.com/5191885/1/190x252/ccemagzcomthe-economist-october-24th-2009-the-ultimate-blog.jpg?quality=85)