2011 - Cascades
2011 - Cascades
2011 - Cascades

Create successful ePaper yourself
Turn your PDF publications into a flip-book with our unique Google optimized e-Paper software.
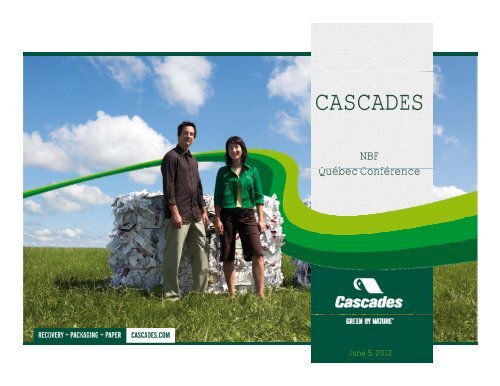
CASCADES<br />
NBF<br />
Québec Conférence<br />
June 5, 2012
DISCLAIMER<br />
Certain statements in this presentation, including statements regarding future results and performance, are<br />
forward-looking g statements within the meaning g of securities legislation g based on current expectations. p The<br />
accuracy of such statements is subject to a number of risks, uncertainties and assumptions that may cause<br />
actual results to differ materially from those projected, including, but not limited to, the effect of general<br />
economic conditions, decreases in demand for the Company’s products, the prices and availability of raw<br />
materials, changes in the relative values of certain currencies, fluctuations in selling prices and adverse<br />
changes h in i general l market k t and d iindustry d t conditions. diti Thi This presentation t ti also l iincludes l d price i iindices di as well ll as<br />
variance and sensitivity analyses that are intended to provide the reader with a better understanding of the<br />
trends related to our business activities. These items are based on the best estimates available to the<br />
Company.<br />
The financial information included in this presentation also contains certain data that are not measures of<br />
performance under IFRS (“non-IFRS measures”). For example, the Company uses earnings before interest,<br />
taxes, depreciation and amortization (EBITDA) because it is the measure used by management to assess<br />
the operating and financial performance of the Company’s Company s operating segments. segments Such information is<br />
reconciled to the most directly comparable financial measures, as set forth in the “Supplemental Information<br />
on Non-IFRS Measures” section of our most recent annual report or earnings press release.<br />
SSpecific ifi items it are ddefined fi d as it items such h as charges h f for iimpairment i t of f assets, t for f facility f ilit or machine hi<br />
closures, debt restructuring charges, gains or losses on sales of business units, unrealized gains or losses<br />
on derivative financial instruments that do not qualify for hedge accounting, foreign exchange gains or losses<br />
on long-term debt and other significant items of an unusual or non-recurring nature.<br />
All amounts in this presentation are in Canadian dollars unless otherwise indicated.<br />
2
OVERVIEW – PACKAGING AND TISSUE PRODUCTS<br />
Boxboard Containerboard Specialty products Tissue papers<br />
Leading NA packaging and tissue manufacturer with substantial recycling capabilities<br />
3
OVERVIEW – BALANCED PLAY<br />
Boxboard Europe<br />
PPackaging k i<br />
77% of Sales<br />
66% of EBITDA<br />
Containerboard<br />
<strong>Cascades</strong><br />
Q1-2012 LTM Sales1 : $3,780<br />
Q1-2012 LTM EBITDA1, 2 Q1 2012 LTM EBITDA : $274<br />
, : $274<br />
Specialty Products<br />
24% of Sales<br />
31% of Sales<br />
22% of Sales<br />
21% of f EBITDA 31% of f EBITDA 14% of f EBITDA<br />
($ in millions)<br />
Ti Tissue PPapers<br />
23% of Sales<br />
34% of EBITDA<br />
Exposure to two healthiest P&P sectors and less cyclical cyclical end-markets<br />
end markets<br />
1 Adjusted for the full year consolidation of Reno de Medici and Papersource.<br />
2 EBITDA excluding specific items and discontinued operations. Breakdown of sales and EBITDA before eliminations & corporate activities.<br />
4
OVERVIEW – CLOSED-LOOP BUSINESS MODEL<br />
May be sent to<br />
recycling centers<br />
100+ business units 76% recycled fibre<br />
(2.9M tons)<br />
23 units<br />
Including the 6 manufacturing/converting tissue papers units and Reno De Medici’s units.<br />
30 units<br />
NA integration rate (<strong>2011</strong>):<br />
33% (580K tons)<br />
NA integration rate (<strong>2011</strong>):<br />
62 units 47%<br />
Upstream and downstream integration<br />
5
<strong>Cascades</strong><br />
Recovery<br />
and Internal<br />
35%<br />
OVERVIEW – RECYCLED FIBRE SUPPLY<br />
2008<br />
Recycled Fibre Supply Sources – North America<br />
Spot<br />
Purchases<br />
19%<br />
Contractual<br />
agreements<br />
46%<br />
<strong>Cascades</strong><br />
Recovery<br />
and d IInternal t l<br />
32%<br />
<strong>2011</strong><br />
Spot<br />
Purchases<br />
20%<br />
Contractual<br />
agreements<br />
48%<br />
Control over 80% of our fibre supply despite greater concentration on the supply side<br />
6
MARKET DYNAMICS – DEMAND<br />
Packaging Tissue<br />
(billions<br />
ft2)<br />
460<br />
420<br />
380<br />
340<br />
300<br />
412 411 413<br />
North American Box Shipments<br />
428<br />
424 421 421<br />
405<br />
374<br />
386 387<br />
2001 2002 2003 2004 2005 2006 2007 2008 2009 2010 <strong>2011</strong><br />
Sources: RISI, Fiber Box Association, Paper Packaging Canada.<br />
('000 s.t.)<br />
8,400<br />
8,200<br />
8,000<br />
7,800<br />
7,600<br />
7,844<br />
U.S. Total Tissue Consumption<br />
77,896 896<br />
Exposure to relatively stable / growing demand<br />
8,028<br />
88,201 201<br />
8,053<br />
8,219<br />
8,319<br />
2005 2006 2007 2008 2009 2010 <strong>2011</strong><br />
7
MARKET DYNAMICS – SUPPLY<br />
100% 85%<br />
80%<br />
60%<br />
40%<br />
20%<br />
0%<br />
North American<br />
coated boxboard<br />
Top 5 producers' share of capacity<br />
66%<br />
European coated<br />
boxboard<br />
77%<br />
North American<br />
containerboard<br />
86%<br />
Canadian<br />
containerboard<br />
76%<br />
North American<br />
tissue<br />
C<strong>Cascades</strong>’s<br />
Market Share<br />
(estimate)<br />
3% 17% 3% 26% 7%<br />
Sources: RISI, companies filings.<br />
Increased consolidation over the last few years in our market segments<br />
8
MARKET DYNAMICS – MARKET BALANCE<br />
100%<br />
96%<br />
92%<br />
88%<br />
84%<br />
80%<br />
76%<br />
Annual Average Capacity Utilization Rates<br />
2007 2008 2009 2010 <strong>2011</strong><br />
U.S. Containerboard Industry U.S. Coated Recycled Boxboard Industry U.S. Tissue Industry<br />
Balanced supply/demand equation with utilization rates at approximately 95%<br />
Sources: RISI, CEPI Cartonboard, Paper Packaging Canada , Fiber Box Association.<br />
9
MARKET DYNAMICS – PRICING<br />
Packaging Tissue<br />
1,200<br />
1,000<br />
800<br />
600<br />
400<br />
Source: RISI.<br />
991<br />
597<br />
560 420<br />
Packaging Annual Average Selling Prices<br />
1,153 ,<br />
909<br />
710<br />
640<br />
2004 2005 2006 2007 2008 2009 2010 <strong>2011</strong><br />
Virgin Coated Duplex Boxboard (GC2)<br />
Recycled White-Lined Chipboard Index (GD2)<br />
Recycled Boxboard - 20 pt claycoated news (transaction)<br />
Linerboard 42-lb, unbleached kraft, East US (transaction)<br />
1,700<br />
11,600 600<br />
1,500<br />
1,400<br />
1,300<br />
1,200<br />
11,100 100<br />
1,148<br />
Upward long long-term term pricing trend<br />
<strong>Cascades</strong> Tissue Papers Index<br />
(January 1999 = 1,000)<br />
1,669<br />
2003 2004 2005 2006 2007 2008 2009 2010 <strong>2011</strong><br />
10
Sources: RISI, Bloomberg.<br />
MARKET DYNAMICS – RAW MATERIAL COSTS<br />
(US$/ton)<br />
300<br />
250<br />
200<br />
150<br />
100<br />
50<br />
0<br />
Main Recycled Fiber North Amercian OBM List Prices<br />
165<br />
Whit White grades d (SOP)<br />
Jan 08<br />
Mar r 08<br />
Mayy<br />
08<br />
July 08<br />
Sept 08<br />
Nov 08<br />
Jan 09<br />
Mar r 09<br />
Mayy<br />
09<br />
July 09<br />
Sept 09<br />
Nov 09<br />
Jan 10<br />
Mar r 10<br />
Mayy<br />
10<br />
July 10<br />
Sept 10<br />
Nov 10<br />
Jan 11<br />
Mar r 11<br />
Mayy<br />
11<br />
July 11<br />
Sept 11<br />
Nov 11<br />
Jan 12<br />
Mar r 12<br />
290<br />
Brown grades (OCC)<br />
Market anomaly: SOP trading close to OCC OCC should trade at lower price<br />
150<br />
140<br />
Current<br />
135<br />
11
MARKET DYNAMICS – FX AND OTHER INPUT COSTS<br />
Oil & chemicals Currency<br />
Since Since<br />
Dec. <strong>2011</strong> Jan. 2010<br />
Oil +9% +46%<br />
Latex +10% +43%<br />
Pigments +1% +37%<br />
Plastics +12% +29%<br />
Starch +3% +28%<br />
performance against<br />
€<br />
Q1-2012 vs<br />
Q4-<strong>2011</strong> +2% +5%<br />
CAN$ strength and input costs sky sky-rocketing rocketing since 2010<br />
12
STRATEGIC ACTION PLAN – PRIORITY #1<br />
1<br />
Focused investing for modernization of core operations and IT<br />
• Full machine rebuilt<br />
• Swing machine with “TAD<br />
equivalent” technology<br />
• $30M iinvestment t t<br />
• First to install in North America<br />
• High-end tissue paper offering<br />
• Can use up to 100% recycled fiber<br />
• Lower energy costs<br />
ATMOS (Voith) ERP<br />
• $80M iinvestment t t program<br />
• Blueprint and programming:<br />
<strong>2011</strong>-2012<br />
• Implementation:<br />
<strong>2011</strong>-2015<br />
Challenging Ch Challenging ll i M Market k t E Evolution l ti P Proactive ti measures I Improved d profitability<br />
fit bilit<br />
13
STRATEGIC ACTION PLAN – PRIORITY #1 (cont’d)<br />
• Competitive advantage – Recycled liner<br />
• Largest in NA<br />
• 540,000 short tons capacity<br />
• Most technologically advanced equipment<br />
• Well-aligned with current market trends<br />
• Financial flexibility not affected<br />
• $99M total investment<br />
• $84M in equity<br />
• $15M in bridge loan<br />
• Debt non-recourse to <strong>Cascades</strong><br />
• Strong Partnership<br />
• Norampac p ( (<strong>Cascades</strong>) ) 59.7%<br />
• Caisse de dépôt<br />
et placement du Québec 20.2%<br />
• Two industry converters 20.1%<br />
Will Will position i i us amongst leaders l d in i terms of f product d offering, ff i productivity d i i and d profitability<br />
fi bili<br />
14
STRATEGIC ACTION PLAN – PRIORITY #2<br />
2<br />
Optimizing capital allocation between sectors and investments; reducing working capital<br />
Papersource Acquisition<br />
• Acquired one of the most modern<br />
converting plants in NA<br />
• Integration level increased to 70% +<br />
• RReinforces i f positioning iti i i in awayfrom-home<br />
sector<br />
• 10 converting lines<br />
20.0%<br />
18.0%<br />
16.0%<br />
14.0%<br />
12.0%<br />
10.0%<br />
14.7%<br />
W/C Reduction<br />
Working capital (% of sales)<br />
16.3% 16.1%<br />
14 6% 15.0% 14.8% 15.0%<br />
14.6%<br />
Challenging Ch Challenging ll i M Market k t E Evolution l ti P Proactive ti measures I Improve profitability<br />
fit bilit<br />
Q1<br />
2010<br />
Q2<br />
2010<br />
Q3<br />
2010<br />
Q4<br />
2010<br />
Q1<br />
<strong>2011</strong><br />
Q2<br />
<strong>2011</strong><br />
Q3<br />
<strong>2011</strong><br />
13.7%<br />
Q4<br />
<strong>2011</strong><br />
15
STRATEGIC ACTION PLAN – PRIORITY #3<br />
3<br />
Restructuring of under-performing units<br />
Periods 2004-2006 2006-2008 2008-2010 <strong>2011</strong><br />
Strategic<br />
measures<br />
PPackaging k i PPackaging k i PPackaging k i PPackaging k i<br />
5 acquisitions<br />
2 mergers<br />
2 closures<br />
4 sales<br />
7 closures<br />
4 closures<br />
2 acquisitions 1 investment<br />
2 sales<br />
4 sales<br />
4 closures<br />
2 acquisitions i iti<br />
Ti Tissue<br />
Tissue<br />
1 partnership<br />
1 investment<br />
Tissue<br />
1 sale<br />
1 closure<br />
1 acquisition i iti<br />
1 acquisition<br />
1 acquisition<br />
Challenging Ch Challenging ll i M Market k t E Evolution l ti P Proactive ti measures I Improved d profitability<br />
fit bilit<br />
16
STRATEGIC ACTION PLAN – PRIORITY #4<br />
4<br />
Improvement and development of processes and products through innovation<br />
MID-TERM OBJECTIVE<br />
ROCE ≥ WACC<br />
Net debt/EBITDA at 3x<br />
Challenging Ch Challenging ll i M Market k t E Evolution l ti P Proactive ti measures I Improve profitability<br />
fit bilit<br />
17
STRATEGIC ACTION PLAN – Q1-2012 INITIATIVES<br />
Restructuring of<br />
under-performing units<br />
● Announced consolidation of<br />
Ontario containerboard<br />
operations with closure of<br />
three plants<br />
● Announced closure of<br />
Enviropac-Toronto<br />
Focused investing for<br />
modernization of<br />
core operations (and IT)<br />
● $30 million investment<br />
announced in Ontario in our<br />
containerboard sector<br />
● ERP progressing<br />
Optimizing capital allocation<br />
between<br />
sectors and investments<br />
● Acquisition of Bird Packaging<br />
● Greenpac on schedule and<br />
on budget; g ; installation of<br />
paper machine started<br />
Challenging Market Evolution Proactive measures Improved profitability<br />
18
(M CAN$)<br />
4,500<br />
4,000<br />
3,500<br />
3000 3,000<br />
2,500<br />
FINANCIAL REVIEW – HISTORICAL PERFORMANCE<br />
3,449<br />
3,692<br />
3,862 ,<br />
SALES<br />
3,481<br />
4,033 4,025<br />
3,877<br />
3,182<br />
3,625<br />
2003 2004 2005 2006 2007 2008 2009 2010 <strong>2011</strong><br />
(M CAN$)<br />
500<br />
400<br />
300<br />
200<br />
100<br />
0<br />
250 259 262<br />
EBITDA<br />
465<br />
340<br />
314 305 310<br />
229<br />
2003 2004 2005 2006 2007 2008 2009 2010 <strong>2011</strong><br />
CANADIAN GAAP IFRS CANADIAN GAAP<br />
IFRS<br />
Results impacted by challenging market conditions, lower shipments and higher cost input<br />
EBITDA excluding specific items but including discontinued operations. Canadian GAAP (not adjusted for IFRS).<br />
2010 and <strong>2011</strong> figures presented under IFRS and exclude discontinued operations of Dopaco.<br />
19
FINANCIAL REVIEW – SEGMENTED EBITDA<br />
(M CAN$)<br />
Boxboard Europe<br />
(% of sales) (M CAN$)<br />
Containerboard<br />
(% of f sales) )<br />
20<br />
15<br />
10<br />
5<br />
0<br />
(M CAN$)<br />
20<br />
15<br />
10<br />
5<br />
0<br />
17<br />
12,0% 60<br />
46<br />
55<br />
4<br />
5<br />
10 10<br />
13<br />
7,0%<br />
2,0%<br />
45<br />
30<br />
15<br />
33<br />
36<br />
19 20<br />
27<br />
19 21<br />
2 2<br />
0<br />
-3,0% 0<br />
Q1<br />
2010<br />
Q2<br />
2010<br />
Q3<br />
2010<br />
Q4<br />
2010<br />
Q1<br />
<strong>2011</strong><br />
Q2<br />
<strong>2011</strong><br />
Q3<br />
<strong>2011</strong><br />
Q4<br />
<strong>2011</strong><br />
Q1<br />
2012<br />
Q1<br />
2010<br />
Q2<br />
2010<br />
Q3<br />
2010<br />
Q4<br />
2010<br />
Q1<br />
<strong>2011</strong><br />
Q2<br />
<strong>2011</strong><br />
Q3<br />
<strong>2011</strong><br />
Q4<br />
<strong>2011</strong><br />
Q1<br />
2012<br />
16<br />
Q1<br />
2010<br />
17<br />
Q2<br />
2010<br />
18<br />
Q3<br />
2010<br />
Specialty Products<br />
12<br />
Q4<br />
2010<br />
7<br />
Q1<br />
<strong>2011</strong><br />
12<br />
Q2<br />
<strong>2011</strong><br />
13<br />
Q3<br />
<strong>2011</strong><br />
2<br />
Q4<br />
<strong>2011</strong><br />
(% of sales)<br />
11<br />
Q1<br />
2012<br />
20,0%<br />
15 15,0% 0%<br />
10,0%<br />
5,0%<br />
0,0%<br />
(M CAN$)<br />
40<br />
30<br />
20<br />
10<br />
0<br />
19 24 24 23<br />
Tissue Papers<br />
10<br />
16<br />
18<br />
288<br />
33<br />
15,0%<br />
12,0%<br />
9,0%<br />
6,0%<br />
3,0%<br />
(% of sales)<br />
Specialized p Products & Tissue: Improvement p due to lower raw material costs and productivity<br />
p y<br />
Containerboard: Not producing to expectations Europe: Difficult market environment in Q1 Q1-2012 2012<br />
EBITDA excluding specific items.<br />
Q1<br />
2010<br />
Q2<br />
2010<br />
Q3<br />
2010<br />
Q4<br />
2010<br />
Q1<br />
<strong>2011</strong><br />
Q2<br />
<strong>2011</strong><br />
Q3<br />
<strong>2011</strong><br />
Q4<br />
<strong>2011</strong><br />
Q1<br />
2012<br />
20,0%<br />
15 15,0% 0%<br />
10,0%<br />
5,0%<br />
00% 0,0%<br />
20
See notes page 34.<br />
FINANCIAL REVIEW – KEY INDICATORS (KPIs)<br />
('000 ( 000 s.t.)<br />
1000<br />
900<br />
800<br />
700<br />
600<br />
500<br />
12,0%<br />
10 10,5% 5%<br />
9,0%<br />
7,5%<br />
6,0%<br />
692<br />
695<br />
Total Shipments<br />
663 661<br />
902<br />
821<br />
775<br />
796<br />
96%<br />
92%<br />
88%<br />
84%<br />
80%<br />
94%<br />
91%<br />
Capacity Utilization Rate<br />
87%<br />
90% 90%<br />
Q2 Q3 Q4 Q1 Q2 Q3 Q4 Q1<br />
Q2 Q3 Q4 Q1 Q2 Q3 Q4 Q1<br />
2010 2010 2010 <strong>2011</strong> <strong>2011</strong> <strong>2011</strong> <strong>2011</strong> 2012 2010 2010 2010 <strong>2011</strong> <strong>2011</strong> <strong>2011</strong> <strong>2011</strong> 2012<br />
11,2% 11,0% 10,6%<br />
Q2<br />
2010<br />
Q3<br />
2010<br />
LTM Return on Assets<br />
Q4<br />
2010<br />
9,9%<br />
Q1<br />
<strong>2011</strong><br />
8,7%<br />
Q2<br />
<strong>2011</strong><br />
7,4%<br />
Q3<br />
<strong>2011</strong><br />
6,5%<br />
Q4<br />
<strong>2011</strong><br />
7,1%<br />
Q1<br />
2012<br />
18.0%<br />
16.0%<br />
14.0%<br />
12.0%<br />
15.1% 15.1%<br />
Working Capital (% of Sales)<br />
87%<br />
13.9% 14.5% 14.4% 14.5%<br />
Utilization rate and working capital KPIs did not meet expectations<br />
10.0%<br />
Q2<br />
2010<br />
Q3<br />
2010<br />
Q4<br />
2010<br />
Q1<br />
<strong>2011</strong><br />
Q2<br />
<strong>2011</strong><br />
Q3<br />
<strong>2011</strong><br />
86%<br />
13.2%<br />
Q4<br />
<strong>2011</strong><br />
89%<br />
14.2%<br />
Q1<br />
2012<br />
21
FINANCIAL REVIEW – EQUITY INVESTMENTS<br />
• 35% equity investment<br />
• Market Value: +/- $110M<br />
Boralex’s forecast installed production capacity<br />
(MW)<br />
1 000<br />
800<br />
600<br />
400<br />
472<br />
818<br />
875<br />
<strong>2011</strong> 2013 2015<br />
(euro)<br />
50<br />
40<br />
30<br />
20<br />
• 45% equity investment<br />
• Market value: +/- $25M<br />
Reno De Medici’s EBITDA<br />
32<br />
40<br />
30<br />
2009 2010 <strong>2011</strong><br />
Investments in strong growth & turnaround stories currently worth +/ +/- $135M<br />
Boralex’s production capacity pro forma for the Seigneurie de Beaupré project.<br />
22
(M CAN$)<br />
2,000<br />
1,800<br />
1,600<br />
1,400<br />
1,200<br />
1,000<br />
1,805<br />
Q1<br />
2009<br />
FINANCIAL REVIEW – DEBT PROFILE<br />
Net Debt<br />
1,658<br />
1,570<br />
11,533 533 11,508 08<br />
1524<br />
1,454 1,462 1,445<br />
1,485<br />
1,397<br />
1,370<br />
1,298<br />
1,524<br />
,<br />
Q2<br />
2009<br />
Q3<br />
2009<br />
Q4<br />
2009<br />
Q1<br />
2010<br />
Q2<br />
2010<br />
Q3<br />
2010<br />
Q4<br />
2010<br />
Q1<br />
<strong>2011</strong><br />
Q2<br />
<strong>2011</strong><br />
Q3<br />
<strong>2011</strong><br />
Q4<br />
<strong>2011</strong><br />
Q1<br />
2012<br />
90% of debt maturing after 2015<br />
Long-term Debt Maturities Distribution<br />
2017<br />
34%<br />
2016<br />
14%<br />
2020<br />
17% %<br />
2015<br />
25%<br />
Before 2015<br />
10%<br />
Before 2015 2015 2016 2017 2020<br />
23
65%<br />
60%<br />
55%<br />
50%<br />
45%<br />
40%<br />
FINANCIAL REVIEW – LEVERAGE RATIOS<br />
58%<br />
Debt / Debt + Equity q y<br />
Net debt / LTM EBITDA<br />
54%<br />
56%<br />
59%<br />
60%<br />
7.0<br />
6.5<br />
6.0<br />
5.5<br />
5.0<br />
4.5<br />
4.0<br />
3.5<br />
4.2 x 4.2 x<br />
3.0<br />
Q1 <strong>2011</strong> Q2 <strong>2011</strong> Q3 <strong>2011</strong> Q4 <strong>2011</strong> Q1 2012 Q1 <strong>2011</strong> Q2 <strong>2011</strong> Q3 <strong>2011</strong> Q4 <strong>2011</strong> Q1 2012<br />
4.9 x<br />
Slight increase in debt during the execution of our strategic plan<br />
¹Starting in Q2 <strong>2011</strong>, LTM EBITDA / Interest includes 100% of Reno De Medici. Starting in Q4 <strong>2011</strong>, also includes 100% of Papersource. <strong>Cascades</strong>’ financial covenant ratios: Net funded debt to<br />
capitalization of not more than 65%,interest coverage ratio not less than 2.25x. EBITDA excluding specific items. Q2 and Q3 <strong>2011</strong> numbers have been slightly restated following the finalization of<br />
the purchase price allocation on the Reno De Medici acquisition<br />
24<br />
5.8 x<br />
56 5.6 x
FINANCIAL REVIEW – CAPEX PROGRAM<br />
• Projects in the works could be approved if business conditions are favourable<br />
– Potential for $225M to $250M in 2012<br />
• Capex requests for 2012 initially approved at approximately $150M<br />
Tissue papers<br />
25%<br />
– Amount subject to change depending on operating results and economic conditions conditions.<br />
Specialty<br />
products<br />
21%<br />
By segment<br />
Corporate<br />
6%<br />
Capital Expenditures Distribution in <strong>2011</strong> ‐ $141M<br />
Boxboard<br />
23%<br />
Containerboard<br />
25%<br />
Health & Safety<br />
7%<br />
Energy<br />
4%<br />
By project category<br />
Others<br />
15%<br />
Cost Reduction Reduction,<br />
Productivity &<br />
Maintenance<br />
74%<br />
Gradual capex program to improve asset base while maintaining financial flexibility<br />
25
CONCLUDING REMARKS<br />
• Short term<br />
• Prioritize organic growth and productivity improvement<br />
• Proactively address operational issues and realize our strategic plan<br />
• Medium term<br />
• Focused investing for modernization of core operations<br />
• Optimize capital allocation<br />
• Restructure under-performing units<br />
• Improve p and develop p pprocesses and pproducts through g innovation<br />
• Reach industry comparable leverage ratios<br />
• Pursue consolidation opportunities<br />
Prudent and gradual investments to improve portfolio of assets<br />
26
NEAR TERM OUTLOOK: Cautious optimism<br />
• Lower raw material costs<br />
• Consolidation of Papersource<br />
• Impacts of restructuring and<br />
optimization measures<br />
• Produce according to historical<br />
standards<br />
+ I + I Boxboard<br />
Europe<br />
• Higher demand volatility<br />
• Europe p uncertainty y<br />
• Continuous strength of CAN$<br />
• High energy and chemical costs<br />
Containerboard Specialty products Tissue papers<br />
Volume Stable Slight increase Slight increase Slight increase<br />
Selling prices Slight increase Stable Stable Stable<br />
Raw material costs Slight decrease Slight decrease Slight decrease Slight decrease<br />
Exchange rate Stable Stable<br />
Energy Costs Slight increase Stable<br />
27
APPENDIX<br />
28
Source: Bloomberg.<br />
ENERGY PRICES<br />
Natural gas<br />
(US$)<br />
7.00<br />
600 6.00<br />
5.00<br />
4.00<br />
3.00<br />
2.00<br />
1.00<br />
0.00<br />
Energy prices<br />
Apr 09<br />
July 09<br />
Oct 09<br />
Jan 10<br />
Apr 10<br />
July 10<br />
Oct 10<br />
Jan 11<br />
Apr 11<br />
July 11<br />
Oct 11<br />
Jan 12<br />
Natural gas (US$/mmBtu)<br />
Crude oil (US$/barrel)<br />
Crude oil<br />
(US$)<br />
110<br />
90<br />
70<br />
50<br />
30<br />
Hedging Program - Natural gas<br />
• Canada:<br />
• 2012: 65% at 5.97 CAN$/GJ<br />
• 2013: 70% at 5.48 CAN$/GJ<br />
• US: U.S.:<br />
• 2012: 58% at 6.30 US$/mmBtu<br />
• 2013: 52% at 5.84 US$/mmBtu<br />
2010 <strong>2011</strong> 2012 Change<br />
Q1 2012 Q1 2012<br />
Averages<br />
Energy prices<br />
Year Year Q1 Q1 <strong>2011</strong> Q4 <strong>2011</strong><br />
Natural gas Henry Hub (US$/mmBtu) 4.39 4.04 2.74 -33% -23%<br />
Crude oil WTI (US$/barrel) 77.32 94.01 100.51 11% 12%<br />
29
US$/CAN$<br />
1.10<br />
1.05<br />
1.00<br />
0.95<br />
0.90<br />
0.85<br />
0.80<br />
Source: Bloomberg.<br />
FOREIGN EXCHANGE<br />
Exchange rates<br />
US$/CAN$ Euro/CAN$<br />
Aprr<br />
09<br />
Julyy<br />
09<br />
Octt<br />
09<br />
Jann<br />
10<br />
Aprr<br />
10<br />
Julyy<br />
10<br />
Octt<br />
10<br />
Jann<br />
11<br />
Aprr<br />
11<br />
Julyy<br />
11<br />
Octt<br />
11<br />
Jann<br />
12<br />
EURO/CAN$<br />
1.00<br />
0.95<br />
0.90<br />
0.85<br />
0.80<br />
0.75<br />
0.70<br />
0.65<br />
0.60<br />
Hedging Program - Cash flow USD:<br />
• 2012<br />
31 to 52% (with options) of exposure<br />
hedged at an average rate of<br />
1.032CAN$/US$ to 1.067CAN$/US$<br />
• 2013<br />
23 to 39% (with options) of exposure<br />
hedged at an average rate of<br />
1.037CAN$/US$ to 1.079CAN$/US$<br />
2010 <strong>2011</strong> 2012 Change<br />
Q1 2012 Q1 2012<br />
Averages<br />
Foreign exchange rates<br />
Year Year Q1 Q1 <strong>2011</strong> Q4 <strong>2011</strong><br />
US$/CAN$ 0.971 1.011 0.999 -2% 2%<br />
EURO/CAN$ 0733 0.733 0727 0.727 0762 0.762 3% 5%<br />
30
NORTH AMERICAN MANUFACTURING SPREAD<br />
1,300<br />
11,200 200<br />
11,100 100<br />
11,000 000<br />
900<br />
See notes page 34. Source: Bloomberg.<br />
1,166<br />
206<br />
Q1<br />
2009<br />
Q2<br />
2009<br />
Q3<br />
2009<br />
11,070 070<br />
324<br />
Q4<br />
2009<br />
1,106<br />
428<br />
Q1<br />
2010<br />
Q2<br />
2010<br />
Q3<br />
2010<br />
1,234<br />
452<br />
Q4<br />
2010<br />
Q1<br />
<strong>2011</strong><br />
Q2<br />
<strong>2011</strong><br />
1,2671,271<br />
512<br />
Q3<br />
<strong>2011</strong><br />
410 387<br />
Q4<br />
<strong>2011</strong><br />
Q1<br />
2012<br />
850<br />
750<br />
650<br />
550<br />
450<br />
350<br />
250<br />
150<br />
Manufacturing spread in CAN$ in Q1/12: +1% vs Q4/11 and +17% vs Q1/11<br />
31
MARKET PRICES AND COSTS SUMMARY<br />
2010 <strong>2011</strong> 2012 Change<br />
Change<br />
These indexes should only be used as indicator of trends<br />
Average Average Average Average Average Average Average Q1 2012 Q1 2012<br />
and they be different than our actual selling prices or purchasing<br />
Q1 Q2 Q3 Q4 Q1 Q1 <strong>2011</strong> Q4 <strong>2011</strong><br />
costs.<br />
Selling prices<br />
(unit) (%) (unit) (%)<br />
<strong>Cascades</strong> North American US$ index (index 2005 = 1,000) 1 PACKAGING<br />
Boxboard<br />
North America (US$/ton)<br />
1,186 1,238 1,250 1,267 1,272 1,256 1,271 34 3% 0 0%<br />
Recycled boxboard - 20pt. Clay coated news (transaction)<br />
Europe (Euro/tonne)<br />
828 880 917 920 920 909 920 40 5% 0 0%<br />
Recycled white-lined chipboard (GD2) index 2 639 690 716 716 718 710 698 8 1% -20 -3%<br />
Virgin coated duplex boxboard (GC2) index 3 Containerboard (US$/ton)<br />
1,055 1,155 1,151 1,152 1,155 1,153 1,141 -14 -1% -14 -1%<br />
Linerboard 42-lb. unbleached kraft, East US (transaction) 625 640 640 640 640 640 640 0 0% 0 0%<br />
Corrugating medium 26-lb. Semichemical, East U.S. (transaction)<br />
Specialty products (US$/ton, tonne for deinked pulp)<br />
595 610 610 610 610 610 610 0 0% 0 0%<br />
Recycled boxboard - 20pt. Bending chip (transaction) 619 667 675 670 670 670 670 3 1% 0 0%<br />
Deinked pulp (f.o.b; U.S. air-dried & wet-lap, post-consumer) 743 748 768 812 725 763 663 -85 -11% -62 -9%<br />
Unbleached kraft paper, Grocery bag 30-lb. 1,022 1,025 1,093 1,110 1,150 1,095 1,110 85 8% -40 -3%<br />
Uncoated white 50-lb. offset, rolls<br />
TISSUE PAPERS<br />
914 930 955 947 930 940 923 -7 -1% -7 -1%<br />
<strong>Cascades</strong> Tissue papers (index 1999 = 1,000) 4 Raw materials<br />
1,619 1,631 1,662 1,718 1,664 1,669 1,612 -19 -1% -52 -3%<br />
<strong>Cascades</strong> North American US$ index (index 2005 = 300) 5 RECYCLED PAPER<br />
North America (US$/ton)<br />
421 471 494 512 410 472 387 -83 -18% -23 -6%<br />
Corrugated containers, no. 11 (New England) 149 182 178 179 155 174 152 -30 -17% -4 -2%<br />
Special news, no. 8 (ONP - Chicago & NY average) 88 128 139 135 103 126 85 -43 -34% -18 -18%<br />
Sorted office papers, no. 37 (SOP - Chicago & NY average)<br />
Europe (Euro/tonne)<br />
214 223 263 283 164 233 145 -78 -35% -18 -11%<br />
Recovered paper index 6 VIRGIN PULP (US$/tonne)<br />
120 146 158 147 107 140 113 -33 -23% 6 6%<br />
Bl Bleached h d softwood ft d kraft k ft Northern, N th East E t U.S. U S 960 970 11,027 027 993 920 978 873 -97 97 -10% 10% -47 47 -5% 5%<br />
Bleached hardwood kraft Northern mixed, East U.S. 856 820 850 823 738 808 714 -106 -13% -24 -3%<br />
WOODCHIPS – Conifer eastern Canada (US$/odmt) 123 123 125 125 134 127 130 7 6% 4 -3%<br />
Sources: RISI, Dow Jones, Random Lengths and <strong>Cascades</strong>. See notes p. 34.<br />
32
SENSITIVITY TABLE <strong>2011</strong><br />
SELLING PRICES (MANUFACTURING)<br />
Boxboard<br />
Containerboard<br />
Specialty Products (paper only)<br />
Tissue<br />
RAW MATERIAL COSTS<br />
Recycled papers<br />
Brown grades (OCC & others)<br />
Groundwood grades (ONP & others)<br />
White grades (SOP & others)<br />
Commercial pulp<br />
Natural gas<br />
CAPACITY /<br />
CONSUMPTION<br />
(‘000 s.t. and ‘000 mmBtu<br />
for natural gas)<br />
1,425<br />
920<br />
375<br />
525<br />
1,740<br />
305<br />
870<br />
275<br />
11,740<br />
CHANGE EBITDA IMPACT<br />
(In million of CAN$)<br />
25 US$ or € / ton<br />
25 US$ / ton<br />
25 US$ / ton<br />
25 US$ / ton<br />
15 US$ or € / ton<br />
15 US$ or € / ton<br />
15 US$ or € / ton<br />
30 US$ or € / ton<br />
1.00 US$ or € / mmBtu<br />
FOREIGN EXCHANGE<br />
Change of US$ 0.01 vs CAN$ (7)<br />
Sensitivity table adjusted for all recent initiatives (transactions, closures).<br />
45<br />
23<br />
9<br />
13<br />
(29)<br />
(5)<br />
(14)<br />
(9)<br />
(13)<br />
33
NOTES<br />
1. The <strong>Cascades</strong> Noth American selling prices index represents an approximation of the Company's manufacturing selling prices in North America<br />
(excluding converting). It is weighted according to shipments and is based on the average selling price of our North American manufacturing<br />
operations of boxboard, containerboard, speciality products and tissue paper. It considers the change in the mix of products sold. This index<br />
should only be used as a trend indicator.<br />
2. The <strong>Cascades</strong> recycled white-lined chipboard selling prices index represents an approximation of <strong>Cascades</strong>’ recycled grades selling prices in<br />
Europe Europe. It is weighted by country. country<br />
3. The <strong>Cascades</strong> virgin coated duplex boxboard selling prices index represents an approximation of <strong>Cascades</strong>’ virgin grades selling prices in<br />
Europe. It is weighted by country.<br />
4. The <strong>Cascades</strong> Tissue paper selling prices index represents a mix of primary and converted products, and is based on the product mix at the end<br />
of 2006.<br />
5. The <strong>Cascades</strong> North American raw materials index is based on publication prices and the average weighted cost paid for some of our<br />
man manufacturing fact ring raw ra materials materials, namel namely rec recycled cled fibre fibre, virgin irgin ppulp lp and woodchips, oodchips in North America. America It is weighted eighted according to ppurchase rchase volume. ol me<br />
This index should only be used as a trend indicator, as it may differ from our actual manufacturing purchasing costs and our purchase mix.<br />
6. The <strong>Cascades</strong> recovered paper index represents an approximation of <strong>Cascades</strong>’ recovered paper purchase prices in Europe. It is weighted by<br />
country based on the recycled fibre supply mix of 2009.<br />
The capacity utilization rate is defined as: Shipments/Practical capacity. Paper manufacturing only.<br />
Return on assets is a non-GAAP measure and is defined as: LTM EBITDA excluding specific items/ LTM Average of total quarterly assets. It includes<br />
discontinued operations.<br />
Working capital includes accounts receivable plus inventories less accounts payable. It excludes an unpaid provision for closure and restructuring<br />
costs. t It also l excludes l d th the current t portion ti of f dderivatives i ti fi financial i l iinstruments t t and d th the current t portion ti of f ffuture t t taxes li liability. bilit<br />
34
For more information:<br />
www.cascades.com/investors<br />
Riko Gaudreault<br />
Di Director, t I Investor t R Relations l ti<br />
riko_gaudreault@cascades.com<br />
514 514-282 282-2697 2697<br />
35 35