343 - Penn State University
343 - Penn State University
343 - Penn State University

You also want an ePaper? Increase the reach of your titles
YUMPU automatically turns print PDFs into web optimized ePapers that Google loves.
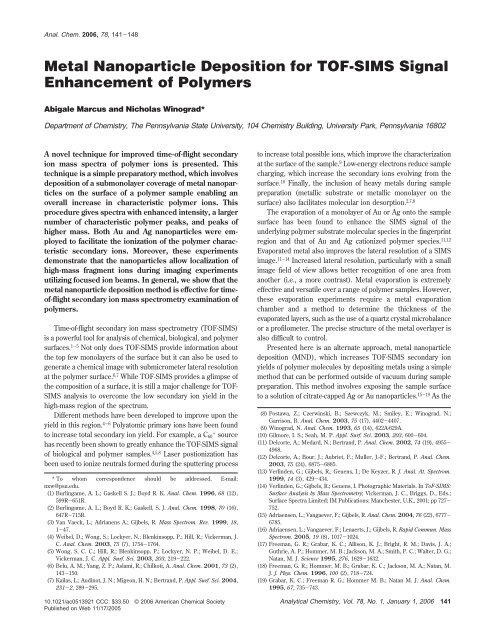
Anal. Chem. 2006, 78, 141-148<br />
Metal Nanoparticle Deposition for TOF-SIMS Signal<br />
Enhancement of Polymers<br />
Abigale Marcus and Nicholas Winograd*<br />
Department of Chemistry, The <strong>Penn</strong>sylvania <strong>State</strong> <strong>University</strong>, 104 Chemistry Building, <strong>University</strong> Park, <strong>Penn</strong>sylvania 16802<br />
A novel technique for improved time-of-flight secondary<br />
ion mass spectra of polymer ions is presented. This<br />
technique is a simple preparatory method, which involves<br />
deposition of a submonolayer coverage of metal nanoparticles<br />
on the surface of a polymer sample enabling an<br />
overall increase in characteristic polymer ions. This<br />
procedure gives spectra with enhanced intensity, a larger<br />
number of characteristic polymer peaks, and peaks of<br />
higher mass. Both Au and Ag nanoparticles were employed<br />
to facilitate the ionization of the polymer characteristic<br />
secondary ions. Moreover, these experiments<br />
demonstrate that the nanoparticles allow localization of<br />
high-mass fragment ions during imaging experiments<br />
utilizing focused ion beams. In general, we show that the<br />
metal nanoparticle deposition method is effective for timeof-flight<br />
secondary ion mass spectrometry examination of<br />
polymers.<br />
Time-of-flight secondary ion mass spectrometry (TOF-SIMS)<br />
is a powerful tool for analysis of chemical, biological, and polymer<br />
surfaces. 1-5 Not only does TOF-SIMS provide information about<br />
the top few monolayers of the surface but it can also be used to<br />
generate a chemical image with submicrometer lateral resolution<br />
at the polymer surface. 6,7 While TOF-SIMS provides a glimpse of<br />
the composition of a surface, it is still a major challenge for TOF-<br />
SIMS analysis to overcome the low secondary ion yield in the<br />
high-mass region of the spectrum.<br />
Different methods have been developed to improve upon the<br />
yield in this region. 4-6 Polyatomic primary ions have been found<br />
to increase total secondary ion yield. For example, a C60 + source<br />
has recently been shown to greatly enhance the TOF-SIMS signal<br />
of biological and polymer samples. 4,5,8 Laser postionization has<br />
been used to ionize neutrals formed during the sputtering process<br />
* To whom correspondence should be addressed. E-mail:<br />
nxw@psu.edu.<br />
(1) Burlingame, A. L.; Gaskell S. J.; Boyd R. K. Anal. Chem. 1996, 68 (12),<br />
599R-651R.<br />
(2) Burlingame, A. L.; Boyd R. K.; Gaskell, S. J. Anal. Chem. 1998, 70 (16),<br />
647R-715R.<br />
(3) Van Vaeck, L.; Adrianens A.; Gijbels, R. Mass Spectrom. Rev. 1999, 18,<br />
1-47.<br />
(4) Weibel, D.; Wong, S.; Lockyer, N.; Blenkinsopp, P.; Hill, R.; Vickerman, J.<br />
C. Anal. Chem. 2003, 75 (7), 1754-1764.<br />
(5) Wong, S. C. C.; Hill, R.; Blenkinsopp, P.; Lockyer, N. P.; Weibel, D. E.;<br />
Vickerman, J. C. Appl. Surf. Sci. 2003, 203, 219-222.<br />
(6) Belu, A. M.; Yang, Z. P.; Aslami, R.; Chilkoti, A. Anal. Chem. 2001, 73 (2),<br />
143-150.<br />
(7) Kailas, L.; Audinot, J. N.; Migeon, H. N.; Bertrand, P. Appl. Surf. Sci. 2004,<br />
231-2, 289-295.<br />
to increase total possible ions, which improve the characterization<br />
at the surface of the sample. 9 Low-energy electrons reduce sample<br />
charging, which increase the secondary ions evolving from the<br />
surface. 10 Finally, the inclusion of heavy metals during sample<br />
preparation (metallic substrate or metallic monolayer on the<br />
surface) also facilitates molecular ion desorption. 2,7,8<br />
The evaporation of a monolayer of Au or Ag onto the sample<br />
surface has been found to enhance the SIMS signal of the<br />
underlying polymer substrate molecular species in the fingerprint<br />
region and that of Au and Ag cationized polymer species. 11,12<br />
Evaporated metal also improves the lateral resolution of a SIMS<br />
image. 11-14 Increased lateral resolution, particularly with a small<br />
image field of view allows better recognition of one area from<br />
another (i.e., a more contrast). Metal evaporation is extremely<br />
effective and versatile over a range of polymer samples. However,<br />
these evaporation experiments require a metal evaporation<br />
chamber and a method to determine the thickness of the<br />
evaporated layers, such as the use of a quartz crystal microbalance<br />
or a profilometer. The precise structure of the metal overlayer is<br />
also difficult to control.<br />
Presented here is an alternate approach, metal nanoparticle<br />
deposition (MND), which increases TOF-SIMS secondary ion<br />
yields of polymer molecules by depositing metals using a simple<br />
method that can be performed outside of vacuum during sample<br />
preparation. This method involves exposing the sample surface<br />
to a solution of citrate-capped Ag or Au nanoparticles. 15-19 As the<br />
(8) Postawa, Z.; Czerwinski, B.; Szewczyk, M.; Smiley, E.; Winograd, N.;<br />
Garrison, B. Anal. Chem. 2003, 75 (17), 4402-4407.<br />
(9) Winograd, N. Anal. Chem. 1993, 65 (14), 622A-629A.<br />
(10) Gilmore, I. S.; Seah, M. P. Appl. Surf. Sci. 2003, 203, 600-604.<br />
(11) Delcorte, A.; Medard, N.; Bertrand, P. Anal. Chem. 2002, 74 (19), 4955-<br />
4968.<br />
(12) Delcorte, A.; Bour, J.; Aubriet, F.; Muller, J.-F.; Bertrand, P. Anal. Chem.<br />
2003, 75 (24), 6875-6885.<br />
(13) Verlinden, G.; Gijbels, R.; Geuens, I.; De Keyzer, R. J. Anal. At. Spectrom.<br />
1999, 14 (3), 429-434.<br />
(14) Verlinden, G.; Gijbels, R.; Geuens, I. Photographic Materials. In ToF-SIMS:<br />
Surface Analysis by Mass Spectrometry; Vickerman, J. C., Briggs, D., Eds.;<br />
Surface Spectra Limited; IM Publications: Manchester, U.K., 2001; pp 727-<br />
752.<br />
(15) Adriaensen, L.; Vangaever, F.; Gijbels, R. Anal. Chem. 2004, 76 (22), 6777-<br />
6785.<br />
(16) Adriaensen, L.; Vangaever, F.; Lenaerts, J.; Gijbels, R. Rapid Commun. Mass<br />
Spectrom. 2005, 19 (8), 1017-1024.<br />
(17) Freeman, G. R.; Grabar, K. C.; Allison, K. J.; Bright, R. M.; Davis, J. A.;<br />
Guthrie, A. P.; Hommer, M. B.; Jackson, M. A.; Smith, P. C.; Walter, D. G.;<br />
Natan, M. J. Science 1995, 276, 1629-1632.<br />
(18) Freeman, G. R.; Hommer, M. B.; Grabar, K. C.; Jackson, M. A.; Natan, M.<br />
J. J. Phys. Chem. 1996, 100 (2), 718-724.<br />
(19) Grabar, K. C.; Freeman R. G.; Hommer M. B.; Natan M. J. Anal. Chem.<br />
1995, 67, 735-743.<br />
10.1021/ac0513921 CCC: $33.50 © 2006 American Chemical Society Analytical Chemistry, Vol. 78, No. 1, January 1, 2006 141<br />
Published on Web 11/17/2005
polymer incorporates a submonolayer amount of the particles at<br />
the surface, the TOF-SIMS signals become significantly enhanced,<br />
with the spectra approaching those observed for monolayer films<br />
adsorbed onto the respective metal substrate. Au and Ag nanoparticles<br />
were chosen because these metals have been found to<br />
give signal enhancement in SIMS.<br />
We utilize poly(tetrafluoroethylene) (PTFE) and polystyreneg-poly(ethylene<br />
glycol) (Tentagel) as prototypical examples to<br />
illustrate the capabilities of this method. The PTFE sample,<br />
prepared as a thin film on Ag and as a bulk material, is important<br />
since the molecular ions are emitted without protonation. The<br />
Tentagel sample, prepared in the form of a spherical bead,<br />
represents a graft of two different polymers that exhibit protonated<br />
molecular ions. The results show that, for both Ag and Au MND,<br />
the mass range of the TOF-SIMS spectra of bulk polymers can<br />
be extended to 5000 Da and that the signal intensities are at least<br />
comparable to those found using metal deposition protocols.<br />
Moreover, since the coverage of particles is fairly low, high-mass<br />
imaging becomes feasible. We speculate that the mechanism of<br />
the enhancement is related to the unique collision cascade of<br />
moving atoms inside the metal nanoparticle and the opportunity<br />
of sputtered metal ions to cationize the desorbed polymer units.<br />
MATERIALS AND METHODS<br />
Materials. Three different polymers were employed in these<br />
experiments: Tentagel beads (Rapp-Polymere), bulk PTFE (Dupont<br />
et Nemours), and HOC(CO2Na)(CH2CO2Na)2‚2H2O], H2O2,<br />
and PTFE suspension (Aldrich Catalog No. 445096). Silicon<br />
substrates were piranha etched (3:1 H2SO4/H2O2) for 30 s to<br />
remove organic contaminants from the surface. Water used in<br />
sample preparation was purified using a Milli-Q system (Millipore,<br />
Burlington, MA) with a final resistivity of 18.2 MΩ cm.<br />
Thin-Film Preparation. Silver foil was etched in concentrated<br />
HNO3 for 10 s, rinsed in 18-MΩ water and then blown dry with<br />
N2 (g) in preparation for casting of a thin film of PTFE. The diluted<br />
PTFE colloid was suspended in H2O with a concentration of 15<br />
mg/mL. A 65-µL aliquot of this diluted colloidal suspension was<br />
spin-cast at 3000 rpm for 30 s onto the etched Ag foil to form a<br />
film thin enough to allow for detection of Ag + ions.<br />
Nanoparticle Synthesis. The nanoparticle synthesis apparatus<br />
consists of an aqua regia (3:1 concentrated HCl/HNO3)<br />
cleaned 1000-mL two-neck round-bottom flask with a Kimble-<br />
Kontes coiled condenser and a football-shaped magnetic stirrer.<br />
This setup was placed in the appropriate heating mantle over a<br />
stirring plate. While the reactions were running, the second neck<br />
was closed off using a glass stopper. Au nanoparticles were<br />
synthesized using the Natan method. 17-19 The Ag nanoparticle<br />
synthesis was performed using 450 mL of 0.001 M AgNO3 with<br />
50 mL of 0.035 M HOC(CO2Na)(CH2CO2Na)2‚2H2O. This solution<br />
was heated to reflux and allowed to react for 70 min. The Ag<br />
nanoparticles were allowed to cool for 1 h. The Au (6-12 nm)<br />
and Ag colloids (20-50 nm) were stored in Teflon-capped tinted<br />
glass bottles and refrigerated for future use.<br />
MND on PTFE. Bulk PTFE was prepared by slicing an<br />
unexposed section of polymer from a piece of bulk sample. These<br />
samples were then rinsed with H2O, inserted into a 2-mL solution<br />
of metal colloid, and allowed to stand for at least 24 h before<br />
analysis.<br />
142 Analytical Chemistry, Vol. 78, No. 1, January 1, 2006<br />
MND on Tentagel Beads. The Tentagel beads were immersed<br />
in a 10-mL solution of colloid in a chemical fume. Optimal<br />
exposure time is 2-3 days, although this time may be shortened<br />
by heating beads to boiling for 1 h. 21-24 Ag nanoparticle treated<br />
beads were allowed to react with the Ag nanoparticles for 24 h.<br />
Beads were isolated from solution by removing excess nanoparticles<br />
using pipet filtration and by drying for 24 h in a desiccator.<br />
Tentagel beads were placed on Si using glass pipets.<br />
TOF-SIMS Measurements. The TOF-SIMS instrument used<br />
in these studies is described in detail elsewhere. 25 A pulsed 15keV<br />
Ga + ion beam with a beam current between 1 and 2 nA, spot<br />
size of 100 nm, and a pulse width of 40 ns impinges the sample<br />
at 3 kHz causing secondary ions to desorb. These ions were<br />
collected using a time to digital converter with a time resolution<br />
of 2 ns. The ion fluence was kept below the static limit at less<br />
than 1.0 × 10 12 ions/cm 2 . Charge compensation was not required<br />
for these experiments. TOF-SIMS images were taken by rastering<br />
the beam over an area of 500 µm × 500 µm using 256 pixels ×<br />
256 pixels with 21 shots/pixel. Spectra were binned at 20 ns after<br />
acquisition for better visibility of weak molecular features. The<br />
ion currents were kept between 1 and 2 nA.<br />
Scanning Electron Microscopy (SEM). SEM was performed<br />
on a JEOL 6700F field emitting scanning electron microscope (FE-<br />
SEM, <strong>University</strong> Park, PA). The magnification used was 80000×.<br />
The voltage used for analysis of the samples was 5.0 keV. The<br />
analysis area was 1.3 µm × 1.5 µm.<br />
Coverage of Sample Surfaces from Metal Nanoparticle<br />
Deposition. One crucial issue inherent to the MND sample<br />
preparation of bulk polymers is the sample coverage of these<br />
particles. The coverage is dependent upon the type of metal<br />
nanoparticle and the polymer to be examined as well as the time<br />
of exposure to the nanoparticles: the shorter the exposure to the<br />
nanoparticle solution, the lower the surface coverage. The Ag<br />
MND samples typically exhibit a coverage of 85-90% whereas<br />
Au MND samples exhibit a coverage of ∼50%. The sizes of the<br />
nanoparticles were determined directly by high-resolution SEM<br />
as shown in Figure 1. Ag nanoparticles were found to be between<br />
20 and 50 nm in size. Au nanoparticle islands are between 5 and<br />
20 nm in size. The difference in coverage of Ag and Au<br />
nanoparticles may be one reason a larger signal enhancement is<br />
found for Ag nanoparticles versus Au nanoparticles.<br />
Secondary Ion Yield and Yield Enhancement. Enhancement<br />
was calculated using the method reported by Delcorte. 12<br />
Briefly, enhancement was calculated from the measured protonated<br />
molecular ion yield for a MND sample divided by the<br />
intensity of the same peak obtained from an untreated sample.<br />
The enhancement due to metal cationization was calculated<br />
similarly whereby the metal cationized molecule yield was divided<br />
by the untreated sample protonated ion yield. There is not a<br />
(20) Burda, C.; Chen, X.; Narayanan, R.; El-Sayed, M. A. Chem. Rev. 2005, 105,<br />
1025-1102.<br />
(21) Enustun, B. V.; Turkevich, J. J. Am. Chem. Soc. 1963, 85 (21), 3317-3328.<br />
(22) Loginov, A. V.; Gorbunova, V. V.; Boitsova, T. B. J. Nanopart. Res. 2002, 4<br />
(3), 193-205.<br />
(23) Satoh, N.; Hasegawa H.; Tsujii K.; Kimura K. J. Phys. Chem. 1994, 98 (8),<br />
2143-2147.<br />
(24) Spear, E. B.; Jones P. F.; Neave A. S.; Shlager M. J. Am. Chem. Soc. 1921,<br />
43 (7), 1385-1391.<br />
(25) Braun, R. M.; Blenkinsopp, P.; Mullock, S. J.; Corlett, C.; Willey, K. F.;<br />
Vickerman, J. C.; Winograd, N. Rapid Commun. Mass Spectrom. 1998, 12<br />
(18), 1246-1252.
Figure 1. (a) SEM of Ag nanoparticle treated Tentagel bead<br />
surface. (b) SEM of Au nanoparticle treated Tentagel bead surface<br />
(the darker fine grain materials). The Ag treated bead surface has<br />
far greater coverage than that of the Au treated sample.<br />
Figure 2. Molecular structures of Tentagel beads and PTFE.<br />
homologue metal cationized peak in the pristine sample, so the<br />
only peak that can be used to determine the degree of enhancement<br />
is the protonated ion yield. M + indicates the molecular<br />
fragment ion whereas Me + indicates the metal ion. Total yield<br />
enhancement is defined as being equal to the protonated ion yield<br />
enhancement plus the metal cationized ion yield enhancement.<br />
RESULTS AND DISCUSSION<br />
The effectiveness of MND signal enhancement was examined<br />
on two different polymer systems: poly(tetrafluoroethylene)<br />
(PTFE) and polystyrene-g-poly(ethylene glycol) (Tentagel) (Figure<br />
2). The PTFE samples show that there is signal enhancement<br />
using MND on the PTFE polymer from detection of the molecular<br />
or oligomer ion (M + ). The Tentagel bead sample shows a similar<br />
signal enhancement using MND with protonation [M + H] + and<br />
metal cationization [M + Me] + ionization mechanisms.<br />
The samples to be examined are thin-film PTFE on etched<br />
Ag, bulk PTFE, and Tentagel beads. Several characteristic mass<br />
peaks are singled out for attention. For the thin-film PTFE film<br />
sample, there is a strong fragment ion peak [(CF2)32CF] + at m/z<br />
1631. Bulk PTFE exhibits the same high-mass peak. In either case,<br />
PTFE does not ionize through a protonation mechanism, but forms<br />
a radical cation directly. For Tentagel beads there is a characteristic<br />
ion [O(CH2CH2O)28(C6H4CH2CH2O2H)7 + H] + at m/z 2209,<br />
while corresponding metal cationized peaks are observed at m/z<br />
2315, 2317 [Ag + O(CH2CH2O)28(C6H4CH2CH2O2H)7] + or m/z<br />
Figure 3. The 0-200 Da region of thin-film colloidal PTFE on etched<br />
Ag. The fingerprint of ions for the PTFE are the following: C + (m/z<br />
12), CF + (m/z 31), CF3 + (m/z 69), (CF2)2 + (m/z 100), (CF2)2CF + (m/z<br />
131), (CF2)3 + (m/z 150), (CF2)2CF3 + (m/z 169), and C4F7 + (m/z 181).<br />
Figure 4. TOF-SIMS spectrum of thin-film PTFE on etched Ag foil.<br />
Mass spectrum of MND PTFE with a range of 0-3000 Da. The lowmass<br />
range from 0 to 200 is considered to be the fingerprint region.<br />
The [C2(CF2)7C3F + (C2F)] + ions are marked with orange asterisks<br />
to guide the eye. The less abundant [C2(CF2)7C3FO + (C2F)] +<br />
oligomer series are marked with purple asterisks to mark these<br />
particular ions. The [(CF2)20CAg + (C2F)n] + ions are marked with pink<br />
asterisks to guide the eye to the proper ions in this series. The [(CF2)24<br />
+ (C2F)n] + ions are marked with light blue asterisks to guide the eye<br />
to the proper ions.<br />
2405 [Au + O(CH2CH2O)28(C6H4CH2CH2O2H)7] + . In the low-mass<br />
range, [(CH2CH2O)2] + and [(CH2CH2O)2 + H] + with a m/z 88 and<br />
89, respectively, are chosen as representative peaks. In the case<br />
of all ions, the metalated ion has a higher intensity than the<br />
molecular or protonated ion.<br />
Thin-Film PTFE Control Sample. The control PTFE thin<br />
film on etched Ag exhibits several regions of interest. The lowmass<br />
region from m/z 0 to 200, or the fingerprint region, has a<br />
characteristic distribution of representative low-mass ions, which<br />
allow identification of the PTFE as shown in Figure 3. The higher<br />
mass range is shown in Figure 4 and consists of two peak<br />
distributions of m/z 475-955, [C2(CF2)7C3F + (C2F)n] + , and m/z<br />
487-912, [C2(CF2)7C3FO + (C2F)n] + . These two oligomer ion<br />
series are related in structure since series [C2(CF2)7C3FO +<br />
(C2F)n] + has an shift of 16 mass units from the series [C2(CF2)7C3F<br />
+ (C2F)n] + . This observation indicates that the surface of the<br />
polymer is at least partially oxidized. The last part of the mass<br />
spectrum consists of two series polymer ion fragments from m/z<br />
Analytical Chemistry, Vol. 78, No. 1, January 1, 2006 143
Figure 5. [(CF2)32C2F] + formation off etched Ag foil. There is<br />
considerable ion formation at this high mass.<br />
1131 to 2581 [(CF2)20CAg + (C2F)n] + and from m/z 1174 to 2674<br />
[(CF2)24 + (C2F)n] + .<br />
Metal cationization and oligomer ion formation of PTFE<br />
molecular ion signals occurs using the etched Ag foil. Some ions<br />
formed have metal conjugate ions, which facilitate their production<br />
and evolution from the analyzed surface. In the high-mass region,<br />
the molecular ion fragment [(CF2)32CF] + with m/z 1631 is<br />
observed as shown in Figure 5. The metal cationized oligomer<br />
ion, however, is not detected for this oligomer ion series. 26,27<br />
Presumably, a metastable decay of the metal cationized ion into<br />
the charged m/z 1631 ion and a neutral Ag atom is responsible<br />
for this observation. 28-31<br />
Positive Ion Signal Enhancement of Bulk PTFE Using<br />
MND. Addition of Au or Ag MND on bulk PTFE yields TOF-<br />
SIMS spectra that are similar in intensity at high mass to the<br />
spectrum observed for thin-film PTFE on etched Ag foil. The mass<br />
spectrum of the untreated bulk PTFE is shown in Figure 6a. This<br />
untreated PTFE sample does not exhibit measurable signal in the<br />
mass range from m/z 1250 to 3000. The Au and Ag MND bulk<br />
PTFE mass spectra are shown in Figure 6b and c. The mass<br />
spectra in Figures 4, 6b, and 6c illustrate an analogous degree of<br />
enhancement at high mass in the region of m/z 1250-3000<br />
between the thin-film PTFE sample and the MND PTFE treated<br />
samples. Both sample types give significant oligomer ion formation<br />
(Figures 4, 6b, and 6c). The characteristic oligomer fragments<br />
for the thin-film PTFE are [(CF2)20CAg + (C2F)n] + and [(CF2)24<br />
+ (C2F)n] + from m/z 1250 to 3000 as shown in Figure 4. The<br />
characteristic oligomer ions for MND treated bulk PTFE are<br />
[(CF2)nC2F] + , [(CF2)nCF] + , and [(CF2)nC2] + , which are illustrated<br />
in Figure 6b (PTFE-Au MND) and Figure 6c (PTFE-Ag MND).<br />
While the high-mass spectra of the thin-film PTFE and the bulk<br />
PTFE are different, the increase in the formation of secondary<br />
oligomer ions is similar. The mass spectra differ at high mass<br />
(26) Gamble, L. J.; Ravel, B.; Fischer, D. A.; Castner, D. G. Langmuir 2002, 18<br />
(6), 2183-2189.<br />
(27) Hagenoff, B. Optimisation Methods: Cationisation. In ToF-SIMS: Surface<br />
Analysis by Mass Spectrometry, 1 ed.; Vickerman, J. C., Briggs, D., Eds.; IM<br />
Publications and Surface Spectra: Charlton, Chichester, West Sussex, 2001;<br />
pp 285-308.<br />
(28) Bletsos, I. V.; Hercules, D. M.; vanLeyen, D.; Benninghoven, A. Macromolecules<br />
1987, 20 (2), 407-413.<br />
(29) Bletsos, I. V.; Hercules, D. M.; Magill, J. H.; vanLeyen, D.; Niehuis, E.;<br />
Benninghoven, A. Anal. Chem. 1988, 60 (9), 938-944.<br />
(30) Bletsos, I. V.; Hercules, D. M.; vanLeyen, D.; Benninghoven, A.; Karakatsanis,<br />
C. G.; Rieck, J. N. Macromolecules 1990, 23 (18), 4157-4163.<br />
(31) Bletsos, I. V.; Hercules, D. M. Anal. Chem. 1991, 63 (18), 1953-1960.<br />
144 Analytical Chemistry, Vol. 78, No. 1, January 1, 2006<br />
Figure 6. Mass spectra of MND bulk PTFE with a range of 0-3000<br />
Da. (a) Untreated bulk PTFE. (b) Au nanoparticle treated bulk PTFE.<br />
The inset spectrum is the high-mass region expanded to illustrate<br />
the formation of the characteristic high-mass oligomer ions. The<br />
(CF2)nCF + ions are marked with blue asterisks to guide the eye to<br />
the proper range. The less abundant (CF2)nC2 + oligomer series are<br />
marked with a red asterisks to mark the specific peaks of this particular<br />
ion series. (c) Ag nanoparticle treated bulk PTFE. The (CF2)nCF + ions<br />
are marked with blue asterisks to guide the eye to the proper range.<br />
The less abundant (CF2)nC2 + oligomer series are marked with a red<br />
asterisks to mark the specific peaks of this particular ion series. The<br />
(CF2)nC2F + ions are marked with green asterisks to guide the eye to<br />
the proper range. The (CF2)nC2 + series is marked with a red line to<br />
guide the eye to the proper range.<br />
since the bulk PTFE is sintered and molded, enabling a crosslinking<br />
reaction between the chains of the PTFE grains and the<br />
molecular weight is probably higher. 32-34<br />
It is interesting to examine the intensity of a few key highmass<br />
ions when the MND is placed upon the bulk PTFE surface.<br />
One ion with structure [(CF2)nCF] + with n ) 32 at m/z 1631 is<br />
not observed unless the sample is treated with Ag or Au<br />
nanoparticles or unless a thin film of PTFE is prepared on an<br />
etched Ag substrate. Ths ion was chosen for examination since it<br />
is one of the most intense peaks in the Ag MND and Au MND<br />
spectra as well as being a characteristic oligomer ion for the bulk<br />
PTFE and the thin-film PTFE sample. Increased signal from the<br />
Ag and Au MND sample at m/z 1631 is observed and shown in<br />
Figure 7a and b, respectively. The [(CF2)32CF] + ion exhibits 22and<br />
160-fold enhancement with Au and Ag treatment, respectively.<br />
Ions formed from the Ag nanoparticle treated surfaces are 5-6<br />
times more abundant than their Au ion counterparts as demonstrated<br />
in Table 1. In addition, as shown in Figure 5 and Figure<br />
7a, there are more secondary ions formed using Ag MND than<br />
that of thin-film PTFE on etched Ag foil. Au MND PTFE has a<br />
secondary ion intensity equivalent to that of the thin-film PTFE<br />
on etched Ag foil for the [(CF2)32CF] + ion as seen in Figure 5<br />
and Figure 7b.<br />
(32) E. I.du Pont de Nemours & Co. US 2965565, 1958.<br />
(33) Fields, R. T. US 2456262, 1948.<br />
(34) Venkateswarlu, P.; Kolb, R. E.; Guethner, R. A. Polym. Prepr. 1989, 31 (1),<br />
360-361.
Figure 7. (a) Au nanoparticle treated PTFE at [(CF2)32CF] + . (b) Ag<br />
nanoparticle treated PTFE at [(CF2)32CF] + . Au and Ag nanoparticle<br />
treated samples have distinct peaks at [(CF2)32CF] + In addition to<br />
M + ,[M+ H] + and [M + 2H] + also occur as is evident from the spectra<br />
in (a) and (b) due to the width of the peaks.<br />
Table 1. Secondary Ion Yields (Y, 10 2 Counts/nC) and<br />
Enhancements (E) Measured for Tentagel and Bulk<br />
PTFE<br />
nanoparticle<br />
sample untreated Au Ag<br />
bulk PTFE [(CF2)32CF] +<br />
M Y not obsd 290 2000<br />
E 1 22 160<br />
M + Mea Y n/a 31 200<br />
E n/a 2 15<br />
tot<br />
enhancb 1 24 175<br />
Tentagel [O(CH2CH2O)28-<br />
(C6H4CH2CH2O2H)7] +<br />
M + H Y 1.1 38 54<br />
E 1 33 48<br />
M + Mea Y n/a 86 430<br />
E n/a 76 380<br />
tot<br />
enhancb 1 109 428<br />
Tentagel [(CH2CH2O)2] +<br />
M + H Y 1100 2900 4600<br />
E 1 3 4<br />
M + Mea Y n/a 1900 9000<br />
E n/a 2 8<br />
tot<br />
enhancb 1 5 12<br />
a All enhancements are calculated by enhancement untreated is yield<br />
untreated/yield untreated (E ) YUntreated/YUntreated) while enhancement<br />
treated is yield nanoparticle treated sample/yield untreated (E )<br />
YUntreated/YTreated). The metal cationized enhancement (+Me) calculations<br />
were calculated from the yield of the metal cationized peak over<br />
the yield of the untreated peak since the metal cationized peak for the<br />
peak will not occur on the untreated sample. b Total enhancement.<br />
It is possible to take advantage of the MND methodology to<br />
acquire molecule-specific images of the polymer surface as shown<br />
in Figure 8. Each sample shows areas of varied intensity and<br />
roughness due predominantly to the polymer topography. The<br />
untreated sample exhibits differences in intensity due to surface<br />
roughness and lower secondary ion formation as illustrated in<br />
Figure 8a-d. The Au and Ag MND samples exhibit differences<br />
in intensity due to topological effects as well. These effects are<br />
shown in Figure 8h and m, where the images represent the<br />
intensity variation of the respective metal ion as a result of<br />
differences in height of the polymer roughness. The topography<br />
Figure 8. (a) Total ion image from bulk PTFE. (b) Chemical ion<br />
image of 169 Da [((CF2)2)CF3] + . (c) 1100-3200 Da chemical image<br />
from untreated bulk PTFE. (d) Chemical overlay of 169 Da [((CF2)2)-<br />
CF3] + ] and 1100-3200 Da molecular image from pristine bulk Au<br />
nanoparticle treated PTFE. (e) Total ion image from Au NMD bulk<br />
PTFE. (f) Chemical image of bulk PTFE [((CF2)2)CF3] + peak. (g)<br />
Chemical image of Au bulk PTFE from 1100 to 3200 Da. (h) Chemical<br />
image of Ag + from bulk PTFE. (i) Overlay of chemical images from<br />
bulk PTFE of Ag + , [(CF2)2)CF3] + , and high mass. (j) Total ion image<br />
from Ag NMD bulk PTFE. (k) Chemical image of bulk PTFE [((CF2)2)-<br />
CF3] + peak. (l) Chemical image of Ag treated bulk PTFE 1100-3200<br />
Da. (m) Chemical image of Ag + from bulk PTFE. (n) Overlay of<br />
chemical images from bulk PTFE of Ag + , [((CF2)2)CF3] + , and 1100-<br />
3200 Da range of the Ag nanoparticle treated bulk PTFE.<br />
of the surfaces arise from the blade used to cut the samples which<br />
cause the total ion intensity variations seen in Figure 8e and j.<br />
Low-mass ions are formed where there is low metal ion signal.<br />
The highest intensity for the low-mass fragments, [(CF2)2CF3] +<br />
for Au and Ag treated PTFE (Figure 8f, k) coincides with the<br />
lowest intensity for the metal nanoparticle coverage (Figure 8h,<br />
m), respectively. This result implies that the lower the metal<br />
nanoparticle coverage, the higher the low-mass fragmentation will<br />
be from the polymer oligomers which evolve during the collision<br />
cascade.<br />
For the MND treated samples, the high-mass fragments<br />
colocalize with high the metal ion signal. The untreated bulk PTFE<br />
at high mass exhibits significantly lower intensity when compared<br />
to the MND treated samples. The red high-mass peak images<br />
(m/z 1100-3200 range, Figure 8g, l) do colocalize with the blue<br />
metal ion images (Figure 8h, m). The higher the metal nanoparticle<br />
coverage (Figure 8h, m), the greater the high-mass oligomer<br />
detection will be up to a point, of course. The MND sample<br />
preparation allows images of ion mappings to be acquired for bulk<br />
polymer surfaces. The uniformity of the metal nanoparticles is<br />
Analytical Chemistry, Vol. 78, No. 1, January 1, 2006 145
Figure 9. Ionization mechanisms during for increased secondary<br />
ion yields. (a) A neutral polymer fragment, which loses an electron<br />
to form a positively charged polymer ion. (b) An ionized metalpolymer<br />
fragment pair formed during the collision cascade, which<br />
undergoes a metastable decay into an ion and a neutral metal atom<br />
(c) A neutral polymer fragment collides with a metal cation to form a<br />
metal cationized polymer fragment ion. (d) Metal cationization due<br />
to a reaction between a neutral polymer fragment and a proton. This<br />
reaction could occur in the gas phase or at the surface of the metal<br />
nanoparticle.<br />
shown by the SEM images in Figure 1. These images are 1 µm<br />
whereas the TOF-SIMS images are 500 µm. This coverage is seen<br />
as a uniform coverage with a TOF-SIMS imaging experiment.<br />
MND enhancement of PTFE can occur by two main pathways:<br />
(1) the loss of an electron to form a free radical positively<br />
charged oligomer ion or (2) oligomer formation via metal<br />
cationization of the PTFE molecule followed by a metastable<br />
decay. A possible mechanism for oligomer ion formation is<br />
through the loss of an electron to form the ion from the neutral<br />
fragment to form the charged oligomer ion (Figure 9a). Oligomer<br />
ion formation in MND treated bulk PTFE occurs presumably from<br />
a metal-oligomer conjugate ion (formed through metal cationization,<br />
Figure 9b), which undergoes metastable decay into an<br />
oligomer ion and a neutral metal atom (Figure 9c). 28-31 Figure<br />
9d shows oligomer ion enhancement through a reaction with a<br />
proton. This mechanism is not applicable to the PTFE polymer<br />
since this polymer does not have any available hydrogen in its<br />
molecular structure.<br />
Positive Ion Signal Enhancement of Tentagel Beads Using<br />
MND. An application of MND for bulk polymer samples is the<br />
examination of Tentagel beads using Au and Ag nanoparticles.<br />
The most striking difference between the untreated sample and<br />
the MND treated Au and Ag treated Tentagel beads occur in the<br />
mass range from m/z 500 to 4000 as shown in Figures 10a and<br />
11a. There is significant ion formation in the mass range from<br />
m/z 500 to 1600 in the MND samples with oligomers of the form<br />
[((CH2)2O)n + Na] + and [((CH2)2O)n + CH2Na] + for both the Au<br />
and Ag treated samples as shown in Figures 10b and 11b for<br />
Tentagel-Au and Figures 10c and 11c for Tentagel-Ag. The<br />
[((CH 2 )2O)n + (CH2)2Na] + oligomer ion series is only present in<br />
the Au treated sample whereas the Ag MND sample exhibits the<br />
characteristic polymer fragment series [((CH2)2O)n + CH2ONa] +<br />
(Figure 11b, c). In the m/z range of 1600-4000, the MND samples<br />
exhibit ions cationized with either Ag or Au. The [((CH2)2)40-<br />
OCH2Au + (C6H4(CH2)2O2H)n] + occurs in the Au MND Tentagel<br />
sample (Figure 10b). The Ag MND sample exhibits two highmass<br />
oligomer ion series: [((CH2)2)28OAg + (C6H4(CH2)2O2H)n] +<br />
and [((CH2)2O)28AgNaHO2(CH2)2 + (C6H4O2(CH2)2H)n] + (Figure<br />
10c).<br />
It is instructive to select a few characteristic ions from the<br />
Tentagel beads to examine the degree of enhancement at high<br />
146 Analytical Chemistry, Vol. 78, No. 1, January 1, 2006<br />
Figure 10. Mass spectra of MND and untreated Tentagel beads<br />
from 0 to 4000 Da. Full spectra for Tentagel beads: (a) untreated;<br />
(b) Au MND Tentagel; (c) Ag-MND Tentagel. The fingerprint region<br />
is from m/z 0 to 200. Significant oligomer ion formation occurs in two<br />
regions: 500-1600 and 1600-4000 Da. The oligomer ions formed<br />
from 1600 to 4000 Da are [((CH2)2)40OCH2Au + (C6H4(CH2)2O2H)n] +<br />
for the Au MND treated sample and [((CH2)2)28OAg + (C6H4-<br />
(CH2)2O2H)n] + and [((CH2)2O)28AgNaHO2(CH2)2 + (C6H4O2(CH2)2H)n] +<br />
for the Ag MND treated sample.<br />
Figure 11. Untreated Tentagel from m/z 500 to 1600. (a) The<br />
spectrum for the untreated control. (b) Au MND Tentagel from m/z<br />
500 to 1600. There are three characteristic oligomer ion series:<br />
[((CH2)2O)n+Na] + , [((CH2)2O)n + CH2Na] + , and [((CH2)2O)n + (CH2)2-<br />
Na] + . (c) Ag MND Tentagel from m/z 500 to 1600. There are three<br />
characteristic oligomer ion series: [((CH2)2O)n + Na] + , [((CH2)2O)n<br />
+ CH2Na] + , and [((CH2)2O + CH2ONa] + .<br />
mass due to MND treatment. An abundant, characteristic ion for<br />
examination is at m/z 2209 [O(CH2CH2O)28(C6H4CH2CH2O2H)7<br />
+ H] + and the metalated homologues m/z 2405 [AuO(CH2-<br />
CH2O)28(C6H4CH2CH2O2H)7] + and m/z 2315 and 2317 [AgO(CH2-<br />
CH2O)28(C6H4CH2CH2O2H)7] + associated with this high-mass<br />
peak. The untreated sample does not exhibit a peak at m/z 2209<br />
(Figure 12a). There is significant signal for the high-mass oligomer<br />
ion plus a proton at m/z 2209 for the Au and Ag MND treated<br />
Tentagel beads. The m/z 2209 peak is clearly seen in the Au and<br />
Ag MND Tentagel bead spectra (Figure 12b, c). The enhancement
Figure 12. (a) Pristine Tentagel bead signal at high mass [(CH2-<br />
CH2O)50 + H]. (b) Au nanoparticle treated Tentagel beads for<br />
[((CH2)2O28(C6H4(CH2)2O2H)7O] + and [((CH2)2O28(C6H4(CH2)2O2H)7O] +<br />
+ Au] + . (c) Au nanoparticle treated Tentagel beads for [((CH2)2O28-<br />
(C6H4(CH2)2O2H)7O] + and [((CH2)2O28(C6H4(CH2)2O2H)7O + Ag] + .<br />
Figure 13. (a) Untreated low-mass region for the protonated dimer<br />
[(CH2CH2O)2 + H] + . (b) Au nanoparticle treated Tentagel low-mass<br />
dimer [(CH2CH2O)2 + H] + region. Unlike the pristine bead, the signal<br />
is higher and even exceeds the styrene peak (91 Da), which was not<br />
the case in the pristine bead (a). (c) Ag nanoparticle treated Tentagel<br />
bead in the [(CH2CH2O)2 + H] + region.<br />
of the Au MND and Ag MND samples were 33 and 48 (Table 1).<br />
Other enhancement factors are noted in Table 1. While the<br />
emphasis of this paper deals with the larger secondary ion yields<br />
at high mass from polymer samples, there is also a small degree<br />
of signal enhancement noted at low mass for proton cationized<br />
species of Tentagel beads as shown in Figure 13.<br />
The increased sensitivity using MND on a polymer improves<br />
molecular imaging of the polymer surface due to the increased<br />
protonated and metalated oligomer ions. The total ion images<br />
(Figure 14a, c, and g) show that the MND treatment results in<br />
higher secondary ion signal. The signal for the protonated<br />
Tentagel fragment, at m/z 2209, is clearly seen with MND (Figure<br />
14d, h). This result means that the MND treatment enables the<br />
oligomer ion to be formed and retain stability during the course<br />
of the SIMS experiment. The metal ion signal is depicted with<br />
the blue chemical mappings (Figure 14f, j). The highest degree<br />
of protonated oligomer ion at m/z 2209 localizes to the most<br />
intense regions of the metal ion images.<br />
Utilizing metal nanoparticles facilitates metal cationization of<br />
oligomer ions on Tentagel beads. Should the characteristic<br />
Figure 14. (a) Total ion image untreated Tentagel bead. (b)<br />
Chemical image of 2209 Da [O(CH2CH2O)28(C6H4CH2CH2O2H)7 +<br />
H] + . (c) Total ion image Ag NMD Tentagel bead. (d) 2209 Da [O(CH2-<br />
CH2O)28(C6H4CH2CH2O2H)7 + H] + chemical image from the bead.<br />
(e) 2315 Da [AgO(CH2CH2O)28(C6H4CH2CH2O2H)7] + chemical image<br />
from NMD Tentagel bead. (f) Ag + chemical image from NMD Tentagel<br />
bead. (g) Total ion image of Au NMD Tentagel beads. (h) 2208 Da<br />
[O(CH2CH2O)28(C6H4CH2CH2O2H)7 + H] + . (i) 2405 Da [AuO(CH2-<br />
CH2O)28(C6H4CH2CH2O2H)7] + chemical image. (j) Au + chemical<br />
image from NMD Tentagel bead.<br />
polymer fragment ion plus a proton peak not be present when<br />
using MND, the metalated characteristic fragments may be<br />
formed. For example, the MND Tentagel beads have metalated<br />
characteristic fragments at m/z 2315 [AgO(CH2CH2O)28(C6H4CH2-<br />
CH2O2H)7] + and m/z 2415 [AuO(CH2CH2O)28(C6H4CH2CH2O2H)7] + ,<br />
as seen in Figure 14e and j. One interesting point is that the<br />
secondary ion formation for the metalated oligomer fragments<br />
colocalize with the most intense areas of the metal ion images<br />
(Figure 14e, f and i, j). The colocalization means that these highmass<br />
ions form exclusively where the metal nanoparticles occur,<br />
suggesting that both the metal cationization and protonation are<br />
enhanced because of the presence of the nanoparticles.<br />
Mechanisms of Positive Secondary Ion Enhancement.<br />
There is not yet a comprehensive theory to describe the mechanism<br />
behind the influence of MND on polymer surfaces. We<br />
presume that the phenomenon is very similar to that observed<br />
by Delcorte et al. with metal evaporation experiments. 11,12 His<br />
group proposed that cationized high-mass oligomer ions (2-kDa<br />
oligomers) originate from these high-mass molecules neighboring<br />
metal islands through improved or additional charge-transfer<br />
mechanisms. 12,35 In our case, similar dynamics undoubtedly takes<br />
place, although the uniformity of the size of the clusters offer some<br />
interesting ways to time the enhancement even further. 20,36<br />
Metal cationization plays a large role in signal enhancement<br />
from MND on bulk polymers. The Tentagel system exhibits M<br />
+ Me + fragments from m/z 1250 to 3000 for the Au and Ag treated<br />
samples (Figure 9b). Unlike the Tentagel, the PTFE only shows<br />
the oligomer fragments, M + . These oligomer ions may form from<br />
a metastable decay from M + Me + to M + (Figure 9c).<br />
(35) Delcorte, A.; Garrison, B. J. J. Phys. Chem. B 2004, 108 (40), 15652-15661.<br />
(36) Ahmadi, T. S.; Zhong L. W.; Green T. C.; Henglein A.; El-Sayed M. A. Science<br />
1996, 272, 1924-1926.<br />
Analytical Chemistry, Vol. 78, No. 1, January 1, 2006 147
Increased secondary ion formation also occurs as a result of a<br />
loss of an electron from the polymer to the metal nanoparticle.<br />
The charged secondary ion radical formation forms from a<br />
donation of an electron from the polymer molecule to the metal<br />
nanoparticle. 37,38 The loss of one electron helps to stabilize the<br />
secondary PTFE oligomer ion facilitating its enhancement with<br />
MND (Figure 9d).<br />
The protonation due to metal nanoparticle deposition can<br />
improve the secondary ion formation of the Tentagel polymer.<br />
Metal nanoparticles have been found to have protons adhering<br />
to their surfaces. 39 This abundance of hydrogen ions at the surface<br />
of the metal nanoparticles may allow increased ionization to occur<br />
during the collision cascade since this is an extra source of protons<br />
over those inherent hydrogen ions available in the bulk polymer.<br />
These hydrogen ions can be kicked into the gas phase during<br />
the collision cascade, enabling M + H + to be more readily formed<br />
(Figure 9c).<br />
Negative Ion Signal Enhancement of PTFE and Tentagel<br />
Using MND. The negative ion SIMS spectra were investigated<br />
with TOF-SIMS for both PTFE and Tentagel beads. Examination<br />
of PTFE without metal nanoparticle deposition exhibits only lowmass<br />
fragments. 40 Addition of metal nanoparticles to the surface<br />
allows many strong oligomers to be detected due to increased<br />
secondary ion formation although anionization is not observed.<br />
For example, [(CF2)nC2F4] - oligomer ions are found to be<br />
enhanced with MND. The same trend also occurs in negative<br />
mode with Tentagel beads where the observed characteristic<br />
oligomer ions are [(C16H22O5)nC6H5CH2CH2OCH2CH2O] - . The<br />
(37) Chapman, R.; Mulvaney, P. Chem. Phys. Lett. 2001, 349, 358-362.<br />
(38) Cury, L. A.; Ladeira, L. O.; Righi, A. Synth. Met. 2003, 139, 283-286.<br />
(39) Buckart, S.; Gantefor, G.; Kim, Y. D.; Jena, P. J. Am. Chem. Soc. 2003, 125<br />
(46), 14205-14209.<br />
(40) The Static SIMS Library, 1st ed.; John Wiley & Sons: New York, 1996; Vol.<br />
2.<br />
148 Analytical Chemistry, Vol. 78, No. 1, January 1, 2006<br />
degree of enhancement in negative mode for both PTFE and<br />
Tentagel is similar to that of the positive ion mode enhancement.<br />
CONCLUSIONS<br />
Utilizing MND, a simple ex vacuo technique, signal enhancement<br />
of high-mass oligomer ions from PTFE and Tentagel bulk<br />
polymers, has been achieved. Utilizing metal nanoparticles allows<br />
control of the size of the metal particles. This control in size and<br />
shape may allow a further signal enhancement for TOF-SIMS<br />
experiments. Greater intensities of secondary ions are formed with<br />
MND treatment over the secondary ion intensities from untreated<br />
samples. Increased sensitivity of SIMS images on bulk polymer<br />
surfaces are obtained through MND treatment on both PTFE and<br />
Tentagel. In the future, we hope to utilize MND to characterize a<br />
small combinatorial library on bead and to enable an examination<br />
of cells with focused ion beams.<br />
ACKNOWLEDGMENT<br />
Financial support was provided by the National Science<br />
Foundation and the National Institutes of Health. We thank Mark<br />
Angelone for the SEM data of the Tentagel beads. The authors<br />
acknowledge Dr. Amy Walker, Dr. Ben Zion, Dr. Frederick Sauls,<br />
Dr. Audra Sostarecz, Dr. Barbara Garrison, Dr. Arnot Delcorte,<br />
Carrie McQuaw, and Zihua Zhu for their constructive discussions<br />
during these experiments.<br />
Received for review August 4, 2005. Accepted October 25,<br />
2005.<br />
AC0513921