Transparency and Liquidity - the Babson College Faculty Web Server
Transparency and Liquidity - the Babson College Faculty Web Server
Transparency and Liquidity - the Babson College Faculty Web Server

Create successful ePaper yourself
Turn your PDF publications into a flip-book with our unique Google optimized e-Paper software.
<strong>Transparency</strong> <strong>and</strong> <strong>Liquidity</strong>: A Controlled<br />
Experiment on Corporate Bonds<br />
Michael A. Goldstein<br />
<strong>Babson</strong> <strong>College</strong><br />
Edith S. Hotchkiss<br />
Boston <strong>College</strong><br />
Erik R. Sirri<br />
<strong>Babson</strong> <strong>College</strong><br />
This article reports <strong>the</strong> results of an experiment designed to assess <strong>the</strong> impact of lastsale<br />
trade reporting on <strong>the</strong> liquidity of BBB corporate bonds. Overall, adding transparency<br />
has ei<strong>the</strong>r a neutral or a positive effect on liquidity. Increased transparency is<br />
not associated with greater trading volume. Except for very large trades, spreads on<br />
newly transparent bonds decline relative to bonds that experience no transparency<br />
change. However, we find no effect on spreads for very infrequently traded bonds.<br />
The observed decrease in transaction costs is consistent with investors’ ability to<br />
negotiate better terms of trade once <strong>the</strong>y have access to broader bond-pricing data.<br />
(JEL codes: G14, G18, G23, G24, G28)<br />
Although larger than <strong>the</strong> market for US Government or municipal bonds,<br />
<strong>the</strong> corporate bond market historically has been one of <strong>the</strong> least transparent<br />
securities markets in <strong>the</strong> United States, with nei<strong>the</strong>r pretrade nor<br />
posttrade transparency. Corporate bonds trade primarily over-<strong>the</strong>-counter,<br />
<strong>and</strong> until recently, no centralized mechanism existed to collect <strong>and</strong><br />
disseminate posttransaction information. This structure changed on July<br />
1, 2002, when <strong>the</strong> National Association of Securities Dealers (NASD)<br />
began a program of increased posttrade transparency for corporate<br />
bonds, known as <strong>the</strong> Trade Reporting <strong>and</strong> Compliance Engine<br />
(TRACE) system. As part of this structural change, only a selected subset<br />
of bonds initially was subject to public dissemination of trade information.<br />
The resulting experiment enables us to observe <strong>the</strong> effects of<br />
increased posttrade transparency on market liquidity in a controlled<br />
setting.<br />
The authors are grateful to David Pedersen for extensive research assistance. We thank Amy Edwards,<br />
Amar G<strong>and</strong>e, Jean Helwege, Kenneth Kavajecz, Marc Lipson, Michael Piwowar, Patrik S<strong>and</strong>as, Arthur<br />
Warga, <strong>and</strong> seminar participants at <strong>the</strong> Bank of Canada, Boston <strong>College</strong>, Queen’s University, University<br />
of Arizona, University of Mississippi, University of Virginia, <strong>and</strong> <strong>the</strong> 2006 American Finance Association<br />
Annual Meetings for helpful discussions. All remaining errors are those of <strong>the</strong> authors.<br />
Ó The Author 2006. Published by Oxford University Press on behalf of The Society for Financial Studies. All rights<br />
reserved. For permissions, please email: journals.permissions@oxfordjournals.org.<br />
doi:10.1093/rfs/hhl020 Advance Access publication July 1, 2006
The Review of Financial Studies / v 20 n 2 2007<br />
With <strong>the</strong> July 2002 introduction of TRACE, all NASD members were<br />
required for <strong>the</strong> first time to report prices, quantities, <strong>and</strong> o<strong>the</strong>r information<br />
for all secondary market transactions in corporate bonds. 1 Some<br />
market participants <strong>and</strong> regulators initially were concerned that public<br />
dissemination of this data for smaller <strong>and</strong> lower grade bonds might have<br />
an adverse impact on liquidity. Therefore, as of July 2002, <strong>the</strong> trade<br />
information collected by <strong>the</strong> NASD was publicly disseminated only for<br />
investment grade issues (bonds rated BBB <strong>and</strong> above) with issue sizes<br />
greater than $1 billion. Dissemination of trade information for all o<strong>the</strong>r<br />
bonds was to be phased in later, pending a series of studies of <strong>the</strong> likely<br />
impact of increased transparency.<br />
The first study, which is <strong>the</strong> subject of this article, involved a controlled<br />
experiment designed to test <strong>the</strong> impact of transparency on liquidity for <strong>the</strong><br />
BBB bond market. Using nonpublic TRACE trade data for all BBB<br />
bonds from July 2002 to February 2003, we selected 120 bonds for<br />
which <strong>the</strong> NASD subsequently began public dissemination of trade<br />
data. These bonds fell into two groups, 90 more actively traded bonds<br />
<strong>and</strong> 30 relatively inactive bonds, enabling us to examine transparency<br />
issues across <strong>the</strong> liquidity spectrum. 2 We simultaneously identified a<br />
control sample of nondisseminated bonds. This provided us <strong>the</strong> opportunity<br />
to conduct a true experiment by altering <strong>the</strong> transparency properties<br />
of some of <strong>the</strong>se securities. By intertemporally comparing <strong>the</strong> trades of<br />
<strong>the</strong> disseminated bonds with <strong>the</strong>mselves before <strong>and</strong> after <strong>the</strong>y were made<br />
transparent, <strong>and</strong> by comparing <strong>the</strong> trades of <strong>the</strong> disseminated bonds with<br />
those of <strong>the</strong> matching but nondisseminated bonds, we, in our experiment,<br />
gauge <strong>the</strong> effects of transparency on bond liquidity in a systematic <strong>and</strong><br />
controlled framework.<br />
The NASD began public dissemination of trades in <strong>the</strong> 120 selected<br />
BBB bonds on April 14, 2003. We were provided not only with data for<br />
<strong>the</strong> 120 disseminated bonds but <strong>the</strong> entire universe of BBB-rated corporate<br />
bonds, whe<strong>the</strong>r disseminated or not. After applying some filters, <strong>the</strong><br />
data set we analyze for our study consists of all trades from July 8, 2002 to<br />
February 27, 2004 for 4888 BBB-rated corporate bonds that have an<br />
original issue size between $10 million <strong>and</strong> $1 billion.<br />
1<br />
Before TRACE, transaction information for high-yield bonds was collected by <strong>the</strong> NASD under <strong>the</strong><br />
Fixed Income Pricing System (FIPS), but only hourly trading summaries for a sample of 50 high-yield<br />
bonds were publicly disseminated. See Hotchkiss <strong>and</strong> Ronen (2002) <strong>and</strong> Alex<strong>and</strong>er, Edwards, <strong>and</strong> Ferri<br />
(2000) for fur<strong>the</strong>r description of <strong>the</strong> FIPS reporting requirements.<br />
2<br />
As noted by Federal Register (2002), <strong>the</strong> NASD was charged with having independent economists (<strong>the</strong><br />
authors of this article) design an experiment to test <strong>the</strong> effects of transparency on corporate bond<br />
liquidity. We were originally m<strong>and</strong>ated to choose only 90 BBB bonds to begin dissemination. However,<br />
including too many infrequently traded bonds in our m<strong>and</strong>ated 90-bond sample would potentially<br />
compromise <strong>the</strong> power of our tests. Therefore, we requested that an additional, separate group of 30<br />
thinly traded bonds be made subject to dissemination as well. See Federal Register (2003) for more<br />
details.<br />
236
Credit Ratings as Coordination Mechanisms<br />
We find that depending on trade size, increased transparency has ei<strong>the</strong>r<br />
a neutral or a positive effect on market liquidity, as measured by trading<br />
volume or estimated bid-ask spreads. Measures of trading activity, such<br />
as daily trading volume <strong>and</strong> number of transactions per day, show no<br />
relative increase, indicating that increased transparency does not lead to<br />
greater trading interest in our sample period. The relatively long (10<br />
months) posttransparency period suggests that this lack of increased<br />
trading volume is not due to <strong>the</strong> newness of <strong>the</strong> market changes. For all<br />
but <strong>the</strong> largest trade size group, spreads decrease for bonds whose prices<br />
become transparent by more than <strong>the</strong> amount that spreads decline for our<br />
control bonds. This effect is strongest for small <strong>and</strong> intermediate trade<br />
sizes: for trades between 101 <strong>and</strong> 250 bonds, relative to <strong>the</strong>ir controls,<br />
spreads on <strong>the</strong> 90 disseminated bonds fall by ei<strong>the</strong>r 38 or 22 basis points<br />
(per $100 face value) more, depending on <strong>the</strong> spread estimation method.<br />
The decrease in transaction costs for such trades is consistent with investors’<br />
ability to negotiate better terms of trade with dealers once <strong>the</strong><br />
investors have access to broader bond-pricing data. We do not find a<br />
significant change in spreads for very thinly traded bonds. Thus, overall,<br />
we find that increased transparency has a neutral or a positive effect on<br />
liquidity.<br />
Because pretrade quote data do not exist for this market, we estimate<br />
<strong>the</strong> impact of transparency on spreads using two different techniques. We<br />
first measure spreads directly by measuring <strong>the</strong> round-trip cost of a dealer<br />
purchase from a customer followed by a sale of that bond by <strong>the</strong> same<br />
dealer to ano<strong>the</strong>r customer (a dealer round-trip or DRT) within a specified<br />
time period. This DRT method is similar to that used by Green,<br />
Hollifield, <strong>and</strong> Schurhoff (2004) <strong>and</strong> Biais <strong>and</strong> Green (2005) in <strong>the</strong>ir<br />
studies of municipal bonds, except that we use additional information<br />
provided in our data set which identifies individual dealers (using an<br />
anonymous code for each dealer). A distinct advantage of this approach<br />
is that it provides a measure of bond spreads that is simple to interpret<br />
<strong>and</strong> is not dependent on assumptions used to model spreads.<br />
Using this method, for all BBB bonds we find that for round-trips that<br />
occur within one day, spreads average $2.35 (median $2.25) per $100 face<br />
value for trades up to 10 bonds. These costs fall to $0.50 (median $0.31)<br />
per $100 for trades of 1000 bonds or more. For both <strong>the</strong> 90 disseminated<br />
bonds <strong>and</strong> <strong>the</strong>ir nondisseminated controls, we find for all trade size<br />
groups that customer transaction costs fall from <strong>the</strong> predissemination to<br />
postdissemination time period. 3 However, for all but <strong>the</strong> largest trade size<br />
groups, transaction costs fall more for <strong>the</strong> 90 disseminated bonds than for<br />
<strong>the</strong>ir nondisseminated controls. In addition, our cross-sectional analysis,<br />
3 We do not include <strong>the</strong> additional 30 less active disseminated BBB bonds (<strong>and</strong> <strong>the</strong>ir controls) in <strong>the</strong>se<br />
comparisons because of <strong>the</strong> relatively small number of observations of DRTs.<br />
237
The Review of Financial Studies / v 20 n 2 2007<br />
which controls for additional bond characteristics affecting spreads,<br />
shows that spreads are lower when <strong>the</strong> bonds are disseminated, reaching<br />
a maximum decline of 67 basis points for intermediate size trades.<br />
We also estimate spreads using a second methodology similar to that of<br />
Warga (1991) <strong>and</strong> Schultz (2001), based on regression estimates of <strong>the</strong><br />
difference between transaction prices <strong>and</strong> <strong>the</strong> previous day’s estimated<br />
bid price as reported by Reuters. The regression-based results, which utilize<br />
all trading data over this time period, support <strong>the</strong> results found using <strong>the</strong><br />
more direct DRT method. For <strong>the</strong> 90 disseminated more actively traded<br />
bonds, transparency is associated with an additional decrease in costs, over<br />
<strong>and</strong> above market-wide changes; this decline is greatest for small trades of<br />
10 bonds or less (60 basis points per $100 face value), falls to a decline of<br />
17.4 basis points for trades of up to 1000 bonds, <strong>and</strong> is insignificant for<br />
trade sizes greater than 1000 bonds. However, for <strong>the</strong> additional disseminated<br />
sample of 30 less active BBB bonds, we find no significant effect of<br />
transparency ei<strong>the</strong>r overall or for any trade size group.<br />
Our analyses are related to those in two o<strong>the</strong>r recent working papers.<br />
Using <strong>the</strong> TRACE data, Edwards, Harris, <strong>and</strong> Piwowar (2005) fit a timeseries<br />
model of transaction costs for individual bonds. They <strong>the</strong>n use this<br />
model in a cross-sectional regression to explain determinants of transaction<br />
costs <strong>and</strong> conclude that transparency is associated with about a 10<br />
basis point drop in spreads overall for bonds of all ratings (including<br />
BBB). Bessembinder, Maxwell, <strong>and</strong> Venkataraman (2005) estimate <strong>the</strong><br />
impact of TRACE on trading costs using insurance company trades<br />
reported at <strong>the</strong> daily level to <strong>the</strong> National Association of Insurance<br />
Commissioners (NAIC). The NAIC data set permits <strong>the</strong> authors to<br />
evaluate <strong>the</strong> impact of transparency by examining costs relative to those<br />
estimated before <strong>the</strong> July 2002 start of TRACE. 4 For <strong>the</strong> large institutional<br />
trades included in <strong>the</strong>ir data set, <strong>the</strong>y conclude that <strong>the</strong>re is a 12 to<br />
14 basis point reduction in round-trip trade execution costs for bonds that<br />
become disseminated on TRACE.<br />
An important difference of our work is that ra<strong>the</strong>r than focusing on <strong>the</strong><br />
cross-sectional determinants of trading costs, we focus on <strong>the</strong> BBB transparency<br />
experiment. For all o<strong>the</strong>r investment grade credit ratings besides<br />
BBB, all bonds of a given rating <strong>and</strong> issue size are ei<strong>the</strong>r subject or not<br />
subject to dissemination under TRACE at a given time. The BBB market<br />
is <strong>the</strong> only case in which we can simultaneously observe bonds of <strong>the</strong> same<br />
credit rating <strong>and</strong> matched on characteristics such as issue size <strong>and</strong> trading<br />
activity, some of which are disseminated <strong>and</strong> some of which are not.<br />
Fur<strong>the</strong>rmore, both regulators <strong>and</strong> market participants believed <strong>the</strong><br />
4 Hong <strong>and</strong> Warga (2000) <strong>and</strong> Chakravarty <strong>and</strong> Sarkar (2003) provide estimates of trading costs from <strong>the</strong><br />
NAIC data set for an earlier time period. See also Chen, Lesmond, <strong>and</strong> Wei (2005) for discussion of<br />
liquidity measures for corporate bonds.<br />
238
Credit Ratings as Coordination Mechanisms<br />
market for <strong>the</strong> highest rated <strong>and</strong> very large issues, which are less information<br />
sensitive <strong>and</strong> also have more close substitutes, would not behave in <strong>the</strong> same<br />
manner as lower rated or smaller issues, hence <strong>the</strong> willingness to begin<br />
dissemination for bonds rated above BBB sooner. 5 Over <strong>the</strong> time period<br />
we examine, trading in BBB bonds accounted for 37% of <strong>the</strong> number of<br />
trades <strong>and</strong> 33% of <strong>the</strong> face amount traded for all secondary market<br />
transactions in corporate bonds of any rating reported to TRACE.<br />
Our article also differs from <strong>the</strong>se articles in <strong>the</strong> methods used to estimate<br />
trading costs. For large trades, our median estimate of spreads for DRTs<br />
that occur within one day are close to <strong>the</strong> 27 basis point estimate reported by<br />
Schultz (2001). An advantage of <strong>the</strong> DRT measure is that it does not utilize<br />
any data external to <strong>the</strong> TRACE data or any econometric models for<br />
estimating prices for bonds that are infrequently traded. Our regressionbased<br />
spread estimates are somewhat higher, but <strong>the</strong> increase in magnitude<br />
can be partially explained by <strong>the</strong> presence of more extreme observations in<br />
<strong>the</strong> data. The methods we use allow us to disentangle any nonlinear effects,<br />
such as those due to overall trading frequency, which we find to be an<br />
important determinant of <strong>the</strong> impact of transparency.<br />
From a <strong>the</strong>oretical perspective, <strong>the</strong> impact of transparency on market<br />
liquidity is ambiguous, as noted by Madhavan (1995), Pagano <strong>and</strong> Roell<br />
(1996), <strong>and</strong> Naik, Neuberger, <strong>and</strong> Viswanathan (1999). 6 Greater transparency<br />
may reduce adverse selection <strong>and</strong> encourage uninformed investors<br />
to enter <strong>the</strong> trading arena. At <strong>the</strong> same time, it may change <strong>the</strong><br />
economics of trading by market makers who supply liquidity. In a<br />
world with posttrade reporting, a market maker can be in a difficult<br />
bargaining position to unwind her inventory following a large trade,<br />
leading her to charge a premium for this risk. Bloomfield <strong>and</strong> O’Hara<br />
(1999) provide experimental evidence showing that opening spreads are<br />
larger but subsequent spreads are tighter when ex post transparency is<br />
enhanced. Resolving this debate empirically has been difficult because<br />
<strong>the</strong>re are very few settings that in practice allow us to observe <strong>the</strong> impact<br />
of a change in transparency. 7 The introduction of <strong>the</strong> TRACE system,<br />
5 The disseminated bonds considered by Edwards et al. (2005) <strong>and</strong> Bessembinder et al. (2005) include<br />
investment grade bonds with issue size over $1 billion, which were disseminated upon <strong>the</strong> July 2002 start<br />
of TRACE, <strong>and</strong> <strong>the</strong> 50 high-yield bonds disseminated under TRACE to provide continuity for bonds<br />
previously reported under <strong>the</strong> FIPS system. The set of 50 high-yield bonds disseminated under TRACE<br />
were not selected r<strong>and</strong>omly; bonds disseminated as of July 2002 under TRACE were already disseminated<br />
under FIPS (thus, we would observe <strong>the</strong> impact of <strong>the</strong> incremental transparency). In addition to <strong>the</strong><br />
dissemination of <strong>the</strong> 120 selected BBB bonds on April 14, 2003, <strong>the</strong> NASD began dissemination of trade<br />
information for all bonds rated A <strong>and</strong> above with issue sizes over $100 million on March 3, 2003.<br />
6 Biais, Glosten, <strong>and</strong> Spatt (2005) provide an overview of <strong>the</strong>se arguments.<br />
7 A notable exception examining changes in posttrade transparency is <strong>the</strong> finding of Gemmill (1996), who<br />
finds that dealer spreads were not affected by changes in <strong>the</strong> trade disclosure delay for large trades on <strong>the</strong><br />
London Stock Exchange (LSE). However, while <strong>the</strong> length of <strong>the</strong> delay was varied, posttrade transparency<br />
was not removed completely for that market. In fur<strong>the</strong>r contrast to our study, pretrade transparency<br />
also existed for <strong>the</strong> LSE.<br />
239
The Review of Financial Studies / v 20 n 2 2007<br />
<strong>and</strong> specifically <strong>the</strong> experiment we have structured using <strong>the</strong> BBB market,<br />
provides such an opportunity to observe <strong>the</strong>se effects.<br />
This article is organized as follows. Section 1 describes <strong>the</strong> TRACE<br />
system <strong>and</strong> <strong>the</strong> data used in <strong>the</strong> study. Section 2 considers <strong>the</strong> effect of<br />
transparency on trading frequency <strong>and</strong> volume. Section 3 analyzes <strong>the</strong><br />
effect of increased transparency on bond spreads results using our two<br />
different estimation methods. Section 4 summarizes <strong>and</strong> concludes <strong>the</strong><br />
article.<br />
1. Data Description <strong>and</strong> Design of <strong>the</strong> Experiment<br />
We analyze all secondary market trades in 4888 BBB-rated corporate<br />
bonds for <strong>the</strong> time period July 8, 2002 through February 27, 2004. Our<br />
data set includes all bond trades during this time, with <strong>the</strong> exception of a<br />
comparatively small amount of trading activity on <strong>the</strong> NYSE’s Automated<br />
Bond System (ABS), which is not reported through TRACE.<br />
NASD (2004) estimates that 99.9% of trading is transacted over-<strong>the</strong>counter<br />
<strong>and</strong> is <strong>the</strong>refore included in our data.<br />
1.1 Selection of bonds for dissemination <strong>and</strong> for nondisseminated control<br />
groups<br />
The selection of BBB bonds for dissemination under TRACE was based<br />
on transactions that occurred in <strong>the</strong> period from July 8, 2002 through<br />
January 31, 2003 (<strong>the</strong> selection period). Our selection process excluded<br />
convertible bonds, bonds from banks, <strong>and</strong> bonds with unusual features.<br />
We also eliminated BBB bonds with an issue size over $1 billion, as <strong>the</strong>ir<br />
prices were already disseminated as of July 1, 2002, <strong>and</strong> bonds with an<br />
issue size less than $10 million. Because Hotchkiss, Jostova, <strong>and</strong> Warga<br />
(2005) indicate that <strong>the</strong>re is an abnormal amount of trading in <strong>the</strong> first<br />
few months following issuance, we did not include newly issued bonds.<br />
We also excluded bonds with less than one year remaining to maturity.<br />
Because of concerns about <strong>the</strong> statistical power of our tests, we chose<br />
two groups of bonds for dissemination based on <strong>the</strong>ir frequency of trading<br />
in <strong>the</strong> selection period. First, we identified 90 pairs of bonds, matching<br />
on industry, trading activity (average trades per day) during <strong>the</strong> selection<br />
period, bond age, <strong>and</strong> time to maturity. We required that <strong>the</strong>se bonds<br />
traded at least once per week on average during <strong>the</strong> selection period. As<br />
pairs of bonds were created, one bond was r<strong>and</strong>omly chosen to be<br />
disseminated <strong>and</strong> <strong>the</strong> o<strong>the</strong>r was assigned to a nondisseminated control<br />
group (<strong>the</strong> ‘‘matching’’ control bonds). We <strong>the</strong>n identified an additional<br />
sample of 30 thinly traded bonds for dissemination, requiring only that<br />
<strong>the</strong> bonds traded on average at least once every two weeks but less than<br />
once every two days on average during <strong>the</strong> selection period. Because<br />
<strong>the</strong> 30 thinly traded bonds trade so infrequently, we do not construct a<br />
240
Credit Ratings as Coordination Mechanisms<br />
bond-by-bond matched control sample for empirical analysis. 8 In total,<br />
120 BBB bonds (90 actively traded <strong>and</strong> 30 thinly traded) were subject to<br />
dissemination under TRACE on April 14, 2003.<br />
As Davies <strong>and</strong> Kim (2004) note, creating a control set from matching<br />
pairs is at times optimal, while at o<strong>the</strong>r times a larger control portfolio<br />
may be optimal. Using <strong>the</strong> matching approach, it is possible that results<br />
may be sensitive to <strong>the</strong> particular choice of bonds for <strong>the</strong> control portfolio.<br />
Using a broader control portfolio, however, will include more bonds<br />
that are quite dissimilar to those that are disseminated. Fur<strong>the</strong>rmore,<br />
given <strong>the</strong> substantially smaller number of observations, we do not construct<br />
a matched control sample for <strong>the</strong> 30 thinly traded bonds. Therefore,<br />
we use both approaches in our tests. For <strong>the</strong> 90 actively traded<br />
disseminated bonds, in addition to <strong>the</strong> matched control sample, we also<br />
construct a ‘‘nondisseminated control portfolio’’ consisting of bonds<br />
whose average number of trades per day is between <strong>the</strong> minimum <strong>and</strong><br />
maximum observed for <strong>the</strong> 90 disseminated bonds in <strong>the</strong> period July 8,<br />
2002 to January 31, 2003. This control portfolio consists of 2997 bonds,<br />
whose average daily trade count in <strong>the</strong> selection period ranges from<br />
0.2105 to 24.8.<br />
We use a similar procedure to construct a control portfolio for <strong>the</strong> 30<br />
thinly traded bonds. This produces a nondisseminated control portfolio<br />
consisting of 1704 bonds, whose average daily trade count in <strong>the</strong> selection<br />
period ranges from 0.1 to 0.4. By comparing <strong>the</strong> 30 thinly traded bonds to<br />
<strong>the</strong>ir corresponding nondisseminated control portfolio, we obtain meaningful<br />
results for <strong>the</strong> effects of transparency on <strong>the</strong>se bonds.<br />
1.2 Characteristics <strong>and</strong> trading activity of disseminated <strong>and</strong> control bonds<br />
Industry categories <strong>and</strong> o<strong>the</strong>r bond characteristics for each group of<br />
bonds, as well as for <strong>the</strong> full set of BBB bonds, are summarized in<br />
Table 1. The data for <strong>the</strong> full set of all BBB bonds indicate <strong>the</strong> dominance<br />
of financial firms in this market: over 44% of all bonds are issued by<br />
financial firms or subsidiaries, although many o<strong>the</strong>r industries are also<br />
represented. Subsequent results using control portfolios are insensitive to<br />
<strong>the</strong> removal of financial issuers from those portfolios. Table 1 also<br />
summarizes that (by construction) <strong>the</strong> matching nondisseminated bonds<br />
have <strong>the</strong> same distribution across industries as <strong>the</strong> 90 disseminated bonds.<br />
Table 2 summarizes o<strong>the</strong>r bond traits that have been shown in previous<br />
studies to affect inferences concerning bond liquidity, as well as trading<br />
activity for <strong>the</strong> entire period from July 8, 2002 to February 27, 2004. By<br />
construction, <strong>the</strong> issue size, years to maturity, <strong>and</strong> age match closely for<br />
8 As previously described, for <strong>the</strong> 30-bond sample, we rely instead on our regression-based methodology<br />
using a portfolio of control bonds, which allows us to control for bond characteristics while providing a<br />
substantial increase in <strong>the</strong> number of observations.<br />
241
The Review of Financial Studies / v 20 n 2 2007<br />
242<br />
Table 1<br />
Characteristics of <strong>the</strong> BBB sample<br />
90-bond sample 30-bond sample<br />
Nondisseminated<br />
control portfolio<br />
(n = 1704)<br />
Disseminated bonds<br />
(n =30)<br />
Nondisseminated<br />
control portfolio<br />
(n = 2997)<br />
Matching<br />
nondisseminated<br />
bonds (n = 90)<br />
Disseminated bonds<br />
(n = 90)<br />
All BBB (n = 4888)<br />
Number of<br />
bonds %<br />
Number of<br />
bonds %<br />
Number of<br />
bonds %<br />
Number of<br />
bonds %<br />
Number of<br />
bonds %<br />
Bond characteristics Number of bonds %<br />
Callable 806 16.5 0 0.0 6 6.7 593 19.8 0 0.0 272 16.0<br />
Issued after July 8, 2002 464 9.5 2 2.2 2 2.2 321 10.7 4 13.3 122 7.2<br />
Changed rating 687 14.1 2 2.2 3 3.3 470 15.7 0 0.0 195 11.4<br />
Industry sector<br />
Consumer goods 107 2.2 0 0.0 0 0.0 66 2.2 1 3.3 33 1.9<br />
Electric 564 11.5 12 13.3 12 13.3 344 11.5 1 3.3 177 10.4<br />
Energy 331 6.8 13 14.4 13 14.4 207 6.9 4 13.3 96 5.6<br />
Manufacturing 806 16.5 23 25.6 23 25.6 484 16.2 10 33.3 281 16.5<br />
O<strong>the</strong>r financial 2,182 44.6 14 15.6 14 15.6 1,310 43.7 11 36.7 869 51.0<br />
Services 560 11.5 24 26.7 24 26.7 379 12.6 2 6.7 138 8.1<br />
Telecom 108 2.2 2 2.2 2 2.2 76 2.5 0 0.0 19 1.1<br />
Transportation 163 3.3 2 2.2 2 2.2 95 3.2 1 3.3 72 4.3<br />
Gas distribution 67 1.4 0 0.0 0 0.0 36 1.2 0 0.0 19 1.1<br />
The table reports bond characteristics <strong>and</strong> industry sector for <strong>the</strong> sample of 4888 nonconvertible BBB bonds that have an original issue size between $10 million <strong>and</strong> $1 billion<br />
<strong>and</strong> at least one trade between July 8, 2002 <strong>and</strong> January 31, 2003 (<strong>the</strong> ‘‘selection period’’). Information is reported for all BBB bonds in <strong>the</strong> sample, <strong>the</strong> 90 bonds disseminated as<br />
of April 13, 2003, <strong>the</strong> 90 matching nondisseminated bonds, <strong>the</strong> control portfolio of 2997 nondisseminated bonds whose trading frequency (average daily trade count) falls within<br />
<strong>the</strong> minimum <strong>and</strong> maximum of <strong>the</strong> 90 disseminated bonds during <strong>the</strong> selection period, <strong>the</strong> 30 thinly traded bonds also disseminated as of April 13, 2003, <strong>and</strong> <strong>the</strong> control portfolio<br />
of 1704 thinly traded nondisseminated bonds whose trading frequency falls in <strong>the</strong> range for <strong>the</strong> 30 thinly traded disseminated bonds. Changed rating indicates bonds whose credit<br />
rating moves outside <strong>the</strong> BBB+/BBB/BBB– range before February 27, 2004.
Credit Ratings as Coordination Mechanisms<br />
Table 2<br />
BBB bond characteristics <strong>and</strong> trading activity<br />
90-bond sample 30-bond sample<br />
Nondisseminated control<br />
portfolio (n = 1704)<br />
Disseminated<br />
bonds (n = 30)<br />
Nondisseminated control<br />
portfolio (n = 2997)<br />
Matching nondisseminated<br />
bonds (n = 90)<br />
Disseminated<br />
bonds(n = 90)<br />
All BBB bonds
The Review of Financial Studies / v 20 n 2 2007<br />
<strong>the</strong> 90 disseminated bonds <strong>and</strong> <strong>the</strong>ir 90 nondisseminated matchers.<br />
Because we do not match on <strong>the</strong>se characteristics for <strong>the</strong> two large<br />
portfolios of nondisseminated bonds, bonds in <strong>the</strong>se control portfolios<br />
tend to have a smaller original issue size <strong>and</strong> somewhat fewer years<br />
remaining to maturity.<br />
It is evident from Table 2 that <strong>the</strong> bonds in general are thinly traded.<br />
On <strong>the</strong> basis of <strong>the</strong> 4888 BBB bonds that have any trades during <strong>the</strong><br />
selection period, <strong>the</strong> average BBB bond trades only 1.4 times per day, <strong>and</strong><br />
on average no trades occur at all on almost three quarters of <strong>the</strong> sample<br />
period days for <strong>the</strong>se bonds. The table also summarizes that trading tends<br />
to occur in temporal clusters, as <strong>the</strong> mean of <strong>the</strong> average time between<br />
trades is about 15 days, while <strong>the</strong> median is half that (7.3 days). This may<br />
be due to dealers’ desire to maintain low inventory positions in bonds that<br />
are thinly traded, causing <strong>the</strong>m to quickly sell a bond <strong>the</strong>y have recently<br />
bought from a customer. 9<br />
The trading activity statistics for <strong>the</strong> 90 disseminated bonds <strong>and</strong> <strong>the</strong><br />
matching nondisseminated bonds also show a close match. The median<br />
average daily volume is 1499 for <strong>the</strong> 90 disseminated bonds <strong>and</strong> 1427 for<br />
<strong>the</strong> nondisseminated matching bonds. Matching even closer are <strong>the</strong> median<br />
average daily trade count (1.0 for both <strong>the</strong> 90 disseminated bonds <strong>and</strong><br />
<strong>the</strong> 90 matching bonds), <strong>the</strong> percent of days traded (39.5% for <strong>the</strong> disseminated<br />
<strong>and</strong> 39.9% for <strong>the</strong> matching bonds), <strong>and</strong> <strong>the</strong> average days<br />
between trades (3.6 for both groups). Both groups are noticeably more<br />
active than <strong>the</strong> bonds in <strong>the</strong> nondisseminated control portfolio. 10 Turning<br />
to <strong>the</strong> 30 thinly traded bonds, <strong>the</strong> dollar volume of trade for bonds in <strong>the</strong>ir<br />
nondisseminated control portfolio is lower than for <strong>the</strong> 30 disseminated<br />
bonds, but <strong>the</strong> trading activity is o<strong>the</strong>rwise similar.<br />
2. Effect of Increased <strong>Transparency</strong> on Trade Frequency <strong>and</strong> Trading Volume<br />
In this section, we measure <strong>the</strong> impact of transparency by analyzing <strong>the</strong><br />
change in <strong>the</strong> level of trading activity before <strong>and</strong> after <strong>the</strong> bonds become<br />
transparent in April 2003. As discussed above, it is not clear whe<strong>the</strong>r <strong>the</strong><br />
introduction of transparency will be associated with an increase or with a<br />
decline in this measure of liquidity. We consider two measures of trading<br />
activity: average daily trading volume <strong>and</strong> average number of trades per<br />
day. To allow time to adjust to <strong>the</strong> new reporting regime, we exclude <strong>the</strong><br />
two-week period surrounding <strong>the</strong> start of dissemination of data. All<br />
9<br />
This possibility is fur<strong>the</strong>r explored in Section 3.3.<br />
10<br />
The distribution of trading frequency across all 4888 BBB bonds is highly skewed toward less actively<br />
traded bonds. Our 90-bond sample, however, selects bonds more uniformly from <strong>the</strong> distribution so that<br />
we can observe <strong>the</strong> impact of transparency across <strong>the</strong> full range of trading frequency. As <strong>the</strong> control<br />
portfolio reflects <strong>the</strong> actual distribution of trading activity, it contains relatively more bonds that are less<br />
active than those in <strong>the</strong> disseminated bond sample.<br />
244
Credit Ratings as Coordination Mechanisms<br />
results in this <strong>and</strong> <strong>the</strong> following sections are similar when we restrict our<br />
analysis to <strong>the</strong> six-month window surrounding <strong>the</strong> April 14, 2003 start of<br />
dissemination.<br />
Table 3 reports <strong>the</strong> changes in average daily trading volume (panel A)<br />
<strong>and</strong> average number of trades per day (panel B). Panel A shows that<br />
trading volume falls for both <strong>the</strong> disseminated <strong>and</strong> <strong>the</strong> nondisseminated<br />
bonds from <strong>the</strong> opaque to <strong>the</strong> transparent period. The volume drop of<br />
roughly 30–40% is both statistically <strong>and</strong> economically important. To<br />
test whe<strong>the</strong>r this drop is related to <strong>the</strong> change in transparency, we adjust<br />
<strong>the</strong> changes for <strong>the</strong> disseminated bond groups by <strong>the</strong> change in trading<br />
activity for <strong>the</strong> corresponding nondisseminated controls. The t-statistics<br />
show that almost none of <strong>the</strong>se ‘‘difference of differences’’ are significant.<br />
Only <strong>the</strong> drop in <strong>the</strong> average daily trading volume for <strong>the</strong> 90<br />
disseminated bonds relative to <strong>the</strong> nondisseminated control portfolio<br />
is statistically significant, indicating that volume decreases relative to<br />
this control group. 11 Similar outcomes are shown in panel B for <strong>the</strong><br />
trade count measure; <strong>the</strong> declines observed for <strong>the</strong> 30 bond sample are<br />
somewhat smaller, but <strong>the</strong> difference of differences are still generally<br />
insignificant. 12<br />
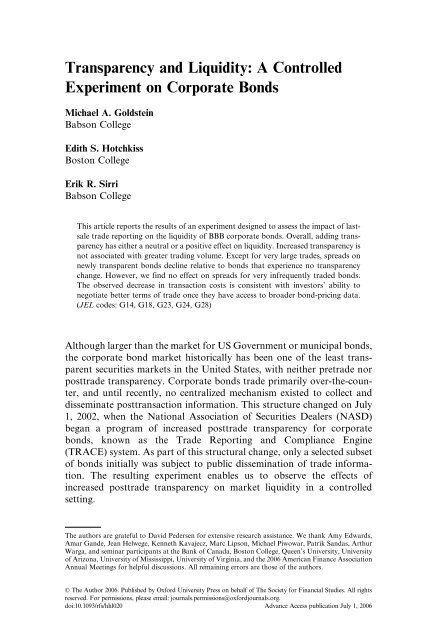
A downward trend in volume over this time period is also apparent<br />
from Figure 1, which plots by month <strong>the</strong> sample average of average daily<br />
trading volume for each bond group. For comparison, we also plot <strong>the</strong><br />
average daily trading volume for BBB bonds with issue size greater than<br />
$1 billion; <strong>the</strong>se bonds are o<strong>the</strong>rwise excluded from our analysis because<br />
<strong>the</strong>y are transparent throughout this time period, yet <strong>the</strong>y also show<br />
declining volume. This evidence suggests that <strong>the</strong> declines in trading<br />
volume reported in Table 3 reflect an overall market trend <strong>and</strong> are not<br />
directly related to a change in transparency.<br />
Although we cannot attribute changes in aggregate bond volume to<br />
increased transparency, it is possible that investors, ra<strong>the</strong>r than dealers,<br />
are drawn to bonds with higher transparency. Table 4 considers this<br />
possibility by repeating <strong>the</strong> analysis but excluding all inter-dealer trades.<br />
The table is analogous to Table 3 <strong>and</strong> most results are similar. Both<br />
panels indicate that <strong>the</strong>re is no change in trading activity at conventional<br />
levels of significance that is related to <strong>the</strong> increase in transparency. We<br />
also examine (not reported) <strong>the</strong> change in volume of large trades <strong>and</strong> of<br />
11<br />
This univariate result, however, is not supported by <strong>the</strong> multivariate regressions summarized in Table 5.<br />
12<br />
We also find results consistent with those reported when we examine <strong>the</strong> change in volume <strong>and</strong> trade<br />
count of individual disseminated bonds. Trading volume increases for 30 of <strong>the</strong> 90 disseminated bonds,<br />
whereas trade count increases for 27 bonds. Similarly, when compared with <strong>the</strong>ir individual matchers, 52<br />
disseminated bonds have a relative increase in trading volume <strong>and</strong> 40 bonds have a relative increase in<br />
trade count.<br />
245
The Review of Financial Studies / v 20 n 2 2007<br />
246<br />
Table 3<br />
Impact of transparency on trading volume <strong>and</strong> trade frequency<br />
Panel A: Average daily trading volume (bonds per day)<br />
Opaque period Transparent period Difference t-Statistic Difference of differences t-Statistic<br />
90-bond sample<br />
Disseminated bonds 3,379 2,359 1,020 8.07<br />
Matching nondisseminated bonds 2,695 1,767 928 9.93 92 0.83<br />
Nondisseminated control portfolio 1,126 681 445 41.09 574 2.42<br />
30-bond sample<br />
Disseminated bonds 582 373 209 3.94<br />
Nondisseminated control portfolio 257 159 98 16.75 111 0.24<br />
Panel B: Average number of trades per day<br />
Opaque period Transparent period Difference Difference of differences t-Statistic<br />
90-bond sample<br />
Disseminated bonds 3.14 2.34 0.80<br />
Matching nondisseminated bonds 2.27 1.68 0.59 0.21 0.18<br />
Nondisseminated control portfolio 1.86 1.49 0.37 0.43 0.93<br />
30-bond sample<br />
Disseminated bonds 0.29 0.27 0.02<br />
Nondisseminated control portfolio 0.29 0.29 0.00 0.02 0.38<br />
The table reports trade volume <strong>and</strong> trade frequency during different transparency regimes. The opaque period runs from July 8, 2002 through April 4, 2003. The transparent<br />
period runs from April 21, 2003 through February 27, 2004. The first column reports <strong>the</strong> trading activity in <strong>the</strong> opaque period when no BBB bonds under $1 billion have<br />
disseminated prices; <strong>the</strong> second column reports trading activity for <strong>the</strong> transparent period. The ‘‘difference of <strong>the</strong> differences’’ is <strong>the</strong> difference in <strong>the</strong> change between periods of<br />
<strong>the</strong> disseminated group versus <strong>the</strong> matching or control portfolio group. The t-Statistic for <strong>the</strong> difference of differences normalizes volume by <strong>the</strong> opaque period level.
Credit Ratings as Coordination Mechanisms<br />
1Billion<br />
90 Dissemminated<br />
90 Matching<br />
90 Control portfolio<br />
1.2000<br />
30 Dissemminated<br />
30 Control portfolio<br />
1.0000<br />
0.8000<br />
0.6000<br />
0.4000<br />
Average daily volume<br />
0.2000<br />
0.0000<br />
2/04<br />
1/04<br />
12/03<br />
11/03<br />
10/03<br />
9/03<br />
8/03<br />
7/03<br />
6/03<br />
5/03<br />
4/03<br />
3/03<br />
2/03<br />
1/03<br />
12/02<br />
11/02<br />
10/02<br />
9/02<br />
8/02<br />
7/02<br />
month<br />
Figure 1<br />
Average daily volume (July 2002 = 1)<br />
The graph shows by month <strong>the</strong> sample average of average daily trading volume for bonds whose face value is over $1 billion, <strong>the</strong> 90 disseminated bonds, <strong>the</strong> 90 matching<br />
nondisseminated control bonds, <strong>the</strong> nondisseminated control portfolio for <strong>the</strong> 90 bonds, <strong>the</strong> 30 thinly traded disseminated bonds, <strong>and</strong> <strong>the</strong> nondisseminated control portfolio for<br />
<strong>the</strong> 30 bonds. Values are normalized to July 2002. Average daily trading volume in July 2002 for each group was 21,411 for bonds over $1 billion, 4409 for <strong>the</strong> 90 disseminated<br />
bonds, 4484 for <strong>the</strong> 90 matching bonds, 1634 for <strong>the</strong> nondisseminated control portfolio for <strong>the</strong> 90 bonds, 1093 for <strong>the</strong> 30 thinly traded disseminated bonds, <strong>and</strong> 550 for <strong>the</strong><br />
nondisseminated control portfolio for <strong>the</strong> 30 bonds.<br />
247
The Review of Financial Studies / v 20 n 2 2007<br />
248<br />
Table 4<br />
Impact of transparency on customer trading volume <strong>and</strong> trade frequency<br />
Panel A: Average daily trading volume (bonds per day)<br />
Opaque period Transparent period Difference t-Statistic Difference of differences t-Statistic<br />
90-bond sample<br />
Disseminated bonds 2,491 1,345 1,145 11.98<br />
Matching nondisseminated bonds 2,032 1,264 768 10.02 377 1.52<br />
Nondisseminated control portfolio 871 484 387 44.02 758 0.39<br />
30-bond sample<br />
Disseminated bonds 512 295 216 4.80<br />
Nondisseminated control portfolio 226 129 98 18.48 119 0.09<br />
Panel B: Average number of customer trades per day<br />
Opaque period Transparent period Difference Difference of differences t-Statistic<br />
90-bond sample<br />
Disseminated bonds 2.18 1.40 0.77<br />
Matching nondisseminated bonds 1.53 1.01 0.52 0.25 0.43<br />
Nondisseminated control portfolio 1.35 0.99 0.36 0.42 1.01<br />
30-bond sample<br />
Disseminated bonds 0.23 0.18 0.05<br />
Nondisseminated control portfolio 0.22 0.20 0.02 0.03 1.07<br />
The table reports trade volume <strong>and</strong> trade frequency during different transparency regimes for all customer trades. The opaque period runs from July 8, 2002, through April 4,<br />
2003. The transparent period runs from April 21, 2003, through February 27, 2004. The first column reports <strong>the</strong> trading activity in <strong>the</strong> opaque period when no BBB bonds under<br />
$1 billion have disseminated prices; <strong>the</strong> second column reports trading activity for <strong>the</strong> transparent period. The ‘‘difference of <strong>the</strong> differences’’ is <strong>the</strong> difference in <strong>the</strong> change<br />
between periods of <strong>the</strong> disseminated group versus <strong>the</strong> matching or control portfolio group. The t-Statistic for <strong>the</strong> difference of differences normalizes volume by <strong>the</strong> opaque<br />
period level.
Credit Ratings as Coordination Mechanisms<br />
small trades (less than 100 bonds); in fact, <strong>the</strong> distribution of trade sizes is<br />
quite similar across <strong>the</strong> two time periods. 13<br />
The above results indicate no measurable effect of increased transparency<br />
on <strong>the</strong>se two trading activity measures of bond liquidity. However, it<br />
is possible that changes in liquidity are related to o<strong>the</strong>r traits of <strong>the</strong> bond.<br />
Although our sample of 90 matching nondisseminated bonds controls for<br />
some of <strong>the</strong>se characteristics, <strong>the</strong> control portfolios are created based only<br />
on trading frequency <strong>and</strong> so do not. We <strong>the</strong>refore use a multivariate<br />
regression to test whe<strong>the</strong>r increased transparency is related to changes<br />
in bond trading activity, controlling for cross-sectional differences in<br />
bond characteristics. The results of <strong>the</strong> regression are summarized in<br />
Table 5. The independent variable in <strong>the</strong> regression is ei<strong>the</strong>r average<br />
daily trading volume or average number of trades per day.<br />
For <strong>the</strong> 90 disseminated bonds <strong>and</strong> <strong>the</strong>ir 90 matchers, bonds from<br />
larger bond issues have higher trading volume than bonds from smaller<br />
issues. Bond age is significantly negatively related to trading volume, as in<br />
<strong>the</strong> findings of Hotchkiss, Jostova, <strong>and</strong> Warga (2005). The coefficient on<br />
<strong>the</strong> postdissemination period indicator is negative <strong>and</strong> significant at <strong>the</strong><br />
5% level, consistent with our univariate result that volume dropped for<br />
<strong>the</strong> later period. However, <strong>the</strong> key variable of interest is <strong>the</strong> interaction<br />
variable for disseminated bonds in <strong>the</strong> postdissemination period. The<br />
coefficient on this interacted variable is statistically insignificant. Similarly,<br />
no effect is found for <strong>the</strong> change in average daily trade count.<br />
This result is born out for <strong>the</strong> o<strong>the</strong>r bond groups as well. In fact, across<br />
all six regressions in Table 5, <strong>the</strong> coefficient on <strong>the</strong> disseminated bond in<br />
<strong>the</strong> postdissemination period is significant only for <strong>the</strong> average daily<br />
volume regression for <strong>the</strong> 30 thinly traded bonds <strong>and</strong> <strong>the</strong>ir control sample,<br />
<strong>and</strong> <strong>the</strong>n only at <strong>the</strong> 10% level. Taken toge<strong>the</strong>r, this <strong>and</strong> <strong>the</strong> two<br />
preceding tables lead us to conclude that <strong>the</strong>re appears to be no significant<br />
change in volume for BBB bonds that can be attributed to an<br />
increase in last-sale transparency.<br />
The fact that we do not observe an increase in volume with <strong>the</strong> introduction<br />
of transparency is particularly interesting because we simultaneously<br />
observe a decrease in spreads for this market, as we show in<br />
Section 3 below. Models such as Harris’s (1994) imply that volume will<br />
increase if spreads decrease. Finding that <strong>the</strong>re is no significant change in<br />
volume despite a decrease in spreads is consistent, however, with many<br />
empirical studies of more direct spread reductions in equity markets<br />
(which also found no volume effects). For example, Ahn, Cao, <strong>and</strong><br />
Choe (1996) examine <strong>the</strong> ASE’s 1992 tick size reduction on low priced<br />
13 For example, for both <strong>the</strong> 90 disseminated bonds <strong>and</strong> 90 matchers, approximately 55% of trade count in<br />
both periods is because of trades of 50 bonds or less (retail-sized trades); <strong>the</strong>se smaller trades however<br />
account for about 1% of <strong>the</strong> face amount of bonds traded.<br />
249
The Review of Financial Studies / v 20 n 2 2007<br />
250<br />
Table 5<br />
Regressions of trading volume <strong>and</strong> trading frequency<br />
30 thinly traded disseminated bonds <strong>and</strong><br />
nondisseminated control portfolio<br />
90 disseminated bonds <strong>and</strong> nondisseminated control<br />
portfolio<br />
90 disseminated bonds <strong>and</strong> matchers<br />
Variable Average daily volume Average daily trade count Average daily volume Average daily trade count Average daily volume Average daily trade count<br />
Intercept 30,193.956 1<br />
(6.24) 36.975 1<br />
(6.56) 6510.341 1<br />
(24.92) 5.596 1<br />
(15.83) 998.452 1<br />
(26.70) 0.166 1<br />
(4.88)<br />
Log (issue amount) 2,662.263 1<br />
(7.20) 3.085 1<br />
(7.17) 728.533 1<br />
(31.68) 0.650 1<br />
(20.87) 124.324 1<br />
(34.23) 0.014 1<br />
(4.24)<br />
Bond age 0.657 1<br />
(3.57) 0.000 (0.87) 0.304 1<br />
(13.09) 0.000 (0.63) 0.037 1<br />
(8.85) 0.000 1<br />
(6.50)<br />
Time to maturity 0.067 (1.12) 0.000 (0.30) 0.004 (0.41) 0.000 (0.26) 0.007 1<br />
(4.48) 0.000 1<br />
(2.90)<br />
Disseminated bond 531.998 (1.02) 0.747 (1.23) 1067.192 1<br />
(3.92) 0.385 (1.05) 118.748 3<br />
(1.93) 0.025 (0.45)<br />
Postdissemination 1,053.699<br />
period<br />
2<br />
(2.01) 0.690 (1.13) 604.211 1<br />
(9.01) 0.237 1<br />
(2.61) 91.012 1<br />
(7.89) 0.012 (1.19)<br />
Disseminated bond · 61.871 (0.08) 0.260 (0.30) 387.617 (1.01) 0.193 (0.37) 149.650<br />
postdissemination<br />
period<br />
3<br />
(1.73) 0.044 (0.56)<br />
Adjusted R 2 (%) 22.9 13.7 18.6 7.8 31.6 1.8<br />
n 359 359 5884 5884 3369 3369<br />
The table reports regressions of trade volume <strong>and</strong> trade frequency for <strong>the</strong> period July 8, 2002 through February 27, 2004. Bond age <strong>and</strong> years to maturity are measured as of<br />
April 14, 2003. Disseminated bond equals 1 if <strong>the</strong> bond was disseminated as of April 14, 2003 <strong>and</strong> 0 o<strong>the</strong>rwise. Postdissemination period equals 1 for observations after April 14,<br />
2003 <strong>and</strong> 0 o<strong>the</strong>rwise. t-Statistics are in paren<strong>the</strong>ses.<br />
1<br />
Significance at <strong>the</strong> 1% level.<br />
2<br />
Significance at <strong>the</strong> 5% level.<br />
3<br />
Significance at <strong>the</strong> 10% level.
Credit Ratings as Coordination Mechanisms<br />
stocks; although <strong>the</strong>y find that spreads fell significantly, <strong>the</strong>y find no effect<br />
on <strong>the</strong> number of trades or volume. Similar results are found by (i) Bacidore<br />
(1997) for <strong>the</strong> reduction in tick sizes on <strong>the</strong> Toronto Stock Exchange (TSE);<br />
(ii) Ahn, Cao, <strong>and</strong> Choe (1998) in <strong>the</strong>ir study of decimalization on <strong>the</strong> TSE;<br />
(iii) Ronen <strong>and</strong> Weaver (2001), who examine <strong>the</strong> ASE tick size reductions;<br />
<strong>and</strong> (iv) Chakravarty, Wood, <strong>and</strong> Van Ness (2004) in <strong>the</strong>ir examination of<br />
<strong>the</strong> NYSE’s reduction of its minimum price increment. Consistent with our<br />
results, <strong>the</strong>se articles demonstrate across a number of markets that a<br />
reduction in spreads is not associated with a change in trading activity.<br />
3. Effect of Increased <strong>Transparency</strong> on Trading Costs<br />
Although transaction costs can have multiple components, perhaps <strong>the</strong><br />
most important for our purposes is <strong>the</strong> effective spread of <strong>the</strong> bond. This<br />
is <strong>the</strong> difference between what a customer pays when <strong>the</strong>y buy a bond <strong>and</strong><br />
what <strong>the</strong>y receive if <strong>the</strong>y sell <strong>the</strong> bond. The price difference is related to<br />
<strong>the</strong> dealer markup or profit on <strong>the</strong> trades. We prefer <strong>the</strong> term ‘‘spread’’ as<br />
markups can take on certain regulatory implications.<br />
Section 3.1 reports estimates of spreads directly based on DRT trades.<br />
Section 3.2 reports regression-based spread estimates using benchmark<br />
prices obtained from a third party data source (Reuters). Section 3.3 fur<strong>the</strong>r<br />
examines <strong>the</strong> relation between spreads, trading activity, <strong>and</strong> transparency.<br />
3.1 Estimation of spreads from DRT trades<br />
We take as a measure of transaction costs <strong>the</strong> difference between what a<br />
customer pays <strong>and</strong> receives for a fixed quantity of a bond. We estimate<br />
this measure by identifying instances where an individual dealer acquires<br />
a bond from a customer <strong>and</strong> <strong>the</strong>n that same dealer subsequently sells <strong>the</strong><br />
same bond to a different customer. By restricting <strong>the</strong> time between <strong>the</strong>se<br />
two trades to be sufficiently short (e.g., one day or five days), factors such<br />
as interest rates <strong>and</strong> credit quality are unlikely to change; <strong>the</strong> difference in<br />
<strong>the</strong>se two prices is <strong>the</strong>n <strong>the</strong> effective spread of <strong>the</strong> bond. 14 Leng<strong>the</strong>ning<br />
<strong>the</strong> round-trip window permits exogenous factors to affect dealer spreads<br />
but allows more trade observations to enter our sample.<br />
Table 6 reports <strong>the</strong> distribution of <strong>the</strong>se spreads for all principal trades<br />
that qualify as part of a DRT for <strong>the</strong> 4888 bonds in our sample. The table<br />
reports results by ending trade size bins <strong>and</strong> for each bin gives <strong>the</strong> mean<br />
spread <strong>and</strong> various percentile points of <strong>the</strong> spread distribution. Panel A<br />
places no time restriction on <strong>the</strong> DRT. Noticeably, spreads are larger for<br />
smaller trades. For trades of 10 bonds or less (of which <strong>the</strong>re are 192,277<br />
14 We have also estimated results from more complex transactions such as customer-dealer-dealer-customer<br />
chains of trades. Although not presented for <strong>the</strong> sake of brevity, <strong>the</strong> results throughout this article are<br />
substantively similar. Results are also similar when we include observations of a dealer sale preceding a<br />
dealer buy.<br />
251
The Review of Financial Studies / v 20 n 2 2007<br />
Table 6<br />
Dealer round-trip (DRT) spread estimates<br />
252<br />
Number of<br />
observations<br />
Median<br />
sell ratio<br />
Mean<br />
sell ratio<br />
Mean days<br />
between trades<br />
99 th<br />
percentile<br />
75 th<br />
percentile<br />
25 th<br />
percentile<br />
1 st<br />
percentile<br />
Trade size<br />
(number of bonds) Mean Median SD % obs > 1SD<br />
Panel A: No time limit for round trip (n = 424,772)<br />
£10 2.37 2.14 4.17 2.4 2.06 1.10 3.30 8.65 5.4 0.44 0.31 192,277<br />
11–20 2.33 2.13 2.18 8.7 1.68 1.13 3.25 8.24 5.4 0.48 0.40 62,962<br />
21–50 1.96 1.70 2.28 9.1 2.46 0.72 2.95 8.43 6.1 0.50 0.45 60,258<br />
51–100 1.19 0.75 2.49 8.5 5.35 0.13 2.00 8.63 8.9 0.53 0.50 17,088<br />
101–250 0.87 0.47 2.52 7.5 5.50 0.05 1.41 9.04 11.4 0.51 0.40 15,641<br />
251–1000 0.73 0.43 2.78 6.6 6.50 0.01 1.25 9.50 10.6 0.58 0.50 31,687<br />
>1000 0.56 0.37 2.26 5.9 5.50 0.01 1.00 7.23 6.9 0.77 1.00 44,859<br />
Panel B: Round trip within five days (n = 328,060)<br />
£10 2.32 2.13 2.61 1.2 0.50 1.14 3.25 6.96 1.2 0.46 0.33 153,627<br />
11–20 2.28 2.13 1.82 6.9 0.40 1.16 3.19 6.56 1.2 0.51 0.44 50,674<br />
21–50 1.88 1.67 1.77 7.0 0.78 0.75 2.84 6.40 1.1 0.54 0.50 47,590<br />
51–100 1.11 0.69 1.57 5.5 1.18 0.13 1.75 6.00 0.9 0.61 0.77 12,230<br />
101–250 0.72 0.35 1.28 3.5 1.50 0.06 1.00 5.13 0.9 0.62 0.89 9,948<br />
251–1000 0.61 0.36 1.66 2.6 3.00 0.05 1.00 5.00 0.9 0.66 1.00 20,222<br />
>1000 0.52 0.34 1.37 2.8 2.25 0.04 0.76 4.19 0.6 0.81 1.00 33,769<br />
Panel C: Round trip within one day (n = 158,043)<br />
£10 2.35 2.25 1.99 0.8 0.00 1.25 3.25 6.26 0.0 0.51 0.40 64,684<br />
11–20 2.17 2.00 1.95 5.2 0.18 1.00 3.00 6.00 0.0 0.57 0.60 21,310<br />
21–50 1.66 1.50 1.73 4.8 0.42 0.45 2.65 5.75 0.0 0.62 0.71 21,961<br />
51–100 0.85 0.38 1.34 3.3 0.74 0.06 1.30 4.88 0.0 0.73 1.00 6,950<br />
101–250 0.57 0.24 1.01 1.9 0.58 0.05 0.82 4.00 0.0 0.75 1.00 6,004<br />
251–1000 0.52 0.25 1.37 1.3 1.00 0.05 0.75 4.00 0.0 0.77 1.00 12,466<br />
>1000 0.50 0.31 1.00 1.6 0.75 0.05 0.75 3.26 0.0 0.86 1.00 24,668<br />
The table reports estimates of <strong>the</strong> effective bid-ask spread based on transactions from July 8, 2002 through February 27, 2004 for <strong>the</strong> full set of 4888 BBB-rated corporate bonds,<br />
excluding convertibles <strong>and</strong> bonds issued by banks. Estimates are formed by identifying dealer round trips for a given bond as chain of a customer sale to a dealer followed by a<br />
sale of that bond by <strong>the</strong> same dealer to a customer. Days between trades are <strong>the</strong> number of days between trades in <strong>the</strong> dealer round trip. Sell ratio is <strong>the</strong> number of bonds<br />
purchased by <strong>the</strong> customer (ending a DRT) divided by <strong>the</strong> number of bonds sold by <strong>the</strong> customer (starting a DRT). For panel B, <strong>the</strong> entire chain is completed in no more than<br />
five days; for panel C, <strong>the</strong> entire chain is completed in one day. Spreads are calculated as <strong>the</strong> difference between <strong>the</strong> customer buy price at <strong>the</strong> end of <strong>the</strong> chain <strong>and</strong> <strong>the</strong> customer<br />
sell price at <strong>the</strong> beginning of <strong>the</strong> chain. The number of observations is <strong>the</strong> number of DRTs in each trade size bin.
Credit Ratings as Coordination Mechanisms<br />
round-trips), <strong>the</strong> mean cost is $2.37 per $100 bond face amount. This<br />
number reflects a high cost of trading relative to what has been documented<br />
in o<strong>the</strong>r markets. Given that <strong>the</strong>se small trades involve retail<br />
investors, adverse selection should not be an issue. 15 One important<br />
factor explaining <strong>the</strong>se high spreads may be that fixed costs charged to<br />
retail customers by <strong>the</strong>ir brokers are in turn reflected in spreads, as<br />
commissions are not customarily charged on <strong>the</strong>se trades. Still, <strong>the</strong> st<strong>and</strong>ard<br />
deviation of spreads is very high, <strong>and</strong> 25% of <strong>the</strong> round-trip trades in<br />
this size group have spreads more than $3.30.<br />
We also report <strong>the</strong> mean number of days between trades in <strong>the</strong> DRT.<br />
With no time restriction on <strong>the</strong> sample, <strong>the</strong> mean number of days between<br />
trades is 5.4 days for smaller trades <strong>and</strong> is greatest (11.4 days) for trades<br />
between 100 <strong>and</strong> 250 bonds. Overall, 77% of round-trips are completed<br />
within five days (panel B) <strong>and</strong> 37% are completed within one day (panel C).<br />
As <strong>the</strong> longer time period allows for significantly more observations, we<br />
focus on <strong>the</strong> five-day round-trips throughout <strong>the</strong> remainder of this article.<br />
However, we have estimated our subsequent tests subject to <strong>the</strong> requirement<br />
that <strong>the</strong> trades must take place on <strong>the</strong> same day <strong>and</strong> find substantively<br />
similar results. 16<br />
While <strong>the</strong> magnitude of spreads is similar as we restrict <strong>the</strong> round trip<br />
to shorter time intervals, <strong>the</strong> magnitude of extreme observations is<br />
reduced. We also report <strong>the</strong> mean <strong>and</strong> median ‘‘sell ratio,’’ defined as<br />
<strong>the</strong> ratio of <strong>the</strong> number of bonds purchased by a customer (ending a<br />
DRT) to <strong>the</strong> number of bonds sold by a customer to a dealer (starting a<br />
DRT). The results reported below are qualitatively unchanged when we<br />
restrict our sample to observations where <strong>the</strong> size of <strong>the</strong> customer purchase<br />
is at least 90% of <strong>the</strong> size of <strong>the</strong> initial customer sale (sell ratio is at<br />
least 0.90).<br />
Table 6 summarizes that spreads fall markedly as trade size increases.<br />
Panel B indicates that for institutional trades of over 1000 bonds, or $1<br />
million face value, <strong>the</strong> median cost is only $0.34 per $100 of face value.<br />
This is an 84% drop from <strong>the</strong> median cost for a trade of 10 or fewer bonds<br />
of $2.13 per $100. While this is consistent with high fixed costs of trade<br />
that are reflected in spreads for small transactions, it could also reflect an<br />
uniformed retail investor base that cannot effectively monitor dealer rent<br />
15<br />
On <strong>the</strong> basis of <strong>the</strong> discussions with market participants, it is widely held that trades of fewer than 100<br />
bonds are for retail accounts. This is fur<strong>the</strong>r supported by analysis done by a large clearing firm, showing<br />
that trades of 50 or fewer bonds almost entirely involve retail investors. For our purposes, we assume that<br />
trades between 50 <strong>and</strong> 100 bonds are largely retail but may include some institutional trades.<br />
16<br />
We perform two checks to verify that our results are not driven by a sample selection effect because of <strong>the</strong><br />
requirement that <strong>the</strong> DRT is completed within five days. First, we allow <strong>the</strong> round-trip time period to<br />
range from one day up to five days. The results do not qualitatively change as this time window changes.<br />
Second, we re-run <strong>the</strong> results of Table 6 including only <strong>the</strong> 48 most liquid bonds in <strong>the</strong> sample, which<br />
trade on 99% of <strong>the</strong> sample days. These bonds trade sufficiently often that <strong>the</strong> round-trip timing<br />
requirement will not cause a selection effect, <strong>and</strong> again, <strong>the</strong> results are not meaningfully different from<br />
Table 6.<br />
253
The Review of Financial Studies / v 20 n 2 2007<br />
seeking, as in <strong>the</strong> findings of Green, Hollifield, <strong>and</strong> Schurhoff (2004). 17<br />
Also consistent with <strong>the</strong> findings of Green et al. is our finding that<br />
although dealers on average charge lower spreads for larger trades, <strong>the</strong>y<br />
are also more apt to lose money on <strong>the</strong>se trades. For example, for trades<br />
from 250 to 1000 bonds, a dealer charges on average 61 basis points for<br />
<strong>the</strong> trade but loses 300 basis points or more 1% of <strong>the</strong> time. Losses for<br />
smaller trades, when <strong>the</strong>y occur, are much smaller.<br />
The magnitude of <strong>the</strong> measured spreads, in particular for smaller<br />
trades, may not be as surprising when one simply looks at plots<br />
of transaction prices for a given bond. An example of such a plot for<br />
a short time interval is given for one of <strong>the</strong> 90 disseminated bonds in<br />
Figure 2. This bond is in <strong>the</strong> bottom quartile of <strong>the</strong> 90-bond sample based<br />
on average daily trading volume. The observed price differences on trades<br />
occurring on <strong>the</strong> same or close days are strikingly large, even when we<br />
consider that <strong>the</strong> plot does not control for trade size. These plots also<br />
raise two important issues related to outliers in <strong>the</strong> data. First, when<br />
trades can sometimes occur at seemingly large spreads, it becomes difficult<br />
to infer whe<strong>the</strong>r a trade is a data error or a costly trade. Second,<br />
although our test statistics should not be driven by outliers, underst<strong>and</strong>ing<br />
<strong>the</strong> presence <strong>and</strong> behavior of <strong>the</strong> outliers <strong>the</strong>mselves is an important<br />
part of underst<strong>and</strong>ing overall behavior in this market.<br />
The magnitude of our estimates can be compared with those of o<strong>the</strong>r<br />
studies. Edwards et al. (2005), using a different sample of TRACE data,<br />
generally report lower trading costs for very small <strong>and</strong> for very large<br />
trades (estimates for intermediate sized trades are closer). For example,<br />
<strong>the</strong>ir estimate of costs on small trades in BBB bonds is roughly 25% lower<br />
than ours (approximately $1.50 versus our estimate of over $2.32 for<br />
trades of 10 bonds or less). This is true even for <strong>the</strong> one-day DRTs, for<br />
which <strong>the</strong>re is little risk that an event such as a significant interest rate<br />
movements could affect our estimates. One potential source of <strong>the</strong>se<br />
differences is that Edwards et al. use a two-stage econometric model, in<br />
which a cost function is specified <strong>and</strong> fitted in <strong>the</strong> first stage. 18 Ano<strong>the</strong>r<br />
possible explanation is that differences in spread estimates are due to<br />
sample differences. Trades that are part of a DRT are likely to reflect<br />
more actively traded bonds; we show below in Sections 3.2 <strong>and</strong> 3.3 that<br />
spreads are in fact higher for more actively traded bonds. We address <strong>the</strong><br />
effect of <strong>the</strong>se selection issues on <strong>the</strong> magnitude of spread estimates in<br />
Section 3.2. Still, for <strong>the</strong> subset of trades that are part of a DRT, <strong>and</strong> in<br />
particular for DRTs within a short time period, our estimates represent<br />
17<br />
This is also consistent with <strong>the</strong> model of Bernhardt et al. (2005), which shows that transaction costs <strong>and</strong><br />
trade sizes are negatively correlated in a dealer market. They provide supporting evidence from <strong>the</strong> LSE.<br />
18<br />
Edwards et al. show that <strong>the</strong> form of <strong>the</strong> cost function can have a significant effect on spread estimates at<br />
<strong>the</strong> lower end <strong>and</strong> upper end of trade sizes.<br />
254
Credit Ratings as Coordination Mechanisms<br />
Price<br />
$130<br />
$125<br />
$120<br />
$115<br />
$110<br />
$105<br />
Customer Sells<br />
Customer Buys<br />
$100<br />
Dealer-Dealer<br />
Reuters Price<br />
$95<br />
$90<br />
1/1/2003 1/6/2003 1/12/2003 1/18/2003 1/24/2003 1/30/2003 2/4/2003 2/10/2003 2/16/2003 2/22/2003 2/28/2003<br />
Figure 2<br />
Transaction history for a sample bond<br />
255
The Review of Financial Studies / v 20 n 2 2007<br />
direct observations of <strong>the</strong> round-trip spread. Bessembinder, Maxwell, <strong>and</strong><br />
Venkataraman’s (2005) post-TRACE cost estimate for large trades<br />
(approximately 28 basis points) is closer to ours but includes bonds<br />
from o<strong>the</strong>r rating categories.<br />
We next apply our method of measuring trading costs to <strong>the</strong> question<br />
of whe<strong>the</strong>r liquidity changes when transparency increases. In Table 7, we<br />
report spreads separately for DRTs that occur in <strong>the</strong> predissemination<br />
<strong>and</strong> postdissemination periods. To reduce <strong>the</strong> influence of outliers, we<br />
winsorize our observations for each trade size bin at <strong>the</strong> 1% level. Extreme<br />
observations of spreads are more likely to reflect instances where o<strong>the</strong>r<br />
factors, such as a firm-specific event, cause a significant change in <strong>the</strong><br />
bond’s value. We report results only for <strong>the</strong> 90 disseminated bonds <strong>and</strong><br />
<strong>the</strong>ir control groups; <strong>the</strong> additional 30 disseminated bonds contribute<br />
relatively few DRT observations because of <strong>the</strong>ir lower trading frequency.<br />
For <strong>the</strong> 90 disseminated bonds, <strong>the</strong>re is a significant decrease in <strong>the</strong><br />
mean <strong>and</strong> median spread across all trade size groups. For <strong>the</strong> 90 nondisseminated<br />
matchers, we also observe a decline in <strong>the</strong> mean <strong>and</strong> median<br />
spread, although <strong>the</strong> significance of <strong>the</strong>se declines is weaker for intermediate<br />
sized trades. Finally, for <strong>the</strong> nondisseminated control portfolio,<br />
<strong>the</strong>re is actually an increase in spreads at smaller trade sizes but significant<br />
decreases for larger trades. For smaller trades, <strong>the</strong> mean <strong>and</strong> median<br />
spreads for disseminated bonds are somewhat larger than for nondisseminated<br />
bonds, even in <strong>the</strong> predissemination period.<br />
As in Tables 3 <strong>and</strong> 4 above, we use a ‘‘difference of differences’’ method<br />
to measure <strong>the</strong> relative change in spreads from <strong>the</strong> predissemination<br />
period to <strong>the</strong> postdissemination period, controlling for changes in <strong>the</strong><br />
trading environment. For example, for <strong>the</strong> 51–100 trade size bin, <strong>the</strong><br />
mean spread for disseminated bonds decreases by $0.81 (from $1.47 to<br />
$0.66) per $100 of face value, whereas <strong>the</strong> mean for <strong>the</strong> matching nondisseminated<br />
bonds decreases only $0.26 (from $0.73 to $0.46). The<br />
difference of <strong>the</strong>se differences, 55 basis points, is significant at <strong>the</strong> 1%<br />
level. Similarly, <strong>the</strong> mean spread for nondisseminated control portfolio<br />
falls only $0.11 (from $1.08 to $0.98). Relative to <strong>the</strong> control portfolio,<br />
<strong>the</strong> disseminated bonds have a decrease in spread of 72 basis points,<br />
which is significant at <strong>the</strong> 1% level.<br />
The largest relative decline in spreads occurs for intermediate trade<br />
sizes. Although we observe a significant increase in spreads relative to <strong>the</strong><br />
90 matching bonds for <strong>the</strong> smallest trade size group (10 bonds or less),<br />
this result is not robust to <strong>the</strong> choice of control group; we observe a<br />
significant decline of $0.28 relative to <strong>the</strong> nondisseminated control portfolio.<br />
For all o<strong>the</strong>r trade size groups, <strong>the</strong> results based on <strong>the</strong> nondisseminated<br />
control portfolio are consistent with those based on <strong>the</strong> matching<br />
bonds. As noted by Biais <strong>and</strong> Green (2005), it is difficult to postulate a<br />
<strong>the</strong>ory of why, when transparency increases, retail investors would face<br />
256
Credit Ratings as Coordination Mechanisms<br />
Table 7<br />
Predissemination <strong>and</strong> postdissemination dealer round-trip (DRT) spread estimates for 90-bond sample<br />
Difference of<br />
differences<br />
Postdissemination period<br />
(4/21/03–2/27/04)<br />
Predissemination period<br />
(7/8/02–4/4/03)<br />
Difference of<br />
medians Means Medians<br />
Difference of<br />
means<br />
Trade size<br />
(number bonds) Bond classification Mean Median n Mean Median n<br />
0.59<br />
0.30<br />
0.43 1<br />
0.28 1<br />
0.19 1<br />
0.78 1<br />
0.11 1<br />
£10 Disseminated 3.00 3.00 2,032 2.74 2.81 913 0.26 1<br />
£10 Nondisseminated matching 2.58 2.50 1,043 1.89 1.72 482 0.69 1<br />
£10 Nondisseminated control portfolio 2.30 2.05 63,753 2.31 2.16 56,652 0.02 1<br />
0.06 0.26<br />
0.67 1<br />
0.75<br />
0.63 1<br />
0.89 1<br />
0.13 1<br />
11–20 Disseminated 2.93 3.00 721 2.34 2.37 372 0.59 1<br />
11–20 Nondisseminated matching 2.31 2.25 342 1.78 1.36 154 0.53 1<br />
11–20 Nondisseminated control portfolio 2.21 2.00 19,945 2.29 2.13 18,781 0.08 1<br />
0.66<br />
1.12<br />
0.35 2<br />
0.70 1<br />
0.97 1<br />
0.31 2<br />
0.15 1<br />
21–50 Disseminated 2.49 2.63 760 1.88 1.65 357 0.60 1<br />
21–50 Nondisseminated matching 1.55 1.13 395 1.29 0.82 188 0.25 2<br />
21–50 Nondisseminated control portfolio 1.77 1.50 19,164 1.87 1.65 17,061 0.10 1<br />
1.00 1<br />
0.87<br />
0.88<br />
0.13 0.55 1<br />
0.72 1<br />
0.11 1<br />
51–100 Disseminated 1.47 1.25 250 0.66 0.25 129 0.81 1<br />
51–100 Nondisseminated matching 0.73 0.25 173 0.46 0.13 109 0.26 2<br />
51–100 Nondisseminated control portfolio 1.08 0.64 5,115 0.98 0.53 4,353 0.09 1<br />
0.02<br />
0.04<br />
0.38 2<br />
0.40 1<br />
0.17 3<br />
0.15 2<br />
0.14 1<br />
101–250 Disseminated 0.94 0.38 226 0.35 0.20 173 0.59 1<br />
101–250 Nondisseminated matching 0.53 0.25 156 0.32 0.10 143 0.21 2<br />
101–250 Nondisseminated control portfolio 0.77 0.39 4,198 0.58 0.25 3,496 0.19 1<br />
0.04 0.09<br />
0.14 0.08<br />
0.23 1<br />
0.14 1<br />
0.15 1<br />
251–1000 Disseminated 0.67 0.38 418 0.37 0.16 227 0.30 1<br />
251–1000 Nondisseminated matching 0.56 0.27 354 0.30 0.13 236 0.26 1<br />
251–1000 Nondisseminated control portfolio 0.67 0.40 9,208 0.50 0.25 6,828 0.16 1<br />
0.05 0.06<br />
0.02 0.03<br />
0.10 1<br />
0.16 1<br />
0.13 1<br />
>1000 Disseminated 0.45 0.28 837 0.27 0.18 449 0.18 1<br />
>1000 Nondisseminated matching 0.50 0.38 775 0.37 0.21 420 0.12 1<br />
>1000 Nondisseminated control portfolio 0.58 0.38 15,901 0.42 0.25 10,927 0.15 1<br />
The table reports estimates of <strong>the</strong> effective bid-ask spread for <strong>the</strong> 90 disseminated bonds, matching nondisseminated bonds, <strong>and</strong> <strong>the</strong> nondisseminated control portfolio. Estimates<br />
are formed by identifying dealer round-trip trades in each trade size bin, as in Table 6. For each trade size bin, <strong>the</strong> table reports <strong>the</strong> difference of means <strong>and</strong> of medians of <strong>the</strong><br />
effective spreads between <strong>the</strong> two time periods. The ‘‘difference of <strong>the</strong> differences’’ compares <strong>the</strong> spread changes of <strong>the</strong> disseminated verses <strong>the</strong> control group.<br />
1<br />
Significance at <strong>the</strong> 1% level.<br />
2<br />
Significance at <strong>the</strong> 5% level.<br />
3<br />
Significance at <strong>the</strong> 10% level.<br />
257
The Review of Financial Studies / v 20 n 2 2007<br />
larger trading costs in small information-less trades, especially given that<br />
larger trades appear to benefit from <strong>the</strong> transparency.<br />
Although <strong>the</strong>se univariate results are informative, it is possible that <strong>the</strong><br />
effects of increased transparency depend on o<strong>the</strong>r traits of <strong>the</strong> bond. To<br />
control for cross-sectional differences in bond characteristics, we again<br />
use a multivariate regression to estimate whe<strong>the</strong>r increased transparency<br />
is associated with changes in spreads, controlling for bond characteristics.<br />
The results of <strong>the</strong>se regressions are summarized in Table 8. The dependent<br />
variable in <strong>the</strong> regression is <strong>the</strong> five-day DRT spread estimate. Table 8a<br />
reports results for <strong>the</strong> 90 disseminated bonds <strong>and</strong> <strong>the</strong>ir 90 nondisseminated<br />
matchers, whereas Table 8b reports results for <strong>the</strong> 90 disseminated<br />
bonds <strong>and</strong> <strong>the</strong> nondisseminated control portfolio.<br />
The results in <strong>the</strong>se tables are generally consistent with our univariate<br />
analysis. From Table 8 (a <strong>and</strong> b), separate from <strong>the</strong> effects of transparency,<br />
<strong>the</strong> 90 bonds chosen for dissemination have higher spreads than <strong>the</strong><br />
nondisseminated controls, especially for smaller trades (<strong>the</strong> coefficient for<br />
<strong>the</strong> ‘‘disseminated bond’’ dummy is positive <strong>and</strong> significant). For all<br />
bonds, spreads fell from <strong>the</strong> predissemination period to <strong>the</strong> postdissemination<br />
period (<strong>the</strong> coefficient for <strong>the</strong> ‘‘postdissemination period’’ dummy<br />
is negative <strong>and</strong> significant). To underst<strong>and</strong> <strong>the</strong> impact of transparency on<br />
spreads, however, <strong>the</strong> key coefficient is that of <strong>the</strong> interacted variable,<br />
‘‘disseminated bond in postdissemination period.’’ Table 8a indicates a<br />
statistically significant relative decrease in spreads when bonds become<br />
disseminated for trade sizes from 21 bonds to 250 bonds; <strong>the</strong> smallest<br />
trade size bin (up to 10 bonds) shows a rise in spread consistent with our<br />
univariate results. Table 8b summarizes a statistically significant decline<br />
relative to <strong>the</strong> nondisseminated control portfolio for all but <strong>the</strong> largest<br />
trade size groups (251 bonds or more). The impact of transparency<br />
appears greatest for intermediate sized trades, with a decline of –0.542<br />
relative to <strong>the</strong> nondisseminated matching bonds <strong>and</strong> –0.666 relative to <strong>the</strong><br />
nondisseminated control portfolio.<br />
The regression results control for <strong>the</strong> DRT holding period, defined as<br />
<strong>the</strong> time (in days) between <strong>the</strong> dealer’s purchase from a customer <strong>and</strong> sale<br />
to a customer. As this time increases, it is more likely that <strong>the</strong> spread<br />
estimate is influenced by o<strong>the</strong>r market events. The positive significant<br />
coefficient for this variable may also reflect compensation to dealers for<br />
<strong>the</strong> risk of holding <strong>the</strong> bond over a longer time period. Interpretation of<br />
<strong>the</strong> o<strong>the</strong>r control variables is most useful for Table 8b using <strong>the</strong> nondisseminated<br />
control portfolio, which does not already match bonds based<br />
on characteristics. We find that spreads are higher as <strong>the</strong> interest rate risk<br />
(measured by time to maturity) of <strong>the</strong> bond increases, as <strong>the</strong> bond ages,<br />
<strong>and</strong> as <strong>the</strong> issue size falls. We also control for whe<strong>the</strong>r a bond has a<br />
disseminated ‘‘sibling,’’ which occurs when <strong>the</strong>re is ano<strong>the</strong>r bond of <strong>the</strong><br />
same issuer with an issue size greater than $1 billion. Because bonds over<br />
258
Credit Ratings as Coordination Mechanisms<br />
Table 8a<br />
Dealer round-trip (DRT) spread estimate regressions for 90 disseminated bonds <strong>and</strong> nondisseminated matchers<br />
Trade size bin (number of bonds) 10 20 50 100 250 1000 >1000<br />
Intercept 0.983 1<br />
(0.138) 3.650 1<br />
(0.599) 3.882 1<br />
(0.487) 3.811 1<br />
(1.004) 0.391 (0.750) 0.261 (0.405) 1.197 1<br />
(0.184)<br />
Disseminated bond 0.932 1<br />
(0.068) 0.980 1<br />
(0.118) 1.239 1<br />
(0.113) 0.598 1<br />
(0.147) 0.495 1<br />
(0.118) 0.173 2<br />
(0.083) 0.122 2<br />
(0.048)<br />
Postdissemination period 0.618 1<br />
(0.083) 0.483 1<br />
(0.146) 0.247 3<br />
(0.134) 0.270 3<br />
(0.149) 0.221 3<br />
(0.115) 0.284 1<br />
(0.079) 0.145 1<br />
(0.045)<br />
Disseminated bond in postdissemination 0.332<br />
period<br />
1<br />
(0.103) 0.084 (0.174) 0.459 1<br />
(0.166) 0.542 1<br />
(0.199) 0.365 2<br />
(0.152) 0.042 (0.110) 0.089 (0.062)<br />
Holding period 1.537 1<br />
(0.179) 1.527 1<br />
(0.315) 2.848 1<br />
(0.309) 1.373 1<br />
(0.407) 0.920 1<br />
(0.305) 1.318 1<br />
(0.205) 0.069 (0.140)<br />
Ln(trade size) 0.206 1<br />
(0.037) 0.830 1<br />
(0.196) 0.888 1<br />
(0.129) 0.734 1<br />
(0.224) 0.046 (0.141) 0.010 (0.061) 0.093 1<br />
(0.021)<br />
Time to maturity (·1,000) 0.143 1<br />
(0.008) 0.104 1<br />
(0.013) 0.119 1<br />
(0.015) 0.034 3<br />
(0.019) 0.011 (0.016) 0.023 2<br />
(0.010) 0.024 1<br />
(0.005)<br />
Bond age (·1,000) 0.132 1<br />
(0.025) 0.120 1<br />
(0.044) 0.015 (0.045) 0.016 (0.059) 0.089 3<br />
(0.050) 0.091 2<br />
(0.036) 0.073 1<br />
(0.020)<br />
Issue amount (·1,000,000) 1.160 1<br />
(0.172) 1.064 1<br />
(0.281) 0.584 2<br />
(0.274) 0.354 (0.306) 0.203 (0.247) 0.045 (0.160) 0.049 (0.078)<br />
Disseminated sibling · 1,000 0.632 1<br />
(0.077) 0.443 1<br />
(0.135) 0.251 2<br />
(0.126) 0.383 2<br />
(0.154) 0.195 (0.120) 0.083 (0.082) 0.212 1<br />
(0.047)<br />
Average daily volume [prior 30 days<br />
0.005 (0.011) 0.018 (0.017) 0.033<br />
(·1,000)]<br />
2<br />
(0.015) 0.019 (0.015) 0.006 (0.012) 0.004 (0.008) 0.008 1<br />
(0.002)<br />
Adjusted R 2 (%) 15.5 13.5 18.3 13.8 8.4 5.9 5.7<br />
n 4,424 1,580 1,692 659 697 1,235 2,478<br />
The table reports regressions for dealer round-trip (DRT) spread estimates, for <strong>the</strong> 90 disseminated <strong>and</strong> 90 matching nondisseminated BBB bonds, from July 8, 2002 through<br />
February 27, 2004. The dependent variable is <strong>the</strong> estimate of transaction costs formed by identifying dealer round-trip trades over five days as in Table 6. Buy dummy is equal to<br />
1 if <strong>the</strong> order is a customer buy <strong>and</strong> 0 o<strong>the</strong>rwise. Disseminated bond equals 1 if <strong>the</strong> bond was disseminated after April 14, 2003 <strong>and</strong> 0 o<strong>the</strong>rwise. Postdissemination period equals 1<br />
for observations after April 14, 2003 <strong>and</strong> 0 o<strong>the</strong>rwise. Holding period is <strong>the</strong> time between <strong>the</strong> dealer’s buy from a customer <strong>and</strong> subsequent sale to a customer. Bond age <strong>and</strong> time<br />
to maturity are measured as of <strong>the</strong> transaction date. Average daily volume is <strong>the</strong> face amount traded for each bond for <strong>the</strong> 30 days before <strong>the</strong> transaction. Regressions are run for<br />
trades in bins of 0–10, 11–20, 21–50, 51–100, 101–250, 251–1,000, <strong>and</strong> more than 1,000 bonds, <strong>and</strong> bins are labeled by <strong>the</strong>ir upper limit size. St<strong>and</strong>ard errors are in paren<strong>the</strong>ses.<br />
1<br />
Significance at <strong>the</strong> 1% level.<br />
2<br />
Significance at <strong>the</strong> 5% level.<br />
3<br />
Significance at <strong>the</strong> 10% level.<br />
259
The Review of Financial Studies / v 20 n 2 2007<br />
260<br />
Table 8b<br />
Dealer round-trip (DRT) spread estimate regressions for 90 disseminated bonds <strong>and</strong> nondisseminated control portfolio<br />
Trade size bin (number of bonds) 10 20 50 100 250 1000 >1000<br />
Intercept 1.535 1<br />
(0.016) 2.714 1<br />
(0.101) 3.299 1<br />
(0.086) 2.475 1<br />
(0.261) 0.148 (0.218) 0.375 1<br />
(0.127) 1.205 1 (0.062)<br />
Disseminated bond 0.702 1<br />
(0.030) 0.728 1<br />
(0.049) 0.851 1<br />
(0.049) 0.511 1<br />
(0.080) 0.188 1<br />
(0.069) 0.089 (0.054) 0.046 (0.030)<br />
Postdissemination period 0.077 1<br />
(0.008) 0.055 1<br />
(0.013) 0.040 1<br />
(0.014) 0.135 1<br />
(0.026) 0.215 1<br />
(0.023) 0.184 1<br />
(0.017) 0.182 1 (0.011)<br />
Disseminated bond in postdissemination 0.191<br />
period<br />
1<br />
(0.054) 0.444 1<br />
(0.083) 0.666 1<br />
(0.085) 0.666 1<br />
(0.135) 0.381 1<br />
(0.104) 0.139 (0.089) 0.033 (0.050)<br />
Holding period 0.829 1<br />
(0.031) 1.366 1<br />
(0.053) 1.828 1<br />
(0.056) 2.076 1<br />
(0.103) 1.421 1<br />
(0.092) 0.864 1<br />
(0.067) 0.211 1 (0.048)<br />
Ln(trade size) 0.008 (0.005) 0.427 1<br />
(0.035) 0.624 1<br />
(0.024) 0.385 1<br />
(0.058) 0.099 2<br />
(0.042) 0.033 3<br />
(0.019) 0.082 1 (0.007)<br />
Time to maturity (·1,000) 0.231 1<br />
(0.001) 0.222 1<br />
(0.002) 0.196 1<br />
(0.002) 0.069 1<br />
(0.004) 0.048 1<br />
(0.004) 0.034 1<br />
(0.003) 0.033 1 (0.002)<br />
Bond age (·1,000) 0.068 1<br />
(0.003) 0.050 1<br />
(0.005) 0.054 1<br />
(0.005) 0.070 1<br />
(0.010) 0.043 1<br />
(0.010) 0.063 1<br />
(0.008) 0.049 1 (0.006)<br />
Issue amount (·1,000,000) 0.008 (0.024) 0.209 1<br />
(0.038) 0.229 1<br />
(0.037) 0.484 1<br />
(0.057) 0.557 1<br />
(0.052) 0.349 1<br />
(0.041) 0.234 1 (0.024)<br />
Disseminated sibling · 1,000 0.303 1<br />
(0.010) 0.285 1<br />
(0.016) 0.158 1<br />
(0.017) 0.032 (0.026) 0.061 1<br />
(0.023) 0.088 1<br />
(0.018) 0.079 1 (0.011)<br />
Average daily volume [prior 30 days<br />
0.035<br />
(·1,000)]<br />
1<br />
(0.002) 0.038 1<br />
(0.003) 0.008 1<br />
(0.003) 0.002 (0.003) 0.002 (0.002) 0.006 1<br />
(0.001) 0.000 (0.001)<br />
Adjusted R 2 (%) 24.8 24.3 21.1 9.3 7.5 3.6 4.5<br />
n 122,758 39,662 37,231 9,822 8,082 16,662 28,092<br />
The table reports regressions for dealer round-trip (DRT) spread estimates, for <strong>the</strong> 90 disseminated BBB bonds <strong>and</strong> nondisseminated control portfolio, from July 8, 2002<br />
through February 27, 2004. Variables are as defined in Table 8a. Regressions are run for trades in bins of 0–10, 11–20, 21–50, 51–100, 101–250, 251–1,000, <strong>and</strong> more than 1,000<br />
bonds, <strong>and</strong> bins are labeled by <strong>the</strong>ir upper limit size. St<strong>and</strong>ard errors are in paren<strong>the</strong>ses.<br />
1<br />
Significance at <strong>the</strong> 1% level.<br />
2<br />
Significance at <strong>the</strong> 5% level.<br />
3<br />
Significance at <strong>the</strong> 10% level.
Credit Ratings as Coordination Mechanisms<br />
$1 billion are also disseminated under TRACE during this time period,<br />
such a bond might benefit from <strong>the</strong> transparency of its larger disseminated<br />
sibling. Alternatively, this variable may proxy for larger firms with<br />
complex capital structures <strong>and</strong> thus more public information available<br />
<strong>and</strong> lower trading costs. This effect is most pronounced for smaller trades,<br />
where spreads are lower for bonds with disseminated siblings by 30 basis<br />
points. 19 Finally, from Table 8b, bonds that have been actively traded in<br />
<strong>the</strong> prior 30 basis points days are also associated with higher trading costs<br />
for smaller trades.<br />
3.2 Regression-based estimates of spreads<br />
A chief advantage to <strong>the</strong> estimation method used in <strong>the</strong> previous section is that<br />
it provides a very direct <strong>and</strong> easily interpretable measure of spreads, using no<br />
data external to TRACE <strong>and</strong> not dependent on assumptions embedded in <strong>the</strong><br />
modeling of spreads. Its chief drawback is that it only uses a portion of <strong>the</strong> data<br />
available, in that transactions must be part of a DRT as we have defined it. To<br />
address this concern, we examine regression-based spread estimates that<br />
utilize all of <strong>the</strong> trading data. 20 Using this methodology to get an unconditional<br />
estimate of spreads comparable withthoseinTable6,weestimate<br />
effective spreads for each trade size group by regressing <strong>the</strong> difference<br />
between <strong>the</strong> transaction price for a customer <strong>and</strong> an estimated bid price on<br />
a dummy variable that equals 1 for customer buys <strong>and</strong> 0 for customer sells:<br />
½customer trade price bid priceŠ i ¼ 0 þ 1D Buy<br />
i þ "i ð1Þ<br />
We also report a second regression for each trade size group:<br />
½customer trade price bid priceŠi¼0þ1D<br />
Buy<br />
i þ 2D DisseminatedBond<br />
i<br />
þ 3D PostdisseminatedPeriod<br />
i þ<br />
2 3<br />
X5<br />
6 . 7<br />
þ ½ 5… 10Š67<br />
4 . 5 þ "i<br />
DisseminatedBond PostdisseminatedPeriod<br />
4Di X10<br />
ð2Þ<br />
where in addition to <strong>the</strong> dummy indicating buy transactions, we include a<br />
dummy variable indicating disseminated bonds, a dummy variable<br />
19<br />
We also control for whe<strong>the</strong>r <strong>the</strong> bond is displayed on <strong>the</strong> NYSE’s ABS but do not report those results<br />
here, as trading on <strong>the</strong> ABS is relatively more important to <strong>the</strong> high-yield market. Our coefficient<br />
estimates <strong>and</strong> our conclusions as to <strong>the</strong> impact of transparency under TRACE are not affected by this<br />
additional control variable.<br />
20<br />
Bessembinder, Maxwell, <strong>and</strong> Venkataraman (2005) note that <strong>the</strong>ir methodology, <strong>the</strong> methodology of<br />
Schultz (2001), <strong>and</strong> that of Edwards, Harris, <strong>and</strong> Piwowar (2005) use broadly similar indicator variable<br />
regression approaches. The regression-based methodology in this article also falls into this category. A<br />
significant difference of <strong>the</strong> Bessembinder et al. methodology from ours is that <strong>the</strong>y utilize econometric<br />
methods to account for <strong>the</strong> fact that <strong>the</strong> NAIC data are not time stamped, which is not necessary for <strong>the</strong><br />
TRACE data.<br />
261
The Review of Financial Studies / v 20 n 2 2007<br />
indicating transactions in <strong>the</strong> postdissemination period, <strong>and</strong> <strong>the</strong> interaction<br />
of <strong>the</strong>se two dummies to indicate disseminated bonds in <strong>the</strong> postdisseminated<br />
period. This specification also controls for additional bond<br />
characteristics (X5 to X10) related to spreads. As noted by Schultz (2001),<br />
each additional variable is multiplied by +1 for buy <strong>and</strong> –1 for sale<br />
transactions. Results are similar when we do not assume that <strong>the</strong> spread<br />
is symmetric, that is, including separate buy <strong>and</strong> sell dummy variables.<br />
The difficulty in implementing this approach is that we must use<br />
estimated ra<strong>the</strong>r than actually observed dealer bid prices. For this<br />
study, we use dealer bid prices reported by Reuters for <strong>the</strong> end of day<br />
before <strong>the</strong> transaction. Reuters bases <strong>the</strong>se estimates on daily quotes<br />
obtained from individual dealers <strong>and</strong> largely does not use matrix prices. 21<br />
As <strong>the</strong> bid prices are updated daily by Reuters’ analysts to reflect changes<br />
in treasury prices, equity prices, <strong>and</strong> o<strong>the</strong>r firm specific information, we<br />
do not need additional controls for changes in interest rates <strong>and</strong> related<br />
factors in our regressions. 22<br />
To eliminate obvious data errors, we exclude observations from our<br />
regressions if <strong>the</strong> difference between <strong>the</strong> trade price <strong>and</strong> <strong>the</strong> Reuters bid<br />
price (our dependent variable) is greater than 20. We also winsorize<br />
regressions at 1% within each trade size bin to reduce <strong>the</strong> influence of<br />
outliers. Fur<strong>the</strong>rmore, transactions are excluded if <strong>the</strong> end-of-day Reuters<br />
bid price for <strong>the</strong> transaction date has changed more than $0.50 from <strong>the</strong><br />
previous day’s closing bid as reported by Reuters, because in <strong>the</strong>se cases<br />
<strong>the</strong> previous day’s ending bid price is less likely to be a useful estimate of<br />
<strong>the</strong> bid quote at <strong>the</strong> time of <strong>the</strong> transaction. Results (not reported) are<br />
also virtually identical when we include only observations where <strong>the</strong>re is<br />
no change in <strong>the</strong> Reuters bid price between <strong>the</strong> day before <strong>and</strong> <strong>the</strong> day of<br />
<strong>the</strong> transaction.<br />
Table 9 reports <strong>the</strong> regression-based spread estimates for all principal<br />
customer trades in <strong>the</strong> 90 bonds <strong>and</strong> <strong>the</strong>ir nondisseminated control portfolio.<br />
Inferences concerning <strong>the</strong> impact of transparency are unchanged<br />
when we examine estimates (not reported for brevity) based on <strong>the</strong> 90<br />
disseminated bonds versus <strong>the</strong> 90 matching control bonds. We report<br />
results based on comparison with <strong>the</strong> control portfolio because it is useful<br />
21<br />
Although <strong>the</strong>re are many outst<strong>and</strong>ing investment grade corporate bond issues, <strong>the</strong>re are only approximately<br />
500 distinct issuers. On <strong>the</strong> basis of our conversations, Reuters estimates that <strong>the</strong>ir analysts obtain<br />
direct quotes from dealers for about 85% of <strong>the</strong>se issuers. Warga <strong>and</strong> Welch (1993) stress <strong>the</strong> importance<br />
of using dealer bid prices ra<strong>the</strong>r than data incorporating matrix prices. For this reason, much prior<br />
academic research uses <strong>the</strong> Lehman Bro<strong>the</strong>rs Fixed Income Database, which contains monthly quotes by<br />
Lehman Bro<strong>the</strong>rs for corporate bonds included in Lehman Indices. Reuters obtains quotes from Lehman<br />
<strong>and</strong> o<strong>the</strong>r dealers on a daily basis.<br />
22<br />
For example, Schultz (2001) constructs estimated bid prices by interpolating between monthly dealer<br />
quotes, accounting for changes in treasury prices within <strong>the</strong> month. Bessembinder, Maxwell, <strong>and</strong><br />
Venkataraman (2005) include <strong>the</strong> return on a maturity-matched treasury bond <strong>and</strong> <strong>the</strong> return on <strong>the</strong><br />
firm’s equity to control for <strong>the</strong>se movements. These approaches are equivalent to using a matrix price for<br />
<strong>the</strong> benchmark bid price.<br />
262
Credit Ratings as Coordination Mechanisms<br />
Table 9<br />
Regression-based spread estimates for 90 disseminated bonds <strong>and</strong> non-disseminated control portfolio<br />
Trade size bin<br />
(number of bonds) All All 10 10 20 20 50 50 100 100 250 250 1000 1000 >1000 >1000<br />
0.222 2<br />
(0.104)<br />
0.767 1<br />
(0.206)<br />
0.000<br />
(0.042)<br />
0.090 1<br />
(0.019)<br />
0.014<br />
(0.062)<br />
0.024 2<br />
(0.012)<br />
0.025 1<br />
(0.003)<br />
0.022 2<br />
(0.010)<br />
0.000 2<br />
(0.000)<br />
0.003 1<br />
(0.001)<br />
0.005 3<br />
(0.003)<br />
0.430 1<br />
(0.012)<br />
0.366 1<br />
(0.017)<br />
0.703 1<br />
(0.118)<br />
2.356 1<br />
(0.236)<br />
0.198 1<br />
(0.040)<br />
0.068 1<br />
(0.016)<br />
0.174 1<br />
(0.059)<br />
0.129 1<br />
(0.018)<br />
0.013 1<br />
(0.003)<br />
0.008<br />
(0.008)<br />
0.000 1<br />
(0.000)<br />
0.002<br />
(0.001)<br />
0.004<br />
(0.003)<br />
0.187 1<br />
(0.011)<br />
0.562 1<br />
(0.016)<br />
1.164 1<br />
(0.209)<br />
3.169 1<br />
(0.417)<br />
0.237 1<br />
(0.055)<br />
0.104 1<br />
(0.022)<br />
0.219 1<br />
(0.077)<br />
0.222 1<br />
(0.040)<br />
0.032 1<br />
(0.003)<br />
0.039 1<br />
(0.010)<br />
0.000 1<br />
(0.000)<br />
0.001<br />
(0.002)<br />
0.023 1<br />
(0.004)<br />
0.095 1<br />
(0.015)<br />
0.976 1<br />
(0.021)<br />
1.885 1<br />
(0.257)<br />
4.925 1<br />
(0.513)<br />
0.328 1<br />
(0.064)<br />
0.065 2<br />
(0.026)<br />
0.373 1<br />
(0.091)<br />
0.380 1<br />
(0.057)<br />
0.056 1<br />
(0.004)<br />
0.030 1<br />
(0.011)<br />
0.000 1<br />
(0.000)<br />
0.014 1<br />
(0.003)<br />
0.053 1<br />
(0.005)<br />
0.406 1<br />
(0.018)<br />
1.884 1<br />
(0.025)<br />
1.768 1<br />
(0.099)<br />
4.767 1<br />
(0.196)<br />
0.592 1<br />
(0.040)<br />
0.023<br />
(0.017)<br />
0.474 1<br />
(0.059)<br />
0.340 1<br />
(0.027)<br />
0.105 1<br />
(0.002)<br />
0.033 1<br />
(0.007)<br />
0.000 1<br />
(0.000)<br />
0.021 1<br />
(0.002)<br />
0.102 1<br />
(0.004)<br />
0.969 1<br />
(0.012)<br />
3.065 1<br />
(0.016)<br />
1.026 1<br />
(0.149)<br />
3.110 1<br />
(0.296)<br />
0.541 1<br />
(0.048)<br />
0.047 2<br />
(0.020)<br />
0.418 1<br />
(0.072)<br />
0.126 2<br />
(0.052)<br />
0.111 1<br />
(0.003)<br />
0.021 2<br />
(0.008)<br />
0.000 1<br />
(0.000)<br />
0.017 1<br />
(0.002)<br />
0.123 1<br />
(0.005)<br />
1.313 1<br />
(0.016)<br />
3.528 1<br />
(0.020)<br />
0.538 1<br />
(0.034)<br />
1.565 1<br />
(0.064)<br />
0.601 1<br />
(0.036)<br />
0.183 1<br />
(0.015)<br />
0.603 1<br />
(0.055)<br />
0.211 1<br />
(0.012)<br />
0.131 1<br />
(0.002)<br />
0.017 1<br />
(0.006)<br />
0.000 1<br />
(0.000)<br />
0.031 1<br />
(0.002)<br />
0.128 1<br />
(0.003)<br />
1.676 1<br />
(0.012)<br />
3.692 1<br />
(0.015)<br />
Intercept 0.755 1<br />
1.418<br />
(0.006)<br />
1<br />
(0.014)<br />
Buy dummy 2.486 1<br />
3.789<br />
(0.007)<br />
1<br />
(0.027)<br />
Disseminated bond 0.476 1<br />
(0.018)<br />
Postdissemination period 0.077 1<br />
(0.007)<br />
Disseminated bond in<br />
0.424<br />
postdissemination period<br />
1<br />
(0.026)<br />
Ln(trade size) 0.269 1<br />
(0.002)<br />
Time to maturity (·1,000) 0.094 1<br />
(0.001)<br />
Bond age (·1,000) 0.009 1<br />
(0.003)<br />
Issue amount (·1,000,000) 0.000 1<br />
(0.000)<br />
Average daily volume<br />
0.011<br />
[prior 30 days (·1,000)]<br />
1<br />
(0.001)<br />
Days since last trade 0.059 1<br />
(0.001)<br />
Adjusted R 2 (%) 17.7 23.6 27.3 30.4 28.2 30.5 25.7 28.1 14.5 15.7 6.6 7.4 2.7 3.0 0.6 0.8<br />
n 535,514 535,514 163,926 163,926 81,133 81,133 104,020 104,020 34,522 34,522 29,403 29,403 47,149 47,149 75,361 75,361<br />
The table reports regressions of transaction costs using <strong>the</strong> 90 disseminated bonds <strong>and</strong> <strong>the</strong> nondisseminated portfolio for <strong>the</strong> 90 bonds from July 8, 2002 through February 27,<br />
2004. The dependent variable is <strong>the</strong> estimate of transaction costs formed by taking <strong>the</strong> difference in price between a customer transaction price <strong>and</strong> <strong>the</strong> prevailing market quote at<br />
<strong>the</strong> end of <strong>the</strong> day as reported by Reuters. Buy dummy is equal to 1 if <strong>the</strong> order is a customer buy <strong>and</strong> 0 o<strong>the</strong>rwise. Disseminated bond equals 1 if <strong>the</strong> bond was disseminated after<br />
April 14, 2003 <strong>and</strong> 0 o<strong>the</strong>rwise. Postdissemination period equals 1 for observations after April 14, 2003 <strong>and</strong> 0 o<strong>the</strong>rwise. Disseminated bond in postdissemination period equals 1<br />
for disseminated bonds after April 14, 2003 <strong>and</strong> 0 o<strong>the</strong>rwise. Bond age <strong>and</strong> time to maturity are measured as of <strong>the</strong> transaction date. Average daily volume is <strong>the</strong> face amount<br />
traded for each bond over <strong>the</strong> 30 days before each transaction. Regressions are run for trades overall <strong>and</strong> in bins of 0–10, 11–20, 51–100, 101–250, 251–1,000, <strong>and</strong> more than<br />
1,000 bonds. Bids are labeled by <strong>the</strong>ir upper limit size. St<strong>and</strong>ard errors are in paren<strong>the</strong>ses.<br />
1<br />
Significance at <strong>the</strong> 1% level.<br />
2<br />
Significance at <strong>the</strong> 5% level.<br />
3<br />
Significance at <strong>the</strong> 10% level.<br />
263
The Review of Financial Studies / v 20 n 2 2007<br />
to examine <strong>the</strong> coefficients of <strong>the</strong> additional control variables when <strong>the</strong><br />
control bonds are not already matched on those characteristics.<br />
The intercept in <strong>the</strong>se regressions, a 0, is <strong>the</strong> mean difference between <strong>the</strong><br />
customer sale price <strong>and</strong> <strong>the</strong> estimated bid quote. For <strong>the</strong> full sample under<br />
<strong>the</strong> heading ‘‘All,’’ <strong>the</strong> intercept is negative <strong>and</strong> significant, but <strong>the</strong> regressions<br />
for trade size groups show that this is largely due to <strong>the</strong> trades of 250<br />
bonds or fewer. This indicates that for smaller trades, <strong>the</strong> Reuters bid<br />
price is greater than actual customer sale prices. The Reuters prices are<br />
largely supplied to <strong>the</strong> institutional market. Because our estimates also<br />
reflect bid prices for smaller retail trades, it is likely that prices obtained<br />
by customers on <strong>the</strong>se small customer sales are lower.<br />
The first regression for each trade size group shows <strong>the</strong> unconditional<br />
estimated round-trip trading costs (a1, <strong>the</strong> coefficient on <strong>the</strong> ‘‘buy<br />
dummy’’ variable) estimated from Equation (1). We estimate <strong>the</strong>se costs<br />
to be $2.49 per $100 face value overall but find <strong>the</strong> same inverse relationship<br />
with trade size as documented in <strong>the</strong> previous section. Trades of 10<br />
bonds or less have a spread of $3.70, whereas spreads for trades of 1000<br />
bonds or more have a spread of $0.37. Interestingly, <strong>the</strong> regressionadjusted<br />
R 2 s decline substantially for larger trades but do not appear to<br />
be related to <strong>the</strong> number of observations which remains quite large. Our<br />
regression-based spread estimates are somewhat higher than those<br />
reported using our DRT method. This may be largely because <strong>the</strong> latter<br />
includes only transactions that are part of a DRT. 23 Fur<strong>the</strong>rmore, over a<br />
short enough time interval, <strong>the</strong> DRTs include a large proportion of<br />
essentially riskless trades, consistent with <strong>the</strong> lowered estimated spreads.<br />
The second regression for each trade size group considers <strong>the</strong> effect of<br />
dissemination while controlling for o<strong>the</strong>r bond characteristics impacting<br />
on spreads. We find that <strong>the</strong> coefficient on ‘‘disseminated bond in postdissemination<br />
period’’ is negative <strong>and</strong> significant at <strong>the</strong> 1% level for all<br />
trade size groups except for over 1000 bonds (where it is negative but<br />
insignificant) <strong>and</strong> indicates that spreads are lower when a bond’s price is<br />
publicly disseminated. The magnitude of this coefficient declines as trade<br />
size increases. For example, trades of 10 bonds or fewer show a decline of<br />
$0.60 per $100 face value for bonds that become transparent. 24 This falls<br />
to a $0.17 decline for spreads for trade sizes from 251 to 1000 bonds <strong>and</strong><br />
becomes insignificant for <strong>the</strong> largest trades. The regression-based results<br />
23<br />
Consistent with this explanation, in robustness, checks not shown here when we use our regression<br />
method to estimate spreads using only transactions that are part of a DRT, our regression estimates<br />
correspond more closely to those summarized in Table 6.<br />
24<br />
The significance of <strong>the</strong> coefficients for <strong>the</strong> impact of transparency is also insensitive to <strong>the</strong> percentage<br />
cutoff used to winsorize <strong>the</strong> dependent variable. However, <strong>the</strong> magnitude of <strong>the</strong> coefficients does depend<br />
on <strong>the</strong> method used to reduce <strong>the</strong> influence of outliers. For example, when we winsorize at 5%, <strong>the</strong> decline<br />
in spreads for <strong>the</strong> 10 bond or less trade size group is 0.50 (reduced from 0.603 as summarized in Table 9).<br />
Generally, removing more extreme observations reduces <strong>the</strong> magnitude of both <strong>the</strong> estimated spreads <strong>and</strong><br />
<strong>the</strong> dissemination effect but not <strong>the</strong>ir statistical significance.<br />
264
Credit Ratings as Coordination Mechanisms<br />
in Table 9, <strong>the</strong>refore, are consistent with <strong>the</strong> DRT-based results in Tables<br />
7 <strong>and</strong> 8 (a <strong>and</strong> b). Collectively, <strong>the</strong>se results on <strong>the</strong> 90 more actively traded<br />
disseminated bonds indicate that spreads fall with increased posttrade<br />
transparency.<br />
Table 10 reports a similar set of regressions for <strong>the</strong> additional 30<br />
disseminated thinly traded bonds <strong>and</strong> <strong>the</strong>ir nondisseminated control<br />
portfolio. Interestingly, for trade sizes up to 250 bonds, <strong>the</strong> spread estimates<br />
<strong>the</strong>mselves are somewhat lower for <strong>the</strong> thinly traded bonds than<br />
was estimated for <strong>the</strong> 90 disseminated bonds <strong>and</strong> control portfolio in<br />
Table 9; for trades sizes of 251 bonds or greater, <strong>the</strong> estimates are somewhat<br />
higher.<br />
A primary concern for <strong>the</strong> less active bonds is that increased transparency<br />
could harm dealers’ willingness to commit capital to trade a bond,<br />
for fear of having prices fall when <strong>the</strong> dealer attempts to reposition his<br />
inventory. In this scenario, dealers would dem<strong>and</strong> a larger initial price<br />
concession from investors, especially at larger sizes, resulting in a higher<br />
spread. The results in Table 10 show that this is not <strong>the</strong> case. The<br />
coefficient on ‘‘disseminated bond in postdissemination period’’ is insignificant<br />
for all trade sizes. The important result in this table is <strong>the</strong> lack of<br />
support for <strong>the</strong> hypo<strong>the</strong>sis that investors paid higher costs for thinly<br />
traded bonds because of <strong>the</strong> increased transparency regime.<br />
Overall, we find that <strong>the</strong> magnitude of <strong>the</strong> effect of transparency on<br />
spreads varies considerably with trade size <strong>and</strong> also depends on <strong>the</strong><br />
predissemination level of trading activity for <strong>the</strong> bond. We find that<br />
decreases in spreads range from 0 to 67 basis points. These results can<br />
be contrasted with <strong>the</strong> findings of Edwards et al. (2005), who find that<br />
transparency is associated with a drop in trading costs of about 10 basis<br />
points (round-trip) across <strong>the</strong> range of trade sizes, <strong>and</strong> Bessembinder,<br />
Maxwell, <strong>and</strong> Venkataraman (2005), who find a drop of 12–14 basis<br />
points for trades comparable with those in our largest trade size group. 25<br />
3.3 Relationship of spreads, trading activity, <strong>and</strong> transparency effects<br />
An interesting finding from our spread estimates is that for some trade<br />
size groups, spreads appear to increase with <strong>the</strong> level of trading activity.<br />
Comparing <strong>the</strong> coefficient for <strong>the</strong> buy dummy in Table 9 (<strong>the</strong> 90 more<br />
active bonds <strong>and</strong> controls) <strong>and</strong> Table 10 (<strong>the</strong> 30 thinly traded bonds <strong>and</strong><br />
controls), <strong>the</strong> regression-based estimates of spreads are higher for more<br />
actively traded bonds for trade sizes up to 250 bonds.<br />
To examine this result fur<strong>the</strong>r, we verify that a similar relationship<br />
exists between trade activity <strong>and</strong> <strong>the</strong> DRT spread estimates within <strong>the</strong> 90<br />
disseminated bond sample. As noted in footnote 10, we intentionally<br />
25 As noted above, differences from Edwards et al (2005) may be related ei<strong>the</strong>r to sample differences or to<br />
<strong>the</strong> smooth cost function that Edwards et al. fit to <strong>the</strong>ir data.<br />
265
The Review of Financial Studies / v 20 n 2 2007<br />
Table 10<br />
Regression-based spread estimates for 30 disseminated bonds <strong>and</strong> nondisseminated control portfolio<br />
266<br />
Trade size bin<br />
(number of bonds) All All 10 10 20 20 50 50 100 100 250 250 1000 1000 >1000 >1000<br />
0.587<br />
(0.399)<br />
0.902<br />
(0.791)<br />
0.110<br />
(0.207)<br />
0.082<br />
(0.071)<br />
0.085<br />
(0.319)<br />
0.029<br />
(0.047)<br />
0.019 2<br />
(0.008)<br />
0.014<br />
(0.034)<br />
0.000<br />
(0.000)<br />
0.003<br />
(0.005)<br />
0.734 1<br />
(0.049)<br />
0.550 1<br />
(0.068)<br />
0.212<br />
(0.527)<br />
0.575<br />
(1.055)<br />
0.218<br />
(0.211)<br />
0.062<br />
(0.073)<br />
0.365<br />
(0.331)<br />
0.011<br />
(0.081)<br />
0.004<br />
(0.008)<br />
0.004<br />
(0.035)<br />
0.000<br />
(0.000)<br />
0.001<br />
(0.007)<br />
0.124 2<br />
(0.050)<br />
0.774 1<br />
(0.070)<br />
1.120<br />
(1.020)<br />
2.237<br />
(2.039)<br />
0.034<br />
(0.432)<br />
0.127<br />
(0.107)<br />
0.023<br />
(0.576)<br />
0.159<br />
(0.194)<br />
0.019<br />
(0.012)<br />
0.026<br />
(0.043)<br />
0.001<br />
(0.000)<br />
0.008<br />
(0.011)<br />
0.481 1<br />
(0.074)<br />
0.951 1<br />
(0.104)<br />
1.436<br />
(1.331)<br />
2.616<br />
(2.662)<br />
0.510<br />
(0.514)<br />
0.031<br />
(0.131)<br />
0.687<br />
(0.681)<br />
0.234<br />
(0.298)<br />
0.052 1<br />
(0.014)<br />
0.157 1<br />
(0.056)<br />
0.000<br />
(0.001)<br />
0.020<br />
(0.016)<br />
0.989 1<br />
(0.090)<br />
1.680 1<br />
(0.126)<br />
1.490 1<br />
(0.548)<br />
2.229 2<br />
(1.084)<br />
0.110<br />
(0.458)<br />
0.379 1<br />
(0.092)<br />
0.003<br />
(0.570)<br />
0.057<br />
(0.153)<br />
0.067 1<br />
(0.012)<br />
0.029<br />
(0.032)<br />
0.001 2<br />
(0.000)<br />
0.008<br />
(0.015)<br />
1.796 1<br />
(0.069)<br />
2.662 1<br />
(0.091)<br />
2.160 2<br />
(0.840)<br />
3.106 3<br />
(1.672)<br />
0.002<br />
(0.564)<br />
0.612 1<br />
(0.106)<br />
1.012<br />
(0.775)<br />
0.277<br />
(0.294)<br />
0.047 1<br />
(0.014)<br />
0.060 3<br />
(0.031)<br />
0.001<br />
(0.000)<br />
0.044 2<br />
(0.021)<br />
2.167 1<br />
(0.085)<br />
2.857 1<br />
(0.107)<br />
1.255 1<br />
(0.145)<br />
0.557 2<br />
(0.261)<br />
0.916 1<br />
(0.327)<br />
0.369 1<br />
(0.071)<br />
0.662<br />
(0.449)<br />
0.342 1<br />
(0.057)<br />
0.074 1<br />
(0.009)<br />
0.044 2<br />
(0.017)<br />
0.001 1<br />
(0.000)<br />
0.033 2<br />
(0.013)<br />
2.442 1<br />
(0.060)<br />
2.670 1<br />
(0.074)<br />
0.007<br />
(0.005)<br />
0.002<br />
(0.005)<br />
0.000<br />
(0.008)<br />
0.012<br />
(0.010)<br />
0.023 1<br />
(0.008)<br />
0.035 1<br />
(0.009)<br />
0.026 1<br />
(0.006)<br />
Intercept 0.881 1<br />
1.128<br />
(0.026)<br />
1<br />
(0.058)<br />
Buy dummy 1.599 1<br />
2.129<br />
(0.034)<br />
1<br />
(0.102)<br />
Disseminated bond 0.105<br />
(0.129)<br />
Postdissemination period 0.261 1<br />
(0.034)<br />
Disseminated bond in<br />
0.066<br />
postdissemination period<br />
(0.184)<br />
Ln(trade size) 0.120 1<br />
(0.008)<br />
Time to maturity<br />
0.041<br />
(·1,000)<br />
1<br />
(0.004)<br />
Bond age<br />
0.033<br />
(·1,000)<br />
1<br />
(0.011)<br />
Issue amount<br />
0.001<br />
(·1,000,000)<br />
1<br />
(0.000)<br />
Average daily volume<br />
0.007<br />
[prior 30 days<br />
(·1,000)]<br />
2<br />
(0.004)<br />
Days since last trade 0.012 1<br />
(0.003)<br />
Adjusted R 2 (%) 5.3 6.6 11.6 13.1 13.5 14.7 12.5 13.3 6.8 7.7 3.1 3.1 2.3 2.2 0.7 0.7<br />
n 39,673 39,673 10,011 10,011 4,530 4,530 5,975 5,975 2,409 2,409 2,606 2,606 5,108 5,108 9,034 9,034<br />
The table reports regressions of transaction costs using <strong>the</strong> 30 disseminated bonds <strong>and</strong> <strong>the</strong> portfolio of 1704 thinly traded nondisseminated bonds whose traits match those of <strong>the</strong><br />
30 thinly traded disseminated bonds from July 8, 2002 through March 1, 2004. The dependent variable is <strong>the</strong> estimate of transaction costs formed by taking <strong>the</strong> difference in price<br />
between <strong>the</strong> customer transaction price <strong>and</strong> <strong>the</strong> prevailing market quote at <strong>the</strong> end of <strong>the</strong> day as reported by Reuters. Buy dummy is equal to 1 if <strong>the</strong> order is a customer buy <strong>and</strong><br />
0 o<strong>the</strong>rwise. Disseminated bond equals 1 if <strong>the</strong> bond was disseminated after April 14, 2003 <strong>and</strong> 0 o<strong>the</strong>rwise. Postdissemination period equals 1 for observations after April 14,<br />
2003 <strong>and</strong> 0 o<strong>the</strong>rwise. Disseminated bond in postdissemination period equals 1 for disseminated bonds after April 14, 2003 <strong>and</strong> 0 o<strong>the</strong>rwise. Bond age <strong>and</strong> time to maturity are<br />
measured as of <strong>the</strong> transaction date. Average daily volume is <strong>the</strong> face amount traded for each bond over <strong>the</strong> 30 days before each bond over <strong>the</strong> 30 days before each transaction.<br />
Regressions are run for trades overall <strong>and</strong> in bins of 0–10, 11–20, 21–50, 51–100, 101–250, 251–1,000, <strong>and</strong> more than 1,000 bonds. Bids are labeled by <strong>the</strong>ir upper limit size.<br />
St<strong>and</strong>ard errors are in paren<strong>the</strong>ses.<br />
1<br />
Significance at <strong>the</strong> 1% level.<br />
2<br />
Significance at <strong>the</strong> 5% level.<br />
3<br />
Significance at <strong>the</strong> 10% level.
Credit Ratings as Coordination Mechanisms<br />
chose our 90-bond sample uniformly across <strong>the</strong> trading frequency distribution,<br />
so that within this group <strong>the</strong>re are more <strong>and</strong> less actively traded<br />
bonds. We <strong>the</strong>refore divide <strong>the</strong> 90 disseminated bond sample (<strong>and</strong> <strong>the</strong>ir<br />
corresponding matching bonds) into thirds based on <strong>the</strong> disseminated<br />
bond’s average daily trade count in <strong>the</strong> pretransparency selection period<br />
<strong>and</strong> compare <strong>the</strong> most active 30 bonds with <strong>the</strong> remaining 60 bonds. We<br />
also construct control portfolios for <strong>the</strong>se subgroups such that <strong>the</strong> average<br />
daily trade count for bonds in <strong>the</strong> control portfolio falls within <strong>the</strong><br />
range observed for that subgroup. Table 11 reports spread estimates for<br />
all bonds in <strong>the</strong>se groups collectively (conclusions are <strong>the</strong> same looking at<br />
<strong>the</strong> 90 disseminated, matching, <strong>and</strong> control portfolio groups individually)<br />
<strong>and</strong> summarizes that bonds in <strong>the</strong> upper third of trading activity have<br />
higher mean <strong>and</strong> median estimated DRT spreads than less active bonds.<br />
These results indicate that spread size increases with trading activity not<br />
just for <strong>the</strong> thinly traded bonds but also within <strong>the</strong> more frequently traded<br />
bond groups.<br />
One possible explanation for this finding is that certain bonds become<br />
more active in response to some firm-specific information that might also<br />
be associated with higher spreads. Ano<strong>the</strong>r possibility is that dealers trade<br />
less active bonds differently than more active bonds. As dealers can more<br />
easily find willing counterparties in active bonds, <strong>the</strong>y may be more willing<br />
to take <strong>the</strong>se bonds into inventory in <strong>the</strong>ir dealer capacity. By definition,<br />
it is more difficult to find counterparties with which to trade in less<br />
active bonds, so that dealers may perform more of a matching or brokerage<br />
function in <strong>the</strong>se bonds. 26<br />
The evidence in Table 11 is consistent with <strong>the</strong> latter explanation. For<br />
all trade size groups of over 50 bonds, <strong>the</strong> time between <strong>the</strong> dealer<br />
purchase <strong>and</strong> dealer sale in <strong>the</strong> DRT (holding period) is lower for less<br />
active bonds. Fur<strong>the</strong>rmore, when <strong>the</strong>y do sell, <strong>the</strong>y tend to sell more of<br />
<strong>the</strong>ir position: <strong>the</strong> mean <strong>and</strong> median sell ratios (<strong>the</strong> ratio of <strong>the</strong> size of <strong>the</strong><br />
ending dealer sale to <strong>the</strong> starting dealer purchase in <strong>the</strong> DRT) are higher<br />
for less active bonds. In o<strong>the</strong>r words, when a less active bond is taken into<br />
inventory, <strong>the</strong> dealer more often quickly sells <strong>the</strong> entire position. 27 Thus,<br />
<strong>the</strong> lower spreads on less active bonds reflect a difference in dealer<br />
behavior. For less active issues, dealers may serve more of a search role,<br />
matching buyers <strong>and</strong> sellers, <strong>and</strong> not assuming <strong>the</strong> risk of holding bonds<br />
in <strong>the</strong>ir inventory. Dealers may also take less profit (providing better<br />
prices <strong>and</strong> hence smaller spreads) to find a willing counterparty more<br />
quickly.<br />
26<br />
Recall that even a relatively active bond, as we have defined it, can trade infrequently relative to most<br />
o<strong>the</strong>r markets.<br />
27<br />
We document a similar finding in a related study of spreads in <strong>the</strong> high-yield bond market. Less active<br />
high-yield bonds have lower estimated spreads, but dealer holding periods are lower <strong>and</strong> sell ratios are<br />
higher for <strong>the</strong>se issues.<br />
267
The Review of Financial Studies / v 20 n 2 2007<br />
268<br />
Table 11<br />
Dealer round-trip (DRT) spread estimates by pretransparency period trading activity<br />
Trade size (number of bonds) n Mean spread Median spread Mean days between trades Mean sell ratio Median sell ratio<br />
High trade frequency bonds<br />
£10 42,977 2.53 2.48 1.2 0.4 0.3<br />
11–20 13,821 2.42 2.25 1.2 0.5 0.4<br />
21–50 13,341 1.96 1.77 1.1 0.5 0.3<br />
51–100 3,502 1.22 0.84 1.0 0.6 0.6<br />
101–250 2,785 0.85 0.49 1.0 0.6 0.5<br />
251–1,000 6,241 0.69 0.49 1.0 0.6 0.5<br />
>1,000 9,772 0.57 0.40 0.7 0.8 1.0<br />
Lower trade frequency bonds<br />
£10 22,673 1.91 1.75 1.2 0.5 0.4<br />
11–20 6,797 1.86 1.63 1.3 0.6 0.6<br />
21–50 6,517 1.47 1.17 1.2 0.6 0.6<br />
51–100 1,820 0.88 0.50 0.9 0.7 1.0<br />
101–250 1,604 0.66 0.30 0.8 0.7 1.0<br />
251–1,000 3,297 0.63 0.33 0.8 0.8 1.0<br />
>1,000 6,759 0.58 0.36 0.5 0.9 1.0<br />
The table reports estimates of <strong>the</strong> effective bid-ask spread from DRTs completed within five days, based on transactions from July 8, 2002 through April 4, 2003. The sample<br />
includes all bonds in <strong>the</strong> 90 disseminated bond, 90 nondisseminated matching bond, or control portfolio groups. Days between trades is <strong>the</strong> number of days between trades in <strong>the</strong><br />
dealer round trip. Sell ratio is <strong>the</strong> number of bonds purchased by <strong>the</strong> customer (ending a DRT) divided by <strong>the</strong> number of bonds sold by <strong>the</strong> customer (starting a DRT). High<br />
trade frequency bonds are those in <strong>the</strong> top one-third of each group (90 disseminated, 90 matching, or control portfolio bonds) based on average daily trade count. Lower trade<br />
frequency bonds are those in <strong>the</strong> lower two-thirds of each group.
Credit Ratings as Coordination Mechanisms<br />
Given that dealers mitigate <strong>the</strong> risk of holding less active bonds, <strong>the</strong><br />
effects of transparency may not be as large as originally expected for less<br />
active bonds. Fur<strong>the</strong>rmore, for inactively traded bonds, <strong>the</strong> last-sale<br />
information that is provided by TRACE could be days or weeks old.<br />
Therefore, <strong>the</strong> additional information provided by this posttrade transparency<br />
could be of less value. The results in Section 3.2 support this<br />
suggestion in that <strong>the</strong> reduction in spreads associated with <strong>the</strong> introduction<br />
of transparency is significant only for <strong>the</strong> 90 more actively traded<br />
disseminated bonds <strong>and</strong> not <strong>the</strong> 30 thinly traded disseminated bonds.<br />
We explore this result fur<strong>the</strong>r in two ways, using just <strong>the</strong> 90 disseminated<br />
bond sample <strong>and</strong> controls. First, we repeat our analysis of regression-based<br />
spread estimates as in Table 9 but divide bonds into two<br />
groups based on <strong>the</strong>ir average daily trade count in <strong>the</strong> pretransparency<br />
selection period. The results (not shown here for brevity) indicate that for<br />
trade sizes up to 1000 bonds, <strong>the</strong> coefficient for <strong>the</strong> effect of dissemination<br />
is greater for <strong>the</strong> bonds that traded more frequently in <strong>the</strong> pretransparency<br />
period. Second, we repeat <strong>the</strong> analysis for <strong>the</strong> full sample of 90<br />
disseminated bonds <strong>and</strong> controls but add an additional variable to <strong>the</strong><br />
regressions interacting <strong>the</strong> dissemination effect with <strong>the</strong> average daily<br />
volume in <strong>the</strong> 30 days before <strong>the</strong> trade. The results (also not shown here<br />
for brevity) indicate that <strong>the</strong> interaction variable is significant at <strong>the</strong> 1%<br />
level for trade sizes up to 100 bonds <strong>and</strong> ranges from –0.06 for <strong>the</strong><br />
smallest trade size group to –0.03 for trades up to 100 bonds.<br />
Both sets of results are consistent with our finding that <strong>the</strong> impact of<br />
transparency on spreads is greatest for more actively traded bonds. We<br />
also find consistent results when we perform <strong>the</strong>se additional analyses<br />
using our DRT estimate of spreads ra<strong>the</strong>r than <strong>the</strong> regression-based<br />
estimates. Our evidence suggests that <strong>the</strong> availability of last trade price<br />
information may have little impact on spreads for less active bonds, where<br />
<strong>the</strong> last sale may have occurred days or weeks before <strong>and</strong> where <strong>the</strong> dealer<br />
may perform more of a search role.<br />
4. Summary <strong>and</strong> Conclusions<br />
This article presents <strong>the</strong> results of a unique controlled experiment<br />
designed to assess <strong>the</strong> impact of increased transparency on corporate<br />
bond liquidity. Examining transactions data for BBB-rated corporate<br />
bonds, we investigate how trading volume <strong>and</strong> round-trip trading costs<br />
change when posttrade transparency is introduced into <strong>the</strong> market by<br />
regulatory fiat.<br />
In general, both spreads <strong>and</strong> measures of trading activity, such as daily<br />
trading volume <strong>and</strong> number of transactions per day, ei<strong>the</strong>r decline or<br />
show no increase. Using two alternative methods, we find evidence that<br />
spreads decrease for bonds whose prices become transparent <strong>and</strong> that this<br />
269
The Review of Financial Studies / v 20 n 2 2007<br />
effect is strongest for intermediate trade sizes. The decrease in transaction<br />
costs for such trades is consistent with investors being able to negotiate<br />
better terms of trade with dealers once <strong>the</strong> investors have access to<br />
broader bond-pricing data. We do not find any effect (positive or negative)<br />
of transparency for very thinly traded bonds. Overall, our findings<br />
indicate that <strong>the</strong> increased posttrade transparency has a neutral or positive<br />
effect on market liquidity.<br />
Structural changes in transparency, such as those that occurred under<br />
TRACE, are observed somewhat rarely. In equities markets, <strong>the</strong>re have<br />
been a few opportunities to study <strong>the</strong> impact of changes in pretrade<br />
transparency. For example, Hendershott <strong>and</strong> Jones (2005) show that <strong>the</strong><br />
availability of quote information is associated with lower trading costs<br />
<strong>and</strong> increased market quality. O<strong>the</strong>r studies, however, produce more<br />
mixed results. 28 Thus, <strong>the</strong> results produced here for <strong>the</strong> introduction of<br />
posttrade transparency to <strong>the</strong> corporate bond market appear much more<br />
striking than those obtained previously for stocks. This may reflect <strong>the</strong><br />
fact that <strong>the</strong> equities markets studied were already quite transparent.<br />
Even with <strong>the</strong> introduction of posttrade transparency, <strong>the</strong> corporate<br />
bond markets still do not have <strong>the</strong> same degree of transparency as<br />
many o<strong>the</strong>r markets.<br />
Although <strong>the</strong> magnitude of our results differ, it is reassuring that <strong>the</strong><br />
results of our study are consistent with those of Bessembinder, Maxwell,<br />
<strong>and</strong> Venkataraman (2005) <strong>and</strong> Edwards et al. (2005). Using substantially<br />
different methodologies <strong>and</strong> samples, each of our studies suggests that <strong>the</strong><br />
introduction of transparency through TRACE is associated with a decline<br />
in trading costs for at least some bonds. Regulators have referred to <strong>the</strong><br />
results of our studies in <strong>the</strong>ir evaluation of <strong>the</strong> impact of transparency on<br />
corporate bond markets. 29<br />
Policy makers should take comfort in <strong>the</strong> results of <strong>the</strong> article. There<br />
are few instances in <strong>the</strong> tables above that show any harm to investors<br />
from increasing transparency <strong>and</strong> many examples that show how investors<br />
benefit from <strong>the</strong> change. The earliest adopters of systems providing<br />
access to TRACE data were investment professionals ra<strong>the</strong>r than retail<br />
investors, so that over time <strong>the</strong>re may be more benefit to <strong>the</strong> retail market.<br />
There are well-founded economic models that argue that transparency<br />
should lower transaction cost, especially for smaller trades. The results of<br />
this study should help to guide <strong>the</strong> debate over increasing transparency<br />
for securities markets.<br />
28<br />
Studies of pretrade transparency for equities include those of Madhavan, Porter, <strong>and</strong> Weaver (2005) <strong>and</strong><br />
Boehmer, Saar, <strong>and</strong> Yu (2005).<br />
29<br />
See Annette L. Nazareth, Speech by SEC Commissioner, U. S. Securities <strong>and</strong> Exchange Commission,<br />
February 7, 2006; Financial Services Authority, ‘‘Trading <strong>Transparency</strong> in <strong>the</strong> UK Secondary Bond<br />
Markets,’’ Discussion Paper, September 2005.<br />
270
Credit Ratings as Coordination Mechanisms<br />
Appendix: Data Cleaning <strong>and</strong> Sample Construction<br />
Before <strong>the</strong> inception of TRACE, <strong>the</strong>re was no m<strong>and</strong>atory reporting of corporate bond<br />
transactions. On January 23, 2001, <strong>the</strong> SEC approved rules requiring NASD members to<br />
report over-<strong>the</strong>-counter secondary market transactions in eligible fixed income securities.<br />
These comprehensive reporting requirements apply to investment grade, high yield <strong>and</strong><br />
unrated debt of US companies, <strong>and</strong> cover eligible securities including Rule 144A issues,<br />
convertible debt, floating rate notes, <strong>and</strong> various o<strong>the</strong>r types of corporate debt. Transactions<br />
reports for all eligible securities are reported to <strong>the</strong> NASD via <strong>the</strong> TRACE system, which<br />
was implemented on July 1, 2002. 30<br />
The initial raw TRACE data set consists of observations for all 4888 TRACE eligible<br />
securities with a BBB rating <strong>and</strong> that traded at least once in <strong>the</strong> period from July 8, 2002<br />
through January 31, 2003 <strong>and</strong> did not mature before February 27, 2004. The data include<br />
fields for CUSIP, execution date, time, price, yield, quantity, transacting parties’ IDs,<br />
principal/agent flag, commissions (if applicable), <strong>and</strong> buy/sell code. For principal trades,<br />
<strong>the</strong> price must include any markups or markdowns. For agency trades, <strong>the</strong> price does not<br />
include <strong>the</strong> commission charged, because commission is reported in a separate field. The<br />
characteristic data include CUSIP, embedded option flags, default status, bond rating, <strong>and</strong><br />
o<strong>the</strong>r characteristic fields. Our analysis includes trades in bonds identified by TRACE as<br />
BBB-rated, based on <strong>the</strong> bond’s rating at <strong>the</strong> time of <strong>the</strong> trade.<br />
The raw data include observations that contain entry errors, represent duplicate entries,<br />
or indicate canceled or corrected trade reports. For example, <strong>the</strong> trade entry system itself<br />
includes checks to screen out data-entry errors for price <strong>and</strong> yield, <strong>and</strong> returns an error<br />
message when <strong>the</strong>se entries deviate significantly from o<strong>the</strong>r recent transactions in <strong>the</strong> same<br />
security. The reporting party can still however resubmit <strong>the</strong> transaction with an ‘‘override<br />
flag.’’ To check remaining price errors, we use <strong>the</strong> median monthly price as a baseline.<br />
Prices that exceed <strong>the</strong> baseline by more than 50% are divided by an adjustment factor that<br />
assumes <strong>the</strong> price is off ei<strong>the</strong>r by a factor of 10 or by a factor of 100. The adjustment factor<br />
is assumed to be <strong>the</strong> multiple that provides an adjusted price closest to <strong>the</strong> baseline.<br />
TRACE guidelines also require users to enter <strong>the</strong> number of bonds traded; some observations,<br />
however, are consistent with users entering <strong>the</strong> par value of <strong>the</strong> bonds. Trade<br />
quantities that exceed <strong>the</strong> total number of issued bonds in a particular CUSIP are adjusted<br />
by <strong>the</strong> par value of <strong>the</strong> issue. All o<strong>the</strong>r quantities are assumed to have been entered<br />
correctly.<br />
TRACE reporting guidelines result in duplicate entries in our data set for several types of<br />
transactions. Because all NASD member firms are required to submit <strong>the</strong> details for <strong>the</strong>ir<br />
own side of <strong>the</strong> transaction, <strong>the</strong> raw data include two observations for most interdealer<br />
trades. To avoid double counting trades, we match both sides of interdealer trades using<br />
dealer identities <strong>and</strong> o<strong>the</strong>r trade characteristics. Customer transactions also may have<br />
duplicate entries when <strong>the</strong> member firm acts in an agent capacity <strong>and</strong> trades on behalf of<br />
one of its customers; we match agency trades to remove duplicate entries. Finally, TRACE<br />
has specific guidelines as to <strong>the</strong> entry of certain o<strong>the</strong>r interdealer <strong>and</strong> agency trades; we<br />
exclude trades that have entries inconsistent with <strong>the</strong>se guidelines. 31<br />
30<br />
As of July 2002, member firms were required to submit reports within one hour <strong>and</strong> fifteen minutes of<br />
trade execution during normal system hours. The reporting window was shortened to 45 minutes on<br />
October 1, 2003. See http://www.nasd.com/mkt_sys/TRACE_info.asp for detailed description of <strong>the</strong><br />
reporting requirements under TRACE.<br />
31<br />
These include incorrect entry of ‘‘Give-up’’ trades <strong>and</strong> duplicate entries from undisclosed ‘‘Automatic<br />
Give-Up’’ trades.<br />
271
The Review of Financial Studies / v 20 n 2 2007<br />
In addition, a small percentage of trade reports are incorrectly entered into TRACE. All<br />
canceled trades are flagged as such <strong>and</strong> excluded from <strong>the</strong> analysis. When a user modifies <strong>the</strong><br />
details of a trade, TRACE creates a new observation that contains all <strong>the</strong> current terms of<br />
<strong>the</strong> trade, <strong>and</strong> <strong>the</strong> original observation is flagged as modified. For those trades that have<br />
been revised, we retain <strong>the</strong> observation with <strong>the</strong> most recent revision.<br />
References<br />
Ahn, H., C. Q. Cao, <strong>and</strong> H. Choe, 1996, ‘‘Tick Size, Spread, <strong>and</strong> Volume,’’ Journal of Financial<br />
Intermediation, 5(1), 2–22.<br />
Ahn, H., C. Q. Cao, <strong>and</strong> H. Choe, 1998, ‘‘Decimalization <strong>and</strong> Competition among Stock Markets:<br />
Evidence from <strong>the</strong> Toronto Stock Exchange Cross-Listed Securities,’’ Journal of Financial Markets, 1(1),<br />
51–87.<br />
Alex<strong>and</strong>er, G., A. Edwards, <strong>and</strong> M. Ferri, 2000, ‘‘The Determinants of <strong>the</strong> Trading Volume of High-<br />
Yield Corporate Bonds,’’ Journal of Financial Markets, 3(2), 177–204.<br />
Bacidore, J., 1997, ‘‘The Impact of Decimalization on Market Quality: An Empirical Investigation of <strong>the</strong><br />
Toronto Stock Exchange,’’ Journal of Financial Intermediation, 6(2), 92–120.<br />
Bernhardt, D., V. Dvoracek, E. Hughson, <strong>and</strong> I. Werner, 2005, ‘‘Why Do Larger Orders Receive<br />
Discounts on <strong>the</strong> London Stock Exchange?’’ Review of Financial Studies, 18(4), 1343–1368.<br />
Bessembinder, H., W. Maxwell, <strong>and</strong> K. Venkataraman, 2005, ‘‘Optimal Market <strong>Transparency</strong>: Evidence<br />
from <strong>the</strong> Initiation of Trade Reporting in Corporate Bonds,’’ forthcoming in Journal of Financial<br />
Economics.<br />
Biais, B., L. Glosten, <strong>and</strong> C. Spatt, 2005, ‘‘Market Microstructure: A Survey of Microfoundations,<br />
Empirical Results, <strong>and</strong> Policy Implications,’’ Journal of Financial Markets, 8(2), 217–264.<br />
Biais, B., <strong>and</strong> R. Green, 2005, ‘‘The Microstructure of <strong>the</strong> Bond Market in <strong>the</strong> 20 th Century,’’ working<br />
paper, Toulouse University <strong>and</strong> Carnegie Mellon University.<br />
Bloomfield, R., <strong>and</strong> M. O’Hara, 1999, ‘‘Market <strong>Transparency</strong>: Who Wins <strong>and</strong> Who Loses?’’ Review of<br />
Financial Studies, 12(1), 5–35.<br />
Boehmer, E., G. Saar, <strong>and</strong> L. Yu, 2005, ‘‘Lifting <strong>the</strong> Veil: An Analysis of Pre-Trade <strong>Transparency</strong> at <strong>the</strong><br />
NYSE,’’ Journal of Finance, 60(2), 783–815.<br />
Chakravarty, S., <strong>and</strong> A. Sarkar, 2003, ‘‘A Comparison of Trading Costs in <strong>the</strong> U.S. Corporate, Municipal<br />
<strong>and</strong> Treasury Bond Markets,’’ Journal of Fixed Income, 13(1), 39–48.<br />
Chakravarty, S., R. A. Wood, <strong>and</strong> R. A. Van Ness, 2004, ‘‘Decimals <strong>and</strong> <strong>Liquidity</strong>: A Study of <strong>the</strong><br />
NYSE,’’ Journal of Financial Research, 27(1), 75–94.<br />
Chen, L., D. Lesmond, <strong>and</strong> J. Wei, 2005, ‘‘Corporate Yield Spreads <strong>and</strong> Bond <strong>Liquidity</strong>,’’ working paper,<br />
Michigan State University, Tulane University, <strong>and</strong> University of Toronto.<br />
Davies, R., <strong>and</strong> S. Kim, 2004, ‘‘Using Matched Samples to Test for Differences in Trade Execution<br />
Costs,’’ working paper, <strong>Babson</strong> <strong>College</strong>.<br />
Edwards, A., L. Harris, <strong>and</strong> M. Piwowar, 2005, ‘‘Corporate Bond Market <strong>Transparency</strong> <strong>and</strong> Transactions<br />
Cost,’’ forthcoming in Journal of Finance.<br />
Federal Register, 2002, Securities <strong>and</strong> Exchange Commission Release No. 34-47057, File No. SR-NASD-<br />
2002-174, Vol. 67, no. 249, December 27, FR Doc. 02-32735, P. 79210–79213.<br />
Federal Register, 2003, Securities <strong>and</strong> Exchange Commission Release No. 34-47566, File No. SR-NASD-<br />
2003-41, Vol. 68, no. 61, March 31, FR Doc. 03-7613, P. 15490–15492.<br />
Gemmill, G., 1996, ‘‘<strong>Transparency</strong> <strong>and</strong> <strong>Liquidity</strong>: A Study of Block Trades on <strong>the</strong> London Stock<br />
Exchange Under Different Publication Rules,’’ Journal of Finance, 51(5), 1765–1790.<br />
272
Credit Ratings as Coordination Mechanisms<br />
Green, R., B. Hollifield, <strong>and</strong> N. Schurhoff, 2004, ‘‘Financial Intermediation <strong>and</strong> <strong>the</strong> Costs of Trading in<br />
an Opaque Market,’’ working paper, Carnegie Mellon University.<br />
Harris, L. E., 1994, ‘‘Minimum Price Variations, Discrete Bid-Ask Spreads, <strong>and</strong> Quotation Sizes,’’ Review<br />
of Financial Studies, 7(1), 149–178.<br />
Hendershott, T., <strong>and</strong> C. M. Jones, 2005, ‘‘Isl<strong>and</strong> Goes Dark: <strong>Transparency</strong>, Fragmentation, <strong>and</strong> Regulation,’’<br />
Review of Financial Studies, 18(3), 743–793.<br />
Hong, G., <strong>and</strong> A. Warga, 2000, ‘‘An Empirical Study of Corporate Bond Market Transactions,’’<br />
Financial Analysts Journal, 56(2), 32–46.<br />
Hotchkiss, E., G. Jostova, <strong>and</strong> A. Warga, 2005, ‘‘Determinants of Corporate Bond Trading: A Comprehensive<br />
Analysis,’’ working paper, Boston <strong>College</strong>.<br />
Hotchkiss, E., <strong>and</strong> T. Ronen, 2002, ‘‘The Informational Efficiency of <strong>the</strong> Corporate Bond Market: An<br />
Intraday Analysis,’’ Review of Financial Studies, 15(5), 1325–1354.<br />
Madhavan, A., 1995, ‘‘Consolidation, Fragmentation, <strong>and</strong> <strong>the</strong> Disclosure of Trading Information,’’<br />
Review of Financial Studies, 8(3), 579–603.<br />
Madhavan, A., D. Porter, <strong>and</strong> D. Weaver, 2005, ‘‘Should Securities Markets be Transparent?’’ Journal of<br />
Financial Markets, 8(3), 265–287.<br />
Naik, N., Neuberger, A., <strong>and</strong> S. Viswanathan, 1999, ‘‘Trade Disclosure Regulation in Markets with<br />
Negotiated Trades,’’ Review of Financial Studies, 12(4), 873–900.<br />
National Association of Securities Dealers, 2004, Report of <strong>the</strong> Corporate Debt Market Panel.<br />
Pagano, M., <strong>and</strong> A. Roell, 1996, ‘‘<strong>Transparency</strong> <strong>and</strong> <strong>Liquidity</strong>: A Comparison of Auction <strong>and</strong> Dealer<br />
Markets with Informed Trading,’’ Journal of Finance, 51(2), 579–611.<br />
Ronen, T., <strong>and</strong> D. G. Weaver, 2001, ‘‘Teenies’ Anyone?’’ Journal of Financial Markets, 4(3), 231–260.<br />
Schultz, P., 2001, ‘‘Corporate Bond Trading Costs And Practices: A Peek Behind <strong>the</strong> Curtain,’’ Journal of<br />
Finance, 56(2), 677–698.<br />
Warga, A., 1991, ‘‘Corporate Bond Price Discrepancies in <strong>the</strong> Dealer <strong>and</strong> Exchange Markets,’’ Journal of<br />
Fixed Income, 1(3), 7–16.<br />
Warga, A., <strong>and</strong> I. Welch, 1993, ‘‘Bondholder Losses in Leveraged Buyouts,’’ Review of Financial Studies,<br />
6(4), 959–982.<br />
273