Verint Announces Selected Unaudited Financial Information
Verint Announces Selected Unaudited Financial Information
Verint Announces Selected Unaudited Financial Information

Create successful ePaper yourself
Turn your PDF publications into a flip-book with our unique Google optimized e-Paper software.
Contacts:<br />
Investor Relations<br />
Alan Roden<br />
<strong>Verint</strong> Systems Inc.<br />
(631) 962-9304<br />
alan.roden@verint.com<br />
Press Release<br />
<strong>Verint</strong> <strong>Announces</strong> <strong>Selected</strong> <strong>Unaudited</strong> <strong>Financial</strong> <strong>Information</strong><br />
<strong>Verint</strong> to Hold Conference Call Following Completion of Comprehensive Form 10-K<br />
MELVILLE, N.Y., February 3, 2010 – <strong>Verint</strong> ® Systems Inc. (VRNT.PK) today announced selected unaudited financial<br />
information for the years ended January 31, 2006, 2007 and 2008 and preliminary selected unaudited financial highlights<br />
for the years ended January 31, 2009 and 2010. As previously disclosed, the Company is now substantially complete<br />
with its Annual Report on Form 10-K for the years ended January 31, 2006, 2007 and 2008 (the “Comprehensive Form<br />
10-K”) and plans to file it as soon as possible after receiving certain necessary information from Comverse Technology,<br />
Inc. (“Comverse”), its majority stockholder. The financial information presented in this press release is unaudited and is<br />
subject to adjustments. These adjustments could be significant. Please see the Company’s Current Report on Form 8-K<br />
filed today with the SEC for additional information.<br />
Once <strong>Verint</strong> files its Comprehensive Form 10-K, <strong>Verint</strong> intends to hold a conference call to discuss its results. <strong>Verint</strong>’s<br />
Annual Report on Form 10-K for the year ended January 31, 2009 and <strong>Verint</strong>’s Quarterly Reports on Form 10-Q for the<br />
first three quarters of the year ended January 31, 2010 are in process and will also be filed as soon as possible following<br />
filing of the Company’s Comprehensive Form 10-K. <strong>Verint</strong> also intends to apply to re-list its shares of common stock on<br />
the NASDAQ Global Market.<br />
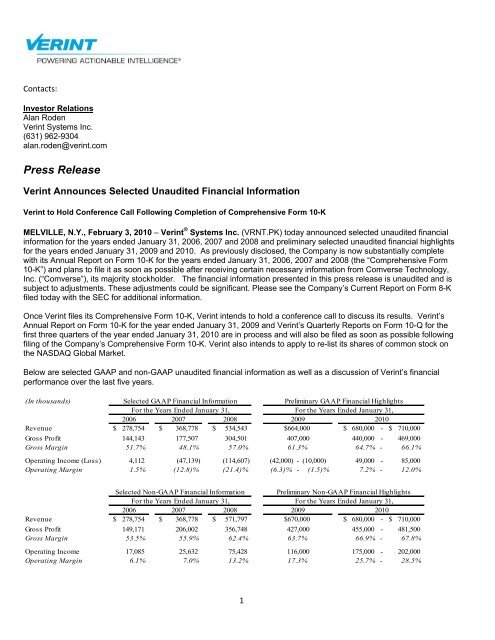
Below are selected GAAP and non-GAAP unaudited financial information as well as a discussion of <strong>Verint</strong>’s financial<br />
performance over the last five years.<br />
(In thousands)<br />
<strong>Selected</strong> GAAP <strong>Financial</strong> <strong>Information</strong><br />
Preliminary GAAP <strong>Financial</strong> Highlights<br />
For the Years Ended January 31,<br />
For the Years Ended January 31,<br />
2006 2007 2008<br />
2009<br />
2010<br />
Revenue $ 278,754 $ 368,778 $ 534,543 $664,000 $ 680,000 - $ 710,000<br />
Gross Profit 144,143 177,507 304,501 407,000<br />
440,000 - 469,000<br />
Gross Margin 51.7% 48.1% 57.0% 61.3%<br />
64.7% - 66.1%<br />
Operating Income (Loss) 4,112 (47,139) (114,607) (42,000) - (10,000) 49,000 - 85,000<br />
Operating Margin 1.5% (12.8)% (21.4)% (6.3)% - (1.5)% 7.2% - 12.0%<br />
<strong>Selected</strong> Non-GAAP <strong>Financial</strong> <strong>Information</strong> Preliminary Non-GAAP <strong>Financial</strong> Highlights<br />
For the Years Ended January 31,<br />
For the Years Ended January 31,<br />
2006 2007 2008<br />
2009<br />
2010<br />
Revenue $ 278,754 $ 368,778 $ 571,797 $670,000 $ 680,000 - $ 710,000<br />
Gross Profit 149,171 206,002 356,748 427,000<br />
455,000 - 481,500<br />
Gross Margin 53.5% 55.9% 62.4% 63.7%<br />
66.9% - 67.8%<br />
Operating Income 17,085 25,632 75,428 116,000<br />
175,000 - 202,000<br />
Operating Margin 6.1% 7.0% 13.2% 17.3%<br />
25.7% - 28.5%<br />
1
Non-GAAP revenue increased from approximately $279 million in the year ended January 31, 2006 to a range of<br />
approximately $680 million to approximately $710 million in the year ended January 31, 2010.<br />
Non-GAAP gross margins increased from approximately 53.5% in the year ended January 31, 2006 to a range of<br />
approximately 66.9% to approximately 67.8% in the year ended January 31, 2010.<br />
Non-GAAP operating margins increased from approximately 6.1% in the year ended January 31, 2006 to a range<br />
of approximately 25.7% to approximately 28.5% in the year ended January 31, 2010.<br />
“We have significantly increased the scale of our business and are pleased to share our results which we believe<br />
demonstrates our leadership position in the actionable intelligence market,” said Dan Bodner, CEO and President of<br />
<strong>Verint</strong> Systems Inc.<br />
Years Ended January 31, 2006, 2007 and 2008<br />
As previously disclosed, the Company is now substantially complete with its Comprehensive Form 10-K covering<br />
these years and had expected to file it last week. However, the Company is currently not in a position to file its<br />
Comprehensive Form 10-K because of an unexpected recent change in the allocation of the net operating loss<br />
carryforwards (“NOLs”) it received from Comverse for the year ended January 31, 2003 and earlier years (i.e.<br />
prior to <strong>Verint</strong>’s initial public offering). To the extent that the Comverse NOLs would require further modification,<br />
the portion allocated to <strong>Verint</strong> may also be modified. Certain other changes at Comverse could also affect <strong>Verint</strong>.<br />
Therefore, while <strong>Verint</strong> is substantially complete with its Comprehensive 10-K, it will only be in a position to file<br />
after receiving the necessary information from Comverse.<br />
We are providing selected unaudited consolidated financial information for the years ended January 31, 2006,<br />
2007 and 2008. This financial information is derived from our unaudited financial statements, and subject to<br />
adjustments that could be significant.<br />
Years Ended January 31, 2009 and 2010 Preliminary <strong>Financial</strong> Highlights<br />
We are providing preliminary financial highlights for the year ended January 31, 2009. This financial information is<br />
derived from our unaudited internal financial records and systems that are the basis for our internal unaudited<br />
consolidated financial statements and subject to adjustments that could be significant. We intend to file our<br />
Annual Report on Form 10-K covering this period as soon as possible following the filing of the Comprehensive<br />
Form 10-K.<br />
We are providing preliminary financial highlights in the form of a range for the year ended January 31, 2010<br />
because our results for the year are preliminary and unaudited and subject to adjustments that could be<br />
significant. We intend to file our Quarterly Reports on Form 10-Q for the first three quarters of the year ended<br />
January 31, 2010 as soon as possible after filing the Annual Report on Form 10-K for the year ended January 31,<br />
2009 and intend to file a Form 10-K for the year ending January 31, 2010 thereafter. Following is a discussion of<br />
financial highlights for this period:<br />
o While the economic climate has been challenging this year and order activity declined, our revenue<br />
forecast for the year ended January 31, 2010 is up compared to the prior year as our results were<br />
positively impacted from changes in our business practices and the application of certain revenue<br />
recognition methodologies as we worked towards the completion of our Comprehensive Form 10-K.<br />
o We expect non-GAAP operating margins of approximately 25.7% to approximately 28.5% for the year<br />
ended January 31, 2010. However, our operating margin benefited from the positive revenue impact<br />
discussed above, as well as other factors, including certain expense control initiatives, and therefore, we<br />
do not believe this level is sustainable.<br />
o As of January 31, 2010, <strong>Verint</strong> had approximately $189 million of cash and cash equivalents, restricted<br />
cash and bank time deposits and approximately $621 million of bank debt.<br />
2
Year Ending January 31, 2011 Preliminary Outlook<br />
We are providing a preliminary outlook for the year ending January 31, 2011.<br />
o We are currently seeing early signs of economic improvement and therefore expect improved order<br />
activity resulting in revenue of approximately $700 million next year.<br />
o As discussed above, we do not believe the approximately 26% to approximately 29% non-GAAP<br />
operating margin that we are forecasting for the year ended January 31, 2010 is sustainable and<br />
therefore we are targeting an approximate 20% non-GAAP operating margin for the year ending January<br />
31, 2011, which we believe is a more appropriate level for a company of our scale.<br />
Bodner continued, “Our success is built on a broad portfolio of enterprise workforce optimization and security intelligence<br />
solutions. Our unified suite of enterprise workforce optimization solutions enables organizations to improve the<br />
performance of their customer service operations, improve the customer experience, and enhance compliance by<br />
leveraging unstructured information from customer interactions and other customer-related data. Our security intelligence<br />
solutions enable organizations to detect, investigate, and neutralize security threats by distilling intelligence from a wide<br />
range of unstructured and structured information sources.”<br />
Doug Robinson, <strong>Verint</strong> CFO, added “We continue to devote a significant amount of effort and resources to complete our<br />
filings. We look forward to holding a conference call to discuss our results once our Comprehensive Form 10-K is filed.”<br />
About Non-GAAP <strong>Financial</strong> Measures<br />
This press release and the accompanying tables include non-GAAP financial measures. For a description of these non-<br />
GAAP financial measures, including the reasons management uses each measure, and reconciliations of these non-<br />
GAAP financial measures to the most directly comparable financial measures prepared in accordance with Generally<br />
Accepted Accounting Principles (“GAAP”), please see Tables 3 and 4 as well as "Supplemental <strong>Information</strong> About Non-<br />
GAAP Measures" at the end of this press release. Because we do not predict special items that might occur in the future,<br />
and our outlook is developed at a level of detail different than that used to prepare GAAP financial measures, we are not<br />
providing reconciliation to GAAP of our forward-looking financial measures for the year ending January 31, 2011.<br />
About <strong>Unaudited</strong> Preliminary <strong>Financial</strong> <strong>Information</strong><br />
This press release includes selected, unaudited financial information for the years ended January 31, 2006, 2007, and<br />
2008, certain preliminary, unaudited financial highlights for the year ended January 31, 2009, and certain preliminary,<br />
unaudited ranges for the year ended January 31, 2010. These preliminary results, highlights, and ranges are subject to<br />
adjustments, which could be material, and do not present all information necessary for an understanding of our financial<br />
performance. We derived the selected financial information as of and for the years ended January 31, 2006, 2007, and<br />
2008 from our unaudited consolidated financial statements. We derived the preliminary, unaudited financial highlights for<br />
the year ended January 31, 2009 from our unaudited internal financial records and systems that are the basis for our<br />
internal unaudited consolidated financial statements for that period. We derived the preliminary, unaudited ranges for the<br />
year ended January 31, 2010 from our internal unaudited financial records and systems.<br />
We are substantially complete with preparing our consolidated financial statements for the years ended January 31, 2006,<br />
2007, and 2008, we are preparing to complete our consolidated financial statements for the year ended January 31,<br />
2009, and we have now begun the closing process necessary to prepare our consolidated financial statements for the<br />
year ended January 31, 2010. Because we are still in the process of completing our consolidated financial statements for<br />
the year ended January 31, 2009 and are still in the process of closing our books for the year ended January 31, 2010,<br />
information for these periods is by their nature more preliminary and limited than the information available to us for the<br />
years ended January 31, 2006, 2007, and 2008. Our finalization of these consolidated financial statements, and the<br />
completion of the related audits of these consolidated financial statements, could result in changes to the consolidated<br />
financial statements for these periods and such changes could be material. Careful consideration should be paid to these<br />
qualifications and the risks set forth in “Cautions About Forward-Looking Statements” below in evaluating our financial<br />
performance for the years ended January 31, 2006, 2007, 2008, 2009, and 2010.<br />
About <strong>Verint</strong> Systems Inc.<br />
<strong>Verint</strong>® Systems Inc. is a global leader in Actionable Intelligence® solutions and value-added services. Our solutions<br />
enable organizations of all sizes to make timely and effective decisions to improve enterprise performance and make the<br />
world a safer place. More than 10,000 organizations in over 150 countries ― including over 80% of the Fortune 100 ―<br />
use <strong>Verint</strong> solutions to capture, distill, and analyze complex and underused information sources, such as voice, video, and<br />
unstructured text. Headquartered in Melville, New York, we support our customers around the globe directly and with an<br />
extensive network of selling and support partners. Visit us at our website www.verint.com.<br />
3
Cautions About Forward-Looking Statements<br />
This press release contains "forward-looking statements" within the meaning of the Private Securities Litigation Reform<br />
Act of 1995, including statements regarding expectations, predictions, views, opportunities, plans, strategies, beliefs, and<br />
statements of similar effect relating to <strong>Verint</strong> Systems Inc. These forward-looking statements are not guarantees of future<br />
performance and they are based on management's expectations that involve a number of risks and uncertainties, any of<br />
which could cause actual results to differ materially from those expressed in or implied by the forward-looking statements.<br />
Some of the factors that could cause actual future results or conditions to differ materially from current expectations<br />
include: risks related to potential adjustments we may be required to make to our preliminary, unaudited financial<br />
information, highlights and ranges presented herein in connection with the completion of the consolidated financial<br />
statements from which the financial information was derived, and the related audit of these consolidated financial<br />
statements, which could result in adjustments, some of which could be material; risks associated with our formerly being a<br />
part of Comverse’s consolidated tax group and our dependency on Comverse to provide us with certain financial<br />
information and, including with respect to stock-based compensation expense and NOLs, that we must receive in order to<br />
finalize our consolidated financial statements; risks relating to the filing of our SEC reports, including the occurrence of<br />
known contingencies or unforeseen events that could delay our plan for completion of our consolidated financial<br />
statements, management distraction, and significant expense; risks that the delay in the filing of our Comprehensive Form<br />
10-K, Annual Report on Form 10-K for the year ended January 31, 2009 and the Quarterly Reports on Form 10-Q for<br />
each quarters ended April 30, July 31 and October 31, 2009 may cause us to be delayed in the completion of, and timely<br />
filing of our Annual Report for, the year ended January 31, 2010, which may cause us to not be in compliance with the<br />
financial statement delivery requirements of our credit facility and result in an event of default thereunder; risks related to<br />
S&P’s announcement on January 29, 2010 that our credit rating had been placed on CreditWatch Developing, or that S&P<br />
or Moody’s could further downgrade our credit ratings; risk that the SEC could initiate an administrative proceeding to<br />
revoke the registration of our common stock under the Securities Exchange Act of 1934, as amended, because we did not<br />
complete our Comprehensive Form 10-K, Annual Report on Form 10-K for the year ended January 31, 2009 and the<br />
Quarterly Reports on Form 10-Q for each of the quarters ended April 30, July 31 and October 31, 2009 by January 29,<br />
2010; risks associated with being a consolidated, controlled subsidiary of Comverse, including risk of any future impact<br />
on us resulting from Comverse’s special committee investigation and restatement or related effects; uncertainty regarding<br />
the impact of general economic conditions, particularly in information technology spending, on our business; risk that our<br />
financial results will cause us not to be compliant with the leverage ratio covenant under our credit facility; risk that<br />
customers or partners delay or cancel orders or are unable to honor contractual commitments due to liquidity issues,<br />
challenges in their business, or otherwise; risk that we will experience liquidity or working capital issues and related risk<br />
that financing sources will be unavailable to us on reasonable terms or at all; uncertainty regarding the future impact on<br />
our business of our internal investigation, restatement, and extended filing delay, including customer, partner, employee,<br />
and investor concern and potential customer and partner transaction deferrals or losses; risks relating to the remediation<br />
or inability to adequately remediate internal control weaknesses and to the proper application of complex accounting rules<br />
and pronouncements in order to produce accurate SEC reports on a timely basis; risks relating to our implementation and<br />
maintenance of adequate systems and internal controls for our current and future operations and reporting needs; risk of<br />
possible future restatements if the special processes being used to prepare the consolidated financial statements related<br />
to the years for which financial information is contained herein or the regular recurring processes that will be used to<br />
produce future SEC reports are inadequate; risk associated with current or future regulatory actions or private litigations<br />
relating to our internal investigation, restatement, or delay in timely making required SEC filings, including the risk that we<br />
may not have sufficient insurance to cover potential liability in any future claims; risk that we will be unable to re-list our<br />
common stock on a national securities exchange and maintain such listing, thus impacting our ability to register securities<br />
and raise capital; risks associated with Comverse controlling our board of directors and a majority of our common stock<br />
(and therefore the results of any significant stockholder vote); risks associated with significant leverage resulting from our<br />
current debt position, including risks that we may be limited in our ability to obtain additional debt financing, that we may<br />
be required to dedicate a substantial portion of our cash flow from operations to debt service, and that we may be more<br />
vulnerable to economic downturns; risks due to aggressive competition in all of our markets, including with respect to<br />
maintaining margins and sufficient levels of investment in the business and with respect to introducing quality products<br />
which achieve market acceptance; risks created by continued consolidation of competitors or introduction of large<br />
competitors in our markets with greater resources than us; risks associated with significant foreign and international<br />
operations, including exposure to fluctuations in exchange rates; risks associated with complex and changing local and<br />
foreign regulatory environments, including the risk that we may not be able to receive or retain certain licenses or<br />
authorizations necessary to our business; risks associated with our ability to recruit and retain qualified personnel in all<br />
geographies in which we operate, including the risk that we may have difficulty retaining or motivating employees with our<br />
common stock so long as we remain delayed in the filing of our SEC reports; challenges in accurately forecasting revenue<br />
and expenses because of shifts in product mixes or timing of orders; risks associated with acquisitions and related system<br />
integrations; risks relating to our ability to improve our infrastructure to support growth; risks that our intellectual property<br />
rights may not be adequate to protect our business or that others may make claims on our intellectual property or claim<br />
infringement on their intellectual property rights; risks associated with a significant amount of our business coming from<br />
domestic and foreign government customers; risk that we improperly handle sensitive or confidential information or<br />
4
perception of such mishandling; risks associated with dependence on a limited number of suppliers for certain<br />
components of our products; risk that we are unable to maintain and enhance relationships with key resellers, partners<br />
and systems integrators; and risk that use of our NOLs or other tax benefits may be restricted or eliminated in the future.<br />
We assume no obligation to revise or update any forward-looking statement, except as otherwise required by law.<br />
VERINT, the VERINT logo, ACTIONABLE INTELLIGENCE, POWERING ACTIONABLE INTELLIGENCE, WITNESS<br />
ACTIONABLE SOLUTIONS, STAR-GATE, RELIANT, VANTAGE, X-TRACT, NEXTIVA, EDGEVR, ULTRA, AUDIOLOG,<br />
WITNESS, the WITNESS logo, IMPACT 360, the IMPACT 360 logo, IMPROVE EVERYTHING, EQUALITY,<br />
CONTACTSTORE, EYRETEL, BLUE PUMPKIN SOFTWARE, BLUE PUMPKIN, the BLUE PUMPKIN logo, EXAMETRIC<br />
and the EXAMETRIC logo, CLICK2STAFF, STAFFSMART, AMAE SOFTWARE and the AMAE logo are trademarks and<br />
registered trademarks of <strong>Verint</strong> Systems Inc. Other trademarks mentioned are the property of their respective owners.<br />
5
For the Years Ended January 31,<br />
2006 2007 2008<br />
Revenue $ 278,754 $ 368,778 $ 534,543<br />
$664,000<br />
$ 680,000 - $ 710,000<br />
Cost of revenue 134,611<br />
Gross profit 144,143<br />
Operating expenses 140,031<br />
Operating income (loss) 4,112<br />
Other income (expense), net 7,995<br />
6<br />
191,271<br />
177,507<br />
224,646<br />
(47,139)<br />
7,796<br />
230,042<br />
304,501<br />
419,108<br />
(114,607)<br />
(55,347)<br />
449,000<br />
(42,000)<br />
(45,682)<br />
Income (loss) before income taxes and noncontrolling interest 12,107 (39,343) (169,954) #VALUE!<br />
Provision for income taxes (2) 9,625 141 27,333 (3,085)<br />
Noncontrolling interest in net income of joint venture 818 921 1,064<br />
Net income (loss) 1,664 (40,405) (198,351) #VALUE!<br />
Dividends on preferred stock -<br />
-<br />
(8,681) (11,894)<br />
Net income (loss) applicable to common shares $ 1,664 $ (40,405) $ (207,032) #VALUE!<br />
Net income (loss) per share<br />
Basic $ 0.05 $ (1.26) $ (6.43) #REF!<br />
Diluted $ 0.05 $ (1.26) $ (6.43) #REF!<br />
Weighted average common shares outstanding<br />
Basic 31,781<br />
Diluted 32,620<br />
Table 1<br />
<strong>Verint</strong> Systems Inc. and Subsidiaries<br />
<strong>Selected</strong> <strong>Unaudited</strong> GAAP Statement of Operations <strong>Information</strong><br />
(In thousands, except share and per share data)<br />
NOTE: The information presented below is unaudited and subject to adjustments. These adjustments could be significant.<br />
32,156<br />
32,156<br />
32,221<br />
32,221<br />
#REF!<br />
#REF!<br />
For the Years Ended January 31,<br />
2009<br />
2010 (1)<br />
Preliminary<br />
Preliminary Range<br />
257,000<br />
- 417,000<br />
- (10,000)<br />
240,000<br />
440,000<br />
391,000<br />
49,000<br />
- 241,000<br />
- 469,000<br />
- 384,000<br />
- 85,000<br />
(1) January 31, 2010 range excludes potential special charges such as impairments of goodwill and other acquired intangible assets because we have not yet performed<br />
the impairment testing for that period.<br />
(2) At the date of our initial public offering, May 15, 2002, we were allocated certain net operating loss carryforwards ("NOLs") from our majority stockholder Comverse.<br />
We have included in our consolidated balance sheets and results of operations for the years ended January 31, 2006, 2007 and 2008 the amount of these NOLs based on<br />
certain information received from Comverse. If we were to discover new information that impacts our reported NOLs from Comverse, we would revise these amounts. If in<br />
the event the Company were to learn that $0 NOLs received from Comverse are available to us, our cumulative income tax expense through the year ended January 31,<br />
2009 would increase by approximately $200,000.<br />
407,000
Table 2<br />
<strong>Verint</strong> Systems Inc. and Subsidiaries<br />
<strong>Selected</strong> <strong>Unaudited</strong> GAAP Consolidated Balance Sheet <strong>Information</strong><br />
(In thousands, except share and per share data)<br />
NOTE: The information presented below is unaudited and subject to adjustments. These adjustments could be significant.<br />
2006<br />
As of January 31,<br />
2007 2008<br />
Cash and cash equivalents $ 55,730 $ 49,325 $ 83,233<br />
Restricted cash and bank time deposits $ 4,047 $ 3,652 $ 3,612<br />
Short-term investments $ 167,922 $ 127,453 $ -<br />
Total assets $ 609,558 $ 592,160 $ 1,484,956<br />
Long-term debt $ 1,325 $ 1,058 $ 610,000<br />
Total liabilities (1) $ 389,926 $ 394,754 $ 1,163,629<br />
Preferred Stock - $0.001 par value; authorized 2,500,000 shares. Series A convertible<br />
preferred stock; 293,000 shares issued and outstanding; aggregate liquidation<br />
preference and redemption value of $301,681 at January 31, 2008. $ - $ - $ 293,663<br />
Total stockholders' equity (1) $ 219,632 $ 197,406 $ 27,664<br />
(1) At the date of our initial public offering, May 15, 2002, we were allocated certain net operating loss carryforwards ("NOLs") from<br />
our majority stockholder Comverse. We have included in our consolidated balance sheets and results of operations for the years<br />
ended January 31, 2006, 2007 and 2008 the amount of these NOLs based on certain information received from Comverse. If we were to<br />
discover new information that impacts our reported NOLs from Comverse, we would revise these amounts. If in the event the Company<br />
were to learn that $0 NOLs received from Comverse are available to us, in our January 31, 2009 balance sheet, our total liabilities would<br />
increase by approximately $1.0 million and our stockholders' equity would decrease by the same amount.<br />
7
Table 3<br />
<strong>Verint</strong> Systems Inc. and Subsidiaries<br />
Reconciliation of <strong>Unaudited</strong> GAAP to Non-GAAP Results<br />
(In thousands, except per share data)<br />
NOTE: The information presented below is unaudited and subject to adjustments. These adjustments could be significant.<br />
For the Years Ended January 31,<br />
For the Years Ended January 31,<br />
2006 2007 2008<br />
2009 2010 (1)<br />
Preliminary Preliminary Range<br />
Table of Reconciliation from GAAP Revenue to Non-GAAP Revenue<br />
GAAP revenue $ 278,754 $ 368,778 $ 534,543 $664,000<br />
$ 680,000 - $ 710,000<br />
Revenue adjustments related to acquisitions -<br />
- 37,254<br />
6,000<br />
-<br />
-<br />
Non-GAAP revenue $ 278,754 $ 368,778 $ 571,797 $670,000 $ 680,000 - $ 710,000<br />
Table of Reconciliation from GAAP Gross Profit to Non-GAAP Gross Profit<br />
GAAP gross profit $ 144,143 $ 177,507 $ 304,501 $407,000 $ 440,000 - $ 469,000<br />
Revenue adjustments related to acquisitions -<br />
- 37,254<br />
6,000<br />
-<br />
-<br />
Amortization and impairment of acquired technology and backlog 5,017 7,664 8,018<br />
9,000<br />
9,000 - 7,000<br />
Settlement with OCS - 19,158 -<br />
-<br />
-<br />
-<br />
Stock-based compensation 11 1,673 4,548<br />
5,000<br />
6,000 - 5,500<br />
Expenses related to our restatement and extended filing delay -<br />
- 2,427<br />
-<br />
-<br />
-<br />
Non-GAAP gross profit $ 149,171 $ 206,002 $ 356,748 $427,000 $ 455,000 - $ 481,500<br />
Table of Reconciliation from GAAP Operating Income (Loss) to Non-GAAP Operating Income<br />
GAAP operating income (loss) $ 4,112 $ (47,139) $ (114,607) $ (42,000) - $ (10,000) $ 49,000 - $ 85,000<br />
Revenue adjustments related to acquisitions -<br />
- 37,254<br />
6,000<br />
-<br />
-<br />
Amortization and impairment of acquired technology and backlog 5,017 7,664 8,018<br />
9,000<br />
9,000 - 7,000<br />
Amortization of other acquired intangible assets 1,337 3,164 19,668<br />
25,000<br />
23,000 - 21,000<br />
Settlement with OCS - 19,158 -<br />
-<br />
-<br />
-<br />
Impairments of goodwill and other acquired intangible assets - 21,103 22,934 46,000 - 14,000 -<br />
-<br />
In-process research and development 2,852 - 6,682<br />
-<br />
-<br />
-<br />
Integration costs -<br />
- 10,980<br />
1,000<br />
-<br />
-<br />
Restructuring costs -<br />
- 3,308<br />
8,000<br />
-<br />
-<br />
Other legal costs (recoveries) 2,554 - 8,708<br />
(4,000)<br />
-<br />
-<br />
Stock-based compensation 1,187 18,791 31,061<br />
38,000<br />
45,000 - 43,000<br />
Expenses related to our restatement and extended filing delay 26 3,656 41,422<br />
29,000<br />
49,000 - 46,000<br />
Gain on sale of land -<br />
(765) -<br />
-<br />
-<br />
-<br />
Non-GAAP operating income $ 17,085 $ 25,632 $ 75,428 $116,000 $ 175,000 - $ 202,000<br />
Table of Reconciliation from GAAP Other Income (Expense), net to Non-GAAP Other Income (Expense), net<br />
GAAP other income (expense), net $ 7,995 $ 7,796 $ (55,347)<br />
Unrealized gains and losses on investments and derivatives -<br />
- 26,703 #REF! #REF! #REF! #REF!<br />
Non-GAAP other income (expense), net $ 7,995 $ 7,796 $ (28,644) #REF! #REF! #REF! #REF!<br />
Table of Reconciliation from GAAP Tax Provision to Non-GAAP Tax Provision<br />
GAAP tax provision $ 9,625 $ 141 $ 27,333<br />
Non-cash tax adjustments (5,436) 3,182 (23,220) #REF! #REF! #REF! #REF!<br />
Non-GAAP tax provision $ 4,189 $ 3,323 $ 4,113 #REF! #REF! #REF! #REF!<br />
Table of Reconciliation from GAAP Net Income (Loss) Available to Common Shares to Non-GAAP Net Income Available to Common Shares<br />
GAAP net income (loss) available to common shares $ 1,664 $ (40,405) $ (207,032) #REF! #REF! #REF! #REF!<br />
Revenue adjustments related to acquisitions -<br />
- 37,254 6,000 -<br />
-<br />
-<br />
Amortization and impairment of acquired technology and backlog 5,017 7,664 8,018 9,000 - 9,000 7,000<br />
Amortization of other acquired intangible assets 1,337 3,164 19,668<br />
Settlement with OCS - 19,158 -<br />
Impairments of goodwill and other acquired intangible assets - 21,103 22,934 46,000 14,000 -<br />
-<br />
In-process research and development 2,852 - 6,682 -<br />
-<br />
-<br />
-<br />
Integration costs -<br />
- 10,980 1,000 -<br />
-<br />
-<br />
Restructuring costs -<br />
- 3,308 8,000 -<br />
-<br />
-<br />
Other legal costs 2,554 - 8,708 (4,000) -<br />
-<br />
-<br />
Stock-based compensation 1,187 18,791 31,061 38,000 - 45,000 43,000<br />
Expenses related to our restatement and extended filing delay 26 3,656 41,422 29,000 - 49,000 46,000<br />
Gain on sale of land -<br />
(765) -<br />
-<br />
-<br />
-<br />
-<br />
Unrealized gains and losses on investments and derivatives -<br />
- 26,703 #REF! #REF! #REF! #REF!<br />
Non-cash tax adjustments 5,436 (3,182) 23,220 #REF! #REF! #REF! #REF!<br />
Non-GAAP net income available to common shares $ 20,073 $ 29,184 $ 32,926 #REF! #REF! #REF! #REF!<br />
Table Comparing GAAP Diluted Net Income (Loss) Per Share to Non-GAAP Net Income Per Share<br />
GAAP diluted net income (loss) per share $ 0.05 $ (1.26) $ (6.43) $ (2.35) $ (2.35) $ (2.35) $ (2.35)<br />
Non-GAAP diluted net income per share $ 0.62 $ 0.88 $ 1.00 $ 1.14 $ 1.14 $ 1.14 $ 1.14<br />
Shares used in computing US GAAP diluted net income (loss) per share (in thousands) 32,620 32,156 32,221 32,381 32,381 32,381 32,381<br />
Shares used in computing non-GAAP diluted net income per share (in thousands) 32,620 32,979 33,035 32,996 32,996 32,996 32,996<br />
(1) January 31, 2010 range excludes potential special charges such as impairments of goodwill and other acquired intangible assets because we have not yet performed the impairment testing for<br />
that period.<br />
8
Table 4<br />
<strong>Verint</strong> Systems Inc. and Subsidiaries<br />
<strong>Unaudited</strong> GAAP and Non-GAAP Segment Revenue<br />
(In thousands)<br />
NOTE: The information presented below is unaudited and subject to adjustments. These adjustments could be significant.<br />
For the Years Ended January 31,<br />
2006 2007 2008 2009<br />
2010<br />
Preliminary Preliminary Range<br />
GAAP Revenue By Segment<br />
Enterprise Workforce Optimization Segment $ 68,500 $ 125,982 $ 260,938 $ 347,000 $ 357,000 - $ 373,000<br />
Video Intelligence Segment 102,225 122,681 147,225 127,000 140,000 - 146,000<br />
Communications Intelligence and Investigative Segment 108,029 120,115 126,380 190,000 183,000 - 191,000<br />
Total Video and Communications Intelligence 210,254 242,796 273,605 317,000 323,000 - 337,000<br />
GAAP Total Revenue $ 278,754 $ 368,778 $ 534,543 $ 664,000 $ 680,000 - $ 710,000<br />
Revenue adjustments related to acquisitions $ - $ - $ 37,254 $ 6,000 $ - $ -<br />
Non-GAAP Revenue By Segment<br />
Enterprise Workforce Optimization Segment $ 68,500 $ 125,982 $ 298,192 $ 353,000 $ 357,000 - $ 373,000<br />
Video Intelligence Segment 102,225 122,681 147,225 127,000 140,000 - 146,000<br />
Communications Intelligence and Investigative Segment 108,029 120,115 126,380 190,000 183,000 - 191,000<br />
Total Video and Communications Intelligence 210,254 242,796 273,605 317,000 323,000 - 337,000<br />
Non-GAAP Total Revenue $ 278,754 $ 368,778 $ 571,797 $ 670,000 $ 680,000 - $ 710,000<br />
9
<strong>Verint</strong> Systems Inc. and Subsidiaries<br />
Supplemental <strong>Information</strong> About Non-GAAP Measures<br />
This press release contains non-GAAP measures. Tables 3 and 4 include a reconciliation of each non-GAAP financial<br />
measure presented in this press release to the most directly comparable financial measure prepared in accordance with<br />
Generally Accepted Accounting Principles (“GAAP”). Non-GAAP measures should not be considered in isolation or as a<br />
substitute for comparable measures of financial performance prepared in accordance with GAAP. We believe that the<br />
non-GAAP measures we present have limitations in that they do not reflect all of the amounts associated with our results<br />
of operations as determined in accordance with GAAP and that these measures should only be used to evaluate our<br />
results of operations in conjunction with the corresponding GAAP measures.<br />
We believe that the non-GAAP measures presented in the press release provide meaningful supplemental information<br />
regarding <strong>Verint</strong>’s operating results primarily because they exclude non-cash charges or items that we do not consider<br />
part of ongoing operating results when planning and forecasting and when assessing the performance of our business,<br />
with our individual operating segments or our senior management. We believe that our non-GAAP measures also facilitate<br />
the comparison by management and investors of results between periods and among our peer companies.<br />
As set forth in Table 3, our non-GAAP measures reflect adjustments to the corresponding GAAP measure based on the<br />
items set forth below. The purpose of these adjustments is to give an indication of our performance exclusive of certain<br />
non-cash charges and other items that are considered by our senior management to be outside of our ongoing operating<br />
results.<br />
Acquisition Related Adjustments<br />
Acquisition related adjustments include (i) revenue adjustments related to acquisitions, (ii) amortization of acquisitionrelated<br />
intangibles, (iii) integration costs, (iv) acquisition related write-downs, (v) in-process research and development<br />
and (vi) impairment of goodwill and intangible assets. These adjustments are discussed below.<br />
Revenue adjustments related to acquisitions. We exclude from our non-GAAP revenue the impact of fair value<br />
adjustments required under GAAP relating to acquired customer support contracts which would have otherwise been<br />
recognized on a standalone basis. We also exclude certain sales concession adjustments associated with acquisitions,<br />
relating to accounts receivable balances that existed prior to the acquisition date. We exclude these adjustments from our<br />
non-GAAP measures because these are not reflective of our ongoing operations.<br />
Amortization of acquisition-related intangibles. When we acquire an entity, we are required under GAAP to record the fair<br />
values of the intangible assets of the acquired entity and amortize them over their useful lives. We exclude the<br />
amortization of acquisition-related intangibles from our non-GAAP measures. These expenses are excluded from our<br />
non-GAAP measures because they are non-cash charges. In addition, these amounts are inconsistent in amount and<br />
frequency and are significantly impacted by the timing and size of acquisitions. Thus, we also exclude these amounts to<br />
provide better comparability of pre- and post-acquisition operating results.<br />
Integration costs. We exclude from our non-GAAP measures expenses directly related to the integration of acquired<br />
entities. These expenses are excluded from our non-GAAP measures because they are not reflective of our ongoing<br />
operations.<br />
In-process research and development. We exclude from our non-GAAP measures the fair value of in-process research<br />
and development upon the date of an acquisition, which represents incomplete research and development projects that<br />
had not yet reached technological feasibility and have no known alternative future use as of the date of the acquisition.<br />
These expenses are excluded from our non-GAAP measures because they are non-cash charges.<br />
Impairment of goodwill and intangible assets. Goodwill represents the excess of the purchase price in a business<br />
combination over the fair value of net tangible and identifiable intangible assets acquired. We exclude from our non-<br />
GAAP measures charges relating to impairment of goodwill and acquired identifiable intangible assets. These expenses<br />
are excluded from our non-GAAP measures because they are non-cash charges.<br />
Other legal costs and settlement income. We exclude from our non-GAAP measures other legal fees and settlements<br />
associated with certain intellectual property inherited from acquisitions and certain other litigation unrelated to<br />
acquisitions. We excluded these items from our non-GAAP results because they are not reflective of our ongoing<br />
operations.<br />
10
Other Adjustments<br />
Stock-based compensation expenses. We exclude stock-based compensation expenses related to stock options,<br />
restricted stock awards and units and phantom stock from our non-GAAP measures. These expenses are excluded from<br />
our non-GAAP measures because they are predominately non-cash charges.<br />
Expenses related to our restatement and extended filing delay. We exclude from our non-GAAP measures expenses<br />
associated with our restatement of previously filed financial statements and our extended filing delay. These expenses<br />
included professional fees and related expenses as well as expenses associated with a special cash retention program.<br />
These expenses are excluded from our non-GAAP measures because they are not reflective of our ongoing operations.<br />
Restructuring costs. We exclude from our non-GAAP measures expense associated with the restructuring of our<br />
operations due to internal or external market factors. These expenses are excluded from our non-GAAP measures<br />
because they are not reflective of our ongoing operations.<br />
OCS settlement. In the year ended January 31, 2007, we recorded a charge related to our July 31, 2006 settlement with<br />
the Office of Chief Scientist in Israel (“OCS”), pursuant to which we exited a royalty-bearing program and the OCS<br />
accepted a settlement of our royalty obligations under this program. We exclude from our non-GAAP financial results<br />
expenses associated with exiting this program because they are not reflective of our ongoing operations.<br />
Gain on sale of land. We exclude from our non-GAAP financial measures the gain from the sale of a parcel of land. This<br />
gain is excluded from our non-GAAP measures because it is not reflective of our ongoing operations.<br />
Unrealized gains and losses on investments and derivatives. We exclude from our non-GAAP measures investment<br />
write-down in auction rate securities and unrealized gain/(loss) on embedded derivatives, interest rate swaps, and foreign<br />
currency derivatives. These gains/(expenses) are excluded from our non-GAAP measures because they are non-cash<br />
gains/(charges).<br />
11