Verint Announces Selected Unaudited Financial Information
Verint Announces Selected Unaudited Financial Information
Verint Announces Selected Unaudited Financial Information

Create successful ePaper yourself
Turn your PDF publications into a flip-book with our unique Google optimized e-Paper software.
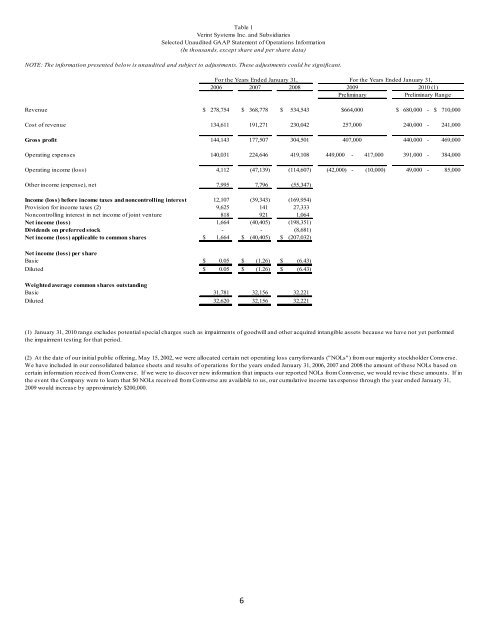
For the Years Ended January 31,<br />
2006 2007 2008<br />
Revenue $ 278,754 $ 368,778 $ 534,543<br />
$664,000<br />
$ 680,000 - $ 710,000<br />
Cost of revenue 134,611<br />
Gross profit 144,143<br />
Operating expenses 140,031<br />
Operating income (loss) 4,112<br />
Other income (expense), net 7,995<br />
6<br />
191,271<br />
177,507<br />
224,646<br />
(47,139)<br />
7,796<br />
230,042<br />
304,501<br />
419,108<br />
(114,607)<br />
(55,347)<br />
449,000<br />
(42,000)<br />
(45,682)<br />
Income (loss) before income taxes and noncontrolling interest 12,107 (39,343) (169,954) #VALUE!<br />
Provision for income taxes (2) 9,625 141 27,333 (3,085)<br />
Noncontrolling interest in net income of joint venture 818 921 1,064<br />
Net income (loss) 1,664 (40,405) (198,351) #VALUE!<br />
Dividends on preferred stock -<br />
-<br />
(8,681) (11,894)<br />
Net income (loss) applicable to common shares $ 1,664 $ (40,405) $ (207,032) #VALUE!<br />
Net income (loss) per share<br />
Basic $ 0.05 $ (1.26) $ (6.43) #REF!<br />
Diluted $ 0.05 $ (1.26) $ (6.43) #REF!<br />
Weighted average common shares outstanding<br />
Basic 31,781<br />
Diluted 32,620<br />
Table 1<br />
<strong>Verint</strong> Systems Inc. and Subsidiaries<br />
<strong>Selected</strong> <strong>Unaudited</strong> GAAP Statement of Operations <strong>Information</strong><br />
(In thousands, except share and per share data)<br />
NOTE: The information presented below is unaudited and subject to adjustments. These adjustments could be significant.<br />
32,156<br />
32,156<br />
32,221<br />
32,221<br />
#REF!<br />
#REF!<br />
For the Years Ended January 31,<br />
2009<br />
2010 (1)<br />
Preliminary<br />
Preliminary Range<br />
257,000<br />
- 417,000<br />
- (10,000)<br />
240,000<br />
440,000<br />
391,000<br />
49,000<br />
- 241,000<br />
- 469,000<br />
- 384,000<br />
- 85,000<br />
(1) January 31, 2010 range excludes potential special charges such as impairments of goodwill and other acquired intangible assets because we have not yet performed<br />
the impairment testing for that period.<br />
(2) At the date of our initial public offering, May 15, 2002, we were allocated certain net operating loss carryforwards ("NOLs") from our majority stockholder Comverse.<br />
We have included in our consolidated balance sheets and results of operations for the years ended January 31, 2006, 2007 and 2008 the amount of these NOLs based on<br />
certain information received from Comverse. If we were to discover new information that impacts our reported NOLs from Comverse, we would revise these amounts. If in<br />
the event the Company were to learn that $0 NOLs received from Comverse are available to us, our cumulative income tax expense through the year ended January 31,<br />
2009 would increase by approximately $200,000.<br />
407,000