Table 3 <strong>Verint</strong> Systems Inc. and Subsidiaries Reconciliation of <strong>Unaudited</strong> GAAP to Non-GAAP Results (In thousands, except per share data) NOTE: The information presented below is unaudited and subject to adjustments. These adjustments could be significant. For the Years Ended January 31, For the Years Ended January 31, 2006 2007 2008 2009 2010 (1) Preliminary Preliminary Range Table of Reconciliation from GAAP Revenue to Non-GAAP Revenue GAAP revenue $ 278,754 $ 368,778 $ 534,543 $664,000 $ 680,000 - $ 710,000 Revenue adjustments related to acquisitions - - 37,254 6,000 - - Non-GAAP revenue $ 278,754 $ 368,778 $ 571,797 $670,000 $ 680,000 - $ 710,000 Table of Reconciliation from GAAP Gross Profit to Non-GAAP Gross Profit GAAP gross profit $ 144,143 $ 177,507 $ 304,501 $407,000 $ 440,000 - $ 469,000 Revenue adjustments related to acquisitions - - 37,254 6,000 - - Amortization and impairment of acquired technology and backlog 5,017 7,664 8,018 9,000 9,000 - 7,000 Settlement with OCS - 19,158 - - - - Stock-based compensation 11 1,673 4,548 5,000 6,000 - 5,500 Expenses related to our restatement and extended filing delay - - 2,427 - - - Non-GAAP gross profit $ 149,171 $ 206,002 $ 356,748 $427,000 $ 455,000 - $ 481,500 Table of Reconciliation from GAAP Operating Income (Loss) to Non-GAAP Operating Income GAAP operating income (loss) $ 4,112 $ (47,139) $ (114,607) $ (42,000) - $ (10,000) $ 49,000 - $ 85,000 Revenue adjustments related to acquisitions - - 37,254 6,000 - - Amortization and impairment of acquired technology and backlog 5,017 7,664 8,018 9,000 9,000 - 7,000 Amortization of other acquired intangible assets 1,337 3,164 19,668 25,000 23,000 - 21,000 Settlement with OCS - 19,158 - - - - Impairments of goodwill and other acquired intangible assets - 21,103 22,934 46,000 - 14,000 - - In-process research and development 2,852 - 6,682 - - - Integration costs - - 10,980 1,000 - - Restructuring costs - - 3,308 8,000 - - Other legal costs (recoveries) 2,554 - 8,708 (4,000) - - Stock-based compensation 1,187 18,791 31,061 38,000 45,000 - 43,000 Expenses related to our restatement and extended filing delay 26 3,656 41,422 29,000 49,000 - 46,000 Gain on sale of land - (765) - - - - Non-GAAP operating income $ 17,085 $ 25,632 $ 75,428 $116,000 $ 175,000 - $ 202,000 Table of Reconciliation from GAAP Other Income (Expense), net to Non-GAAP Other Income (Expense), net GAAP other income (expense), net $ 7,995 $ 7,796 $ (55,347) Unrealized gains and losses on investments and derivatives - - 26,703 #REF! #REF! #REF! #REF! Non-GAAP other income (expense), net $ 7,995 $ 7,796 $ (28,644) #REF! #REF! #REF! #REF! Table of Reconciliation from GAAP Tax Provision to Non-GAAP Tax Provision GAAP tax provision $ 9,625 $ 141 $ 27,333 Non-cash tax adjustments (5,436) 3,182 (23,220) #REF! #REF! #REF! #REF! Non-GAAP tax provision $ 4,189 $ 3,323 $ 4,113 #REF! #REF! #REF! #REF! Table of Reconciliation from GAAP Net Income (Loss) Available to Common Shares to Non-GAAP Net Income Available to Common Shares GAAP net income (loss) available to common shares $ 1,664 $ (40,405) $ (207,032) #REF! #REF! #REF! #REF! Revenue adjustments related to acquisitions - - 37,254 6,000 - - - Amortization and impairment of acquired technology and backlog 5,017 7,664 8,018 9,000 - 9,000 7,000 Amortization of other acquired intangible assets 1,337 3,164 19,668 Settlement with OCS - 19,158 - Impairments of goodwill and other acquired intangible assets - 21,103 22,934 46,000 14,000 - - In-process research and development 2,852 - 6,682 - - - - Integration costs - - 10,980 1,000 - - - Restructuring costs - - 3,308 8,000 - - - Other legal costs 2,554 - 8,708 (4,000) - - - Stock-based compensation 1,187 18,791 31,061 38,000 - 45,000 43,000 Expenses related to our restatement and extended filing delay 26 3,656 41,422 29,000 - 49,000 46,000 Gain on sale of land - (765) - - - - - Unrealized gains and losses on investments and derivatives - - 26,703 #REF! #REF! #REF! #REF! Non-cash tax adjustments 5,436 (3,182) 23,220 #REF! #REF! #REF! #REF! Non-GAAP net income available to common shares $ 20,073 $ 29,184 $ 32,926 #REF! #REF! #REF! #REF! Table Comparing GAAP Diluted Net Income (Loss) Per Share to Non-GAAP Net Income Per Share GAAP diluted net income (loss) per share $ 0.05 $ (1.26) $ (6.43) $ (2.35) $ (2.35) $ (2.35) $ (2.35) Non-GAAP diluted net income per share $ 0.62 $ 0.88 $ 1.00 $ 1.14 $ 1.14 $ 1.14 $ 1.14 Shares used in computing US GAAP diluted net income (loss) per share (in thousands) 32,620 32,156 32,221 32,381 32,381 32,381 32,381 Shares used in computing non-GAAP diluted net income per share (in thousands) 32,620 32,979 33,035 32,996 32,996 32,996 32,996 (1) January 31, 2010 range excludes potential special charges such as impairments of goodwill and other acquired intangible assets because we have not yet performed the impairment testing for that period. 8
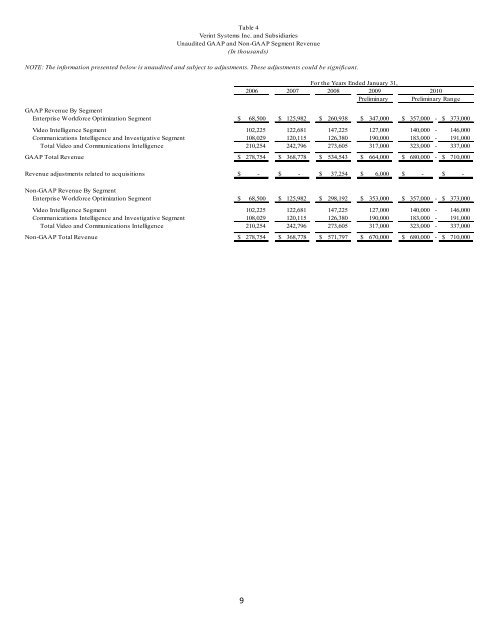
Table 4 <strong>Verint</strong> Systems Inc. and Subsidiaries <strong>Unaudited</strong> GAAP and Non-GAAP Segment Revenue (In thousands) NOTE: The information presented below is unaudited and subject to adjustments. These adjustments could be significant. For the Years Ended January 31, 2006 2007 2008 2009 2010 Preliminary Preliminary Range GAAP Revenue By Segment Enterprise Workforce Optimization Segment $ 68,500 $ 125,982 $ 260,938 $ 347,000 $ 357,000 - $ 373,000 Video Intelligence Segment 102,225 122,681 147,225 127,000 140,000 - 146,000 Communications Intelligence and Investigative Segment 108,029 120,115 126,380 190,000 183,000 - 191,000 Total Video and Communications Intelligence 210,254 242,796 273,605 317,000 323,000 - 337,000 GAAP Total Revenue $ 278,754 $ 368,778 $ 534,543 $ 664,000 $ 680,000 - $ 710,000 Revenue adjustments related to acquisitions $ - $ - $ 37,254 $ 6,000 $ - $ - Non-GAAP Revenue By Segment Enterprise Workforce Optimization Segment $ 68,500 $ 125,982 $ 298,192 $ 353,000 $ 357,000 - $ 373,000 Video Intelligence Segment 102,225 122,681 147,225 127,000 140,000 - 146,000 Communications Intelligence and Investigative Segment 108,029 120,115 126,380 190,000 183,000 - 191,000 Total Video and Communications Intelligence 210,254 242,796 273,605 317,000 323,000 - 337,000 Non-GAAP Total Revenue $ 278,754 $ 368,778 $ 571,797 $ 670,000 $ 680,000 - $ 710,000 9