PDF (5143 kByte) - WIAS
PDF (5143 kByte) - WIAS
PDF (5143 kByte) - WIAS

Create successful ePaper yourself
Turn your PDF publications into a flip-book with our unique Google optimized e-Paper software.
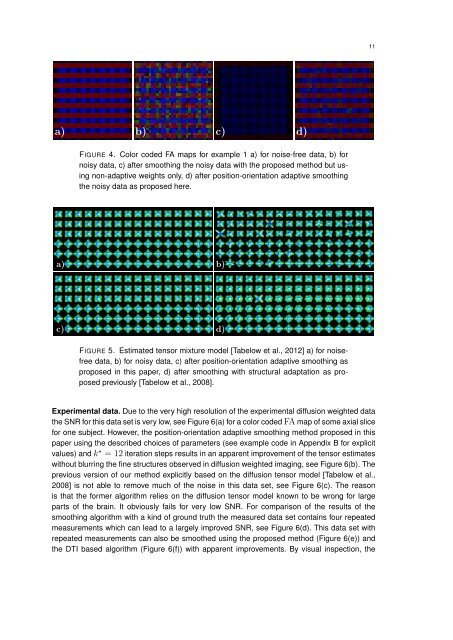
a) b) c) d)<br />
FIGURE 4. Color coded FA maps for example 1 a) for noise-free data, b) for<br />
noisy data, c) after smoothing the noisy data with the proposed method but using<br />
non-adaptive weights only, d) after position-orientation adaptive smoothing<br />
the noisy data as proposed here.<br />
a) b)<br />
c) d)<br />
FIGURE 5. Estimated tensor mixture model [Tabelow et al., 2012] a) for noisefree<br />
data, b) for noisy data, c) after position-orientation adaptive smoothing as<br />
proposed in this paper, d) after smoothing with structural adaptation as proposed<br />
previously [Tabelow et al., 2008].<br />
Experimental data. Due to the very high resolution of the experimental diffusion weighted data<br />
the SNR for this data set is very low, see Figure 6(a) for a color coded FA map of some axial slice<br />
for one subject. However, the position-orientation adaptive smoothing method proposed in this<br />
paper using the described choices of parameters (see example code in Appendix B for explicit<br />
values) and k ⋆ = 12 iteration steps results in an apparent improvement of the tensor estimates<br />
without blurring the fine structures observed in diffusion weighted imaging, see Figure 6(b). The<br />
previous version of our method explicitly based on the diffusion tensor model [Tabelow et al.,<br />
2008] is not able to remove much of the noise in this data set, see Figure 6(c). The reason<br />
is that the former algorithm relies on the diffusion tensor model known to be wrong for large<br />
parts of the brain. It obviously fails for very low SNR. For comparison of the results of the<br />
smoothing algorithm with a kind of ground truth the measured data set contains four repeated<br />
measurements which can lead to a largely improved SNR, see Figure 6(d). This data set with<br />
repeated measurements can also be smoothed using the proposed method (Figure 6(e)) and<br />
the DTI based algorithm (Figure 6(f)) with apparent improvements. By visual inspection, the<br />
11