STEERING WHEEL BEHAVIOR BASED ESTIMATION OF FATIGUE ...
STEERING WHEEL BEHAVIOR BASED ESTIMATION OF FATIGUE ...
STEERING WHEEL BEHAVIOR BASED ESTIMATION OF FATIGUE ...

Create successful ePaper yourself
Turn your PDF publications into a flip-book with our unique Google optimized e-Paper software.
PROCEEDINGS of the Fifth International Driving Symposium on Human Factors in Driver Assessment, Training and Vehicle Design<br />
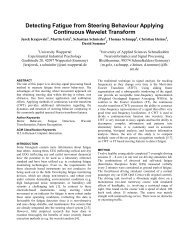
<strong>STEERING</strong> <strong>WHEEL</strong> <strong>BEHAVIOR</strong> <strong>BASED</strong> <strong>ESTIMATION</strong> <strong>OF</strong> <strong>FATIGUE</strong><br />
Jarek Krajewski 1 , David Sommer 2 , Udo Trutschel 3 , Dave Edwards 4 & Martin Golz 2<br />
1 Experimental Business Psychology<br />
University of Wuppertal, Germany<br />
2 Faculty of Computer Science, University of Applied Sciences<br />
Schmalkalden, Germany<br />
3 Circadian Technologies Inc.<br />
Stoneham, MA, USA<br />
4 Product Safety & Compliance, Caterpillar Inc.<br />
Peoria, IL, USA<br />
Email: krajewsk@uni-wuppertal.de<br />
Summary: This paper examined a steering behavior based fatigue monitoring<br />
system. The advantages of using steering behavior for detecting fatigue are that<br />
these systems measure continuously, cheaply, non-intrusively, and robustly even<br />
under extremely demanding environmental conditions. The expected fatigue<br />
induced changes in steering behavior are a pattern of slow drifting and fast<br />
corrective counter steering. Using advanced signal processing procedures for<br />
feature extraction, we computed 3 feature set in the time, frequency and state<br />
space domain (a total number of 1251 features) to capture fatigue impaired<br />
steering patterns. Each feature set was separately fed into 5 machine learning<br />
methods (e.g. Support Vector Machine, K-Nearest Neighbor). The outputs of each<br />
single classifier were combined to an ensemble classification value. Finally we<br />
combined the ensemble values of 3 feature subsets to a of meta-ensemble<br />
classification value. To validate the steering behavior analysis, driving samples<br />
are taken from a driving simulator during a sleep deprivation study (N=12). We<br />
yielded a recognition rate of 86.1% in classifying slight from strong fatigue.<br />
INTRODUCTION<br />
Determining driver fatigue through the analysis of biosignals poses great challenges. Not all<br />
biosignals demonstrate fatigue based changes to the same degree. Some biosignals contain more<br />
information about fatigue than others. Among them, EEG (reflecting cortical activity) and EOG<br />
(reflecting eye and eyelid movement dynamics) have the potential to be used as a laboratory<br />
reference standard and have been utilized e.g. in evaluating fatigue monitoring technologies (e.g.<br />
Golz, Sommer, Holzbrecher & Schnupp, 2007; Sommer, Golz & Krajewski, 2008). Even so, the<br />
requirements for these electrode based instruments are not conducive for being used out in the<br />
field. The major drawbacks are a lack of robustness against various environmental conditions<br />
(e.g. high humidity or temperature) and a lack of comfort and longevity due to electrode sensor<br />
application. In contrast to these electrode-based instruments, using steering wheel movement as<br />
an indicator for fatigue is more robust under these same operating conditions. Collecting this<br />
data is favourable for fatigue detection since it is non-obtrusive and uses cheap, durable, and<br />
maintenance free sensors that are already integrated into the steering wheel system.<br />
The present paper will describe a steering behavior based approach to estimate a driver’s level of<br />
fatigue. It is organized as follows: Section 2 discusses how steering behavior based measures are<br />
118
PROCEEDINGS of the Fifth International Driving Symposium on Human Factors in Driver Assessment, Training and Vehicle Design<br />
correlates to fatigue. In Section 3 the procedure of computing features from time, frequency and<br />
state space is explained. Section 4 explains the design of the sleep deprivation study used for<br />
building a fatigue driver database. Having provided the results of the fatigue detection in Section<br />
5, the paper closes with a conclusion and a discussion of the future work in Section 6.<br />
<strong>FATIGUE</strong> INDUCED EFFECTS ON <strong>STEERING</strong> <strong>BEHAVIOR</strong><br />
In general, steering behavior is influenced by characteristics of the driving task (e.g. speed,<br />
curvature, and lane width), driver traits (e.g. driving experience), and driver states (e.g. laxness,<br />
distraction or fatigue). Drivers are constantly judging the situation ahead and applying small,<br />
smooth, steering adjustments to correct for small road bumps and crosswinds by turning the<br />
steering wheel in small increments. This steering behavior can be impaired when drivers are<br />
becoming fatigued. A wide variety of steering wheel metrics have been suggested to measure<br />
steering behavior, from standard deviation of steering wheel angle (e.g. Liu, Schreiner & Dingus,<br />
1999), steering wheel velocity (Peters, Kloeppel & Alicandri, 1999; Skipper, Wierwille &<br />
Hardee, 1984), steering wheel action rate (McDonald & Hoffman, 1980; Verwey, 2000), to more<br />
advanced metrics such as high frequency component of steering wheel angle (Östlund et al.,<br />
2004) and steering entropy (e.g. Godrich et al., 2004; Nakayama, Futami, Nakamura & Boer,<br />
1999; Siegmund, King & Mumford, 1996). Fatigue-induced effects on steering behavior could<br />
be summarized follows: less small, smooth steering adjustments (micro-corrections), more<br />
zigzag and slow oscillation, greater steering entropy (measure of steering randomness), larger<br />
erratic steering movements (indicating e.g. overcorrecting for unanticipated road changes),<br />
lateral drift outside the driver’s comfort zone, more large and fast steering corrections (Paul et<br />
al., 2006; van der Hulst, Meijman, & Rothengatter, 2001).<br />
Until recently, the analysis of steering wheel movement was based on finding single features<br />
correlating with fatigue. The detection task was reduced to a simple thresholding of these<br />
features, but large inter- and intra-individual differences in fatigued driving patterns are an issue.<br />
Due to this overwhelming complexity, a sufficient and accurate classification of individual<br />
steering samples was not achieved. Thus, we propose a multivariate, data fusion, and machine<br />
learning based approach including the computation of a large, highly redundant feature set<br />
modelling fine grained temporal steering behavior structures (cf. Sayed & Eskandarian, 2001).<br />
This approach showed its superiority in many pattern recognition tasks (e.g. Ruvolo, &<br />
Movellan, 2008).<br />
FEATURE EXTRACTION FOR <strong>STEERING</strong> <strong>BEHAVIOR</strong><br />
Features of steering wheel movement can be divided into time, frequency and state space<br />
domains. This assignment follows the first processing step of computing frame level descriptors,<br />
independent of feature characteristics of the second, contour describing, functional based<br />
processing step.<br />
(a) time domain features<br />
Within the time domain the following features can be extracted: regression descriptors (e.g.<br />
regression slope, intercept, maximum of regression error), class distribution measures (e.g.<br />
number of values within steering angle bin 0.0-0.1), peak amplitudes and distances (e.g. mean<br />
119
PROCEEDINGS of the Fifth International Driving Symposium on Human Factors in Driver Assessment, Training and Vehicle Design<br />
distance of peaks; maximum of peak amplitude), entropy, zero crossing distances and slope (e.g.<br />
maximum of distance between consecutive zero crossings; mean velocity of steering angle in<br />
zero crossings)<br />
(b) frequency domain features<br />
To capture fine temporal changes of spectral descriptors we performed a framing and windowing<br />
of the signal (frame size = 512, frame shift = 256, hanning window), and computed the power<br />
spectral density per frame. The resulting frame-level descriptors (FLDs) were aggregated to<br />
FLD-contours. The next processing step captures temporal information of the FLD contours by<br />
computing functionals. Frequently used functionals are percentiles (quartiles, quartile ranges,<br />
and other percentiles), extremes (min/max value, min/max position, range), distributional<br />
functions (number of segments/ intervals/reversal points), spectral functionals (DCT<br />
coefficients), regression functions (intercept, error, regression coefficients), higher statistical<br />
moments (standard deviation, skewness, kurtosis, and zerocrossing-rate), means (arithmetic<br />
mean and centroid). This procedure of combining FLDs and functionals results in 803 frequency<br />
domain features as e.g.: relative and absolute power spectral density (PSD) of raw and first<br />
derivate contours in 30 spectral bands (e.g. minimum of relative PSD of first derivate of 0.6-<br />
0.7Hz spectral band contour), band energy ratios (PSD 1-5hz/ PSD 0-1hz), spectral flux (e.g.<br />
max of spectral flux = Euclidean distance of PSD between consecutive frames), and long term<br />
average spectrum descriptors (e.g. skewness of PSD distribution).<br />
(c) state space<br />
To extract the nonlinear properties of the steering angle signal, we computed a three-dimensional<br />
state space (steering wheel position, steering wheel velocity, steering wheel acceleration), and a<br />
reconstructed phase space (d = 3,4 ; = 1; steering angle t0, steering angle t1, steering angle t2).<br />
The geometrical properties of the resulting attractor figures were described by trajectory based<br />
descriptor contours (angle between consecutive trajectory parts, distance to centroid of attractor,<br />
length of trajectory leg). The temporal information of the contours was captured by computing<br />
functionals.<br />
METHOD<br />
Subjects, Instruments, and Experimental Procedure. Twelve participants took part in this study<br />
voluntarily. Initial screening excluded those having severe sleep disorders or sleep difficulties.<br />
The participants were instructed to maintain their normal sleep pattern and behavior. We<br />
conducted a within-subject sleep deprivation design (01.00 - 08.00 a.m). During the driving<br />
sessions a well established, standardized self-report fatigue measure, the Karolinska Fatigue<br />
Scale (KSS), was used orally by the subjects and 2 experimental assistants every 4 min. In the<br />
version used in the present study, scores range from ‘extremely alert’ to ‘extremely sleepy, can’t<br />
stay awake’. Given the verbal descriptions, scores of 8 and higher appear to be most relevant<br />
from a practical perspective as they describe a state in which the subject feels unable to keep stay<br />
awake.<br />
During the night, the subjects were confined to the laboratory, conducting a driving simulator<br />
task and were supervised throughout the whole period. The driving simulation software system<br />
has been developed by the Department of Computer Science, Univ. of Applied Sciences<br />
120
PROCEEDINGS of the Fifth International Driving Symposium on Human Factors in Driver Assessment, Training and Vehicle Design<br />
Schmalkalden, Germany. The fixed-based driving simulator consisted of a normal passenger city<br />
car (GM Opel Corsa) with original controls. The driving task involved a 40-minute night drive<br />
on a monotonous two-lane motorway course with simulated effects of headlights, i.e. involving a<br />
restricted range of sight. One round on the course with a speed of about 100 km/h took about 15<br />
minutes. The course was mainly straight with sustained long curves. There were no obstacles or<br />
oncoming traffic.<br />
Driving data and Feature Extraction. We conducted a validation experiment to examine whether<br />
automatically trained models can be used to recognise the fatigue of subjects. Our approach can<br />
be summarized in four steps: 1. Collect individual steering data and the associated fatigue ratings<br />
for each participant; 2. Extract relevant features from the steering data; 3. Build statistical models<br />
of the fatigue ratings based on the features; 4. Test the learned models on unseen steering data.<br />
The collection of data took place in a nearly dark laboratory room (sampling rate: 20 Hz).<br />
Furthermore the subjects were given sufficient prior practice so that they were not uncomfortable<br />
with this procedure. After elimination of values in the threshold region (7.5 ± 0.5 KSS) the<br />
binarization of the fatigue values leads to two classes: non-strong fatigue (KSS ≤ 7; Non-SF) and<br />
strong fatigue (KSS ≥ 8; SF). The total number of 714 steering samples was split into 390<br />
samples of Non-SF and 324 samples of SF (KSS:= mean of one self-report and two observer<br />
report KSS-ratings; M= 7.06; SD= 1.99). To extract relevant features from the steering behavior<br />
data the data was split into segments 240 seconds in duration each for a total of 4800 data points<br />
per segment. As explained above, we estimated 88 time domain features, 803 frequency domain<br />
features, and 360 state space domain features. In sum, we computed a total amount of 1251<br />
features per driving segment including also the standard steering behavior features as variance of<br />
steering angle, high frequency component, steering reversal rate, steering wheel action rate, peak<br />
steering deflection, number of steering holds. The potential advantage of the brute-force feature<br />
extraction approach proposed here (large collection of simple, light weighted features) is that it<br />
could cover a broad range of possible steering phenomena related to fatigue.<br />
Pattern Recognition. To enhance robustness of the classification we feed these features<br />
separately into 5 sophisticated, but standard machine learning methods (support vector machine<br />
linear kernel (SVM_l) and radial kernel (SVM_r), 5- nearest neighbour (5-NN), decision tree<br />
(DT), and logistic regression (LR). By averaging the classification outputs, an ensemble<br />
classifier was created per each feature subset. In a last step the ensemble-classificator outputs<br />
from the feature subsets (time, frequency and state space) were combined (averaged and<br />
dichotomized) to a final fatigue prediction value.<br />
V. RESULTS<br />
The raw steering angle signal, spectrogram, and state space plot in Figure 1 provide a first insight<br />
into possible fatigue sensitive steering features. In the fatigued driver the raw steering wheel<br />
position and velocity signal show the following correlations to fatigue: (a) time domain features:<br />
rmean peak amplitude – KSS = .59, r90th percentile – KSS = .57, rmean absolute deviation of steering velocity – KSS = .52 (see<br />
Fig. 1 top row), (b) frequency domain features: rmedian spectral flux – KSS = .59, rmedian spectral flux of steering<br />
velocity – KSS = .59, rinterquartile range of PSD in frequency band 1-3 Hz – KSS = .55 (see Fig. 1 mid row), and (c)<br />
state spece domain: r95th percentile of distance to centroid of attractor (time lag = 1 = 1, embedded dimension = 4) – KSS = .55,<br />
121
PROCEEDINGS of the Fifth International Driving Symposium on Human Factors in Driver Assessment, Training and Vehicle Design<br />
r95th percentile of distance to centroid of attractor (time lag = 1 = 1, embedded dimension = 3) – KSS = .54, , rmean distance to centroid of<br />
attractor (time lag = 1 = 1, embedded dimension = 3) – KSS = .50 (see Fig. 1 bottom row).<br />
Figure 1. Steering angle signal, spectrogram and state space trajectory of non-strong fatigue (Non-SF) and<br />
strong fatigue (SF) driver. High power spectral densities (PSD) are coded white, low PSD are coloured grey<br />
within the spectrogram.<br />
Applying the above described ensemble classification method, this feature set achieved 86.1%<br />
recognition rate (RR; ratio correctly classified samples divided by all samples) and 85.4% classwise<br />
averaged classification rate (CL; average of sensitivity and specificity) in the classification<br />
of sleepy driver (sensitivity =77.4%; specificity 93.3%).<br />
Table 1. Class-wise averaged classification rates (CL), recognition rates (RR), sensitivity (SE), and specificity<br />
(SP) (in %) on the test set using 3 different feature subsets (# = number of features) and an ensembleclassifier<br />
(SVM_l, SVM_r, LR, DT, 5-NN).<br />
Feature Domains # CL RR SE SP<br />
Time 88 86.7 87.3 79.9 93.3<br />
Frequency 803 77.6 78.2 71.3 83.8<br />
State space 360 82.7 83.2 76.9 88.5<br />
Combine all 3 subsets 1251 85.4 86.1 77.4 93.3<br />
122
PROCEEDINGS of the Fifth International Driving Symposium on Human Factors in Driver Assessment, Training and Vehicle Design<br />
DISCUSSION<br />
Assessing driver fatigue using the steering wheel behavior analysis presented here yielded a<br />
recognition rate of 86.1%, which is among the highest values ever reached for a totally nonobtrusive<br />
system. The main findings referring to construction principles of this system may be<br />
summarized as following. First, the time frequency and state space domain features extracted<br />
from the driving simulator contains a substantial amount of information about the driver’s<br />
fatigue state. Our analyses documented that time domain feature subsets yielded the best<br />
classification results, which might be in part due to imbalanced feature set sizes. Using different<br />
wrapper based feature selection and weighting methods would probably provide a more detailed<br />
view on useful feature subsets. Secondly, we found that the early fusion of 5 standard classifiers<br />
increases robustness and the discriminative classification power. Furthermore, the final metaensemble<br />
classifier combining fatigue prediction of 3 feature subsets (time, frequency and state<br />
space domain) on unseen data but known driver enhanced robustness of the classification.<br />
Future research should address the topic of improving the fatigue monitoring by enriching the<br />
feature sets with information of lane deviation, time to lane crossing, and pedal movements.<br />
Furthermore, implementing separate fatigue prediction models for different driving tasks,<br />
geometrical road characteristics and environmental conditions (as e.g. speed, crosswind, streetgranularity,<br />
curvature, or lane width) might improve the general fatigue prediction accuracy.<br />
Another promising improvement could be realized by using driver state data as e.g. personal<br />
driving performance baselines for the personalization of the prediction models. Moreover<br />
considering various driver states could be useful, because it is likely that especially combinations<br />
of activation and arousal states might be responsible for intra-individual variance in fatigue<br />
steering patterns. When combining a low energetic activation state such as fatigue with high selfinduced<br />
(e.g. fighting against sleepiness) or external stressor-induced arousal (e.g. inner tension<br />
within high mental workload situations), the typical fatigue driving pattern might be masked. To<br />
handle this fact, explicit (for each internal state combination separately) or implicit (based on<br />
classifier immanent clustering) modelling is necessary. In both cases it is essential to feed the<br />
classifiers with sufficient learning data including these combinations of fatigue and arousal<br />
states.<br />
REFERENCES<br />
Golz, M., Sommer, D., Holzbrecher, M., & Schnupp, T. (2007). Detection and prediction of<br />
driver’s microsleep events. Proceedings Int Conf Road Safety on Four Continents, 14.<br />
Goodrich, M. A., Boer, E. R., Crandall, J. W., Ricks, R. W., & Quigley, M. L. (2004).<br />
Behavioral entropy in human-robot interaction. Proceedings of PERMIS, Gaithersburg,<br />
Maryland.<br />
Hulst, van der, M., Meijman, T., & Rothengatter, T. (2001). Maintaining task set under fatigue: a<br />
study of time-on-task effects in simulated driving. Transportation Research Part F, 4 (2), pp.<br />
103-118.<br />
Liu, Y.-C., Schreiner, C. S., & Dingus, T. S. (1990). Development of human factors guidelines<br />
for advacnced traveler information systems (ATIS) and commercial vehicle operation<br />
123
PROCEEDINGS of the Fifth International Driving Symposium on Human Factors in Driver Assessment, Training and Vehicle Design<br />
(CVO). Human Factors Evaluation of the Effectiveness of Multimodality Displays in ATIS.<br />
NHTSA FHWA-RD-96-150.<br />
McDonald, W. A., & Hoffman, E. R. (1980). Review of relationships between steering wheel<br />
reversal rate and driving task demand. Human Factors 22(6), 733-739.<br />
Nakayama, O., Futami, T., Nakamura, T., & Boer, E. R. (1999). Development of a<br />
steeringentropy method for evaluating driver workload. Proceeding SAE International<br />
Congress and Exposition, Detroit, Michigan, USA.<br />
Östlund, J., Nilsson, L., Carsten, O., Merat, N., Jamson, H, Jamson, S., Mouta, S., Carvalhais,<br />
J.,Santos, J., Anttila, V., Sandberg, H., Luoma, J., de Waard, D., Brookhuis, K., Johansson,<br />
E., Engström, J., Victor, T., Harbluk, J., Janssen, W., & Brouwer, R. (2004). Deliverable 2 -<br />
HMI and safety-related driver performance. Human Machine Interface And the Safety of<br />
Traffic in Europe. Project GRD1/2000/25361 S12.319626.<br />
Paul, A., Boyle, L., Boer, E. R., Tippin, J., & Rizzo, M. (2006). Steering entropy changes as a<br />
function of microsleeps. Proceedings of International Driving Symposium on Human Factors<br />
in Driver Assessment, Training and Vehicle Design, 3, 441-447.<br />
Peters, R. D., Kloeppel, E., & Alicandri, E. (1999). Effects of partial and total sleep deprivation<br />
on driving performance. US Department of Transportation, Federal Highway Administration<br />
(Eds), Publication No. FHWA-RD-94-046.<br />
Ruvolo, P., & Movellan, J. (2008). Automatic Cry Detection in Early Childhood Education<br />
Settings. IEEE International Conference on Development and Learning, 7, 204-208.<br />
Sayed, R., & Eskandarian, A. (2001). Unobtrusive drowsiness detection by neural network<br />
learning of driver steering, Proceedings of the Institution of Mechanical Engineers.Part D,<br />
Journal of Automobile Engineering, 215, 969-975.<br />
Siegmund, G. P., King, D. J., & Mumford, D. K. (1996). Correlation of steering behavior with<br />
heavy-truck driver fatigue. Society for Automotive Engineers Technical Report # 961683.<br />
Skipper, J. H., Wierwille, W. W., & Hardee, L. (1984). An investigation of low-level stimulusinduced<br />
measures of driver drowsiness. Vehicle Simulation Laboratory, Human Factors<br />
Group (Eds.). IEOR Department Report #8402. Virginia Polytechnic Institute and State<br />
University, Blacksburg, Virginia.<br />
Sommer, D., Golz, M., & Krajewski, J. (2008). Consecutive detection of driver's microsleep<br />
events. In J. Vander Sloten, P. Verdonck, M. Nyssen, J. Haueisen (Eds.), IFMBE<br />
Proceedings, 22, (pp. 243-247). Springer: Berlin.<br />
Verwey, W. B. (2000). On-line driver workload estimation. Effects of road situation and age on<br />
secondary task measures. Ergonomics, 43, 187-209.<br />
Yoshihiro T., Y., & Furukawa, Y. (2005). Estimate of driver’s fatigue through steering motion.<br />
Proc. IEEE International Conf. on Systems, Man, and Cybernetics, 2, 1765-1770.<br />
124