the influence of light intensity on the growth performance of common ...
the influence of light intensity on the growth performance of common ...
the influence of light intensity on the growth performance of common ...

Create successful ePaper yourself
Turn your PDF publications into a flip-book with our unique Google optimized e-Paper software.
Data statistic informati<strong>on</strong><br />
The statistic analysis was carried out with<br />
<str<strong>on</strong>g>the</str<strong>on</strong>g> help <str<strong>on</strong>g>of</str<strong>on</strong>g> <str<strong>on</strong>g>the</str<strong>on</strong>g> parametric test T-Student<br />
which allowed comparing <str<strong>on</strong>g>the</str<strong>on</strong>g> average <str<strong>on</strong>g>of</str<strong>on</strong>g> <str<strong>on</strong>g>the</str<strong>on</strong>g><br />
results.<br />
RESULTS AND DISCUSSIONS<br />
The water quality parameters within <str<strong>on</strong>g>the</str<strong>on</strong>g><br />
recirculating system: temperature (19.2 0 C-<br />
21.4 0 C), dissolved oxygen (4.1-5.6 mg/l),<br />
nitrate (between 7.9-14.4 mg/l), amm<strong>on</strong>ium<br />
(0.3-0.4 mg/l) and pH (between 7.1-7.8)<br />
registered c<strong>on</strong>stant values during <str<strong>on</strong>g>the</str<strong>on</strong>g><br />
experiment. Regarding <str<strong>on</strong>g>the</str<strong>on</strong>g> dynamics <str<strong>on</strong>g>of</str<strong>on</strong>g> <str<strong>on</strong>g>the</str<strong>on</strong>g><br />
water quality parameters, no major<br />
modificati<strong>on</strong>s or peaks during <str<strong>on</strong>g>the</str<strong>on</strong>g> day or after<br />
feeding were registered.<br />
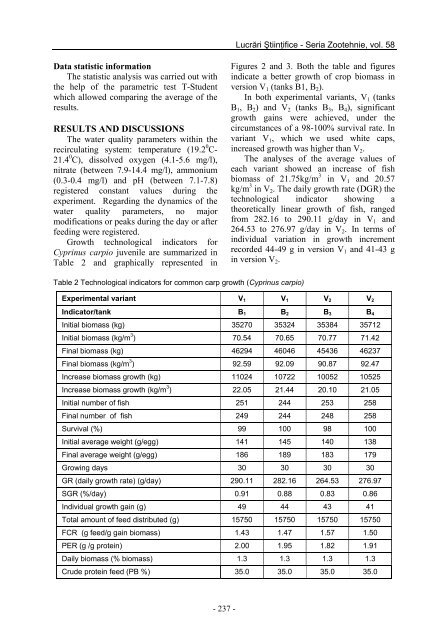
Growth technological indicators for<br />
Cyprinus carpio juvenile are summarized in<br />
Table 2 and graphically represented in<br />
Table 2 Technological indicators for comm<strong>on</strong> carp <strong>growth</strong> (Cyprinus carpio)<br />
- 237 -<br />
Lucrări Ştiinţifice - Seria Zootehnie, vol. 58<br />
Figures 2 and 3. Both <str<strong>on</strong>g>the</str<strong>on</strong>g> table and figures<br />
indicate a better <strong>growth</strong> <str<strong>on</strong>g>of</str<strong>on</strong>g> crop biomass in<br />
versi<strong>on</strong> V 1 (tanks B1, B 2).<br />
In both experimental variants, V1 (tanks<br />
B1, B 2) and V 2 (tanks B 3, B 4), significant<br />
<strong>growth</strong> gains were achieved, under <str<strong>on</strong>g>the</str<strong>on</strong>g><br />
circumstances <str<strong>on</strong>g>of</str<strong>on</strong>g> a 98-100% survival rate. In<br />
variant V 1, which we used white caps,<br />
increased <strong>growth</strong> was higher than V2.<br />
The analyses <str<strong>on</strong>g>of</str<strong>on</strong>g> <str<strong>on</strong>g>the</str<strong>on</strong>g> average values <str<strong>on</strong>g>of</str<strong>on</strong>g><br />
each variant showed an increase <str<strong>on</strong>g>of</str<strong>on</strong>g> fish<br />
biomass <str<strong>on</strong>g>of</str<strong>on</strong>g> 21.75kg/m 3 in V 1 and 20.57<br />
kg/m 3 in V 2. The daily <strong>growth</strong> rate (DGR) <str<strong>on</strong>g>the</str<strong>on</strong>g><br />
technological indicator showing a<br />
<str<strong>on</strong>g>the</str<strong>on</strong>g>oretically linear <strong>growth</strong> <str<strong>on</strong>g>of</str<strong>on</strong>g> fish, ranged<br />
from 282.16 to 290.11 g/day in V1 and<br />
264.53 to 276.97 g/day in V2. In terms <str<strong>on</strong>g>of</str<strong>on</strong>g><br />
individual variati<strong>on</strong> in <strong>growth</strong> increment<br />
recorded 44-49 g in versi<strong>on</strong> V1 and 41-43 g<br />
in versi<strong>on</strong> V2.<br />
Experimental variant V1 V1 V2 V2<br />
Indicator/tank B1 B2 B3 B4<br />
Initial biomass (kg) 35270 35324 35384 35712<br />
Initial biomass (kg/m 3 ) 70.54 70.65 70.77 71.42<br />
Final biomass (kg) 46294 46046 45436 46237<br />
Final biomass (kg/m 3 ) 92.59 92.09 90.87 92.47<br />
Increase biomass <strong>growth</strong> (kg) 11024 10722 10052 10525<br />
Increase biomass <strong>growth</strong> (kg/m 3 ) 22.05 21.44 20.10 21.05<br />
Initial number <str<strong>on</strong>g>of</str<strong>on</strong>g> fish 251 244 253 258<br />
Final number <str<strong>on</strong>g>of</str<strong>on</strong>g> fish 249 244 248 258<br />
Survival (%) 99 100 98 100<br />
Initial average weight (g/egg) 141 145 140 138<br />
Final average weight (g/egg) 186 189 183 179<br />
Growing days 30 30 30 30<br />
GR (daily <strong>growth</strong> rate) (g/day) 290.11 282.16 264.53 276.97<br />
SGR (%/day) 0.91 0.88 0.83 0.86<br />
Individual <strong>growth</strong> gain (g) 49 44 43 41<br />
Total amount <str<strong>on</strong>g>of</str<strong>on</strong>g> feed distributed (g) 15750 15750 15750 15750<br />
FCR (g feed/g gain biomass) 1.43 1.47 1.57 1.50<br />
PER (g /g protein) 2.00 1.95 1.82 1.91<br />
Daily biomass (% biomass) 1.3 1.3 1.3 1.3<br />
Crude protein feed (PB %) 35.0 35.0 35.0 35.0