Where are Europe's Assets? - geomer GmbH
Where are Europe's Assets? - geomer GmbH
Where are Europe's Assets? - geomer GmbH

You also want an ePaper? Increase the reach of your titles
YUMPU automatically turns print PDFs into web optimized ePapers that Google loves.
Service and Trade: Buildings and Equipment (net asset<br />
value, immobile)<br />
The methodology is analogue to that applied for the industrial assets, i.e.<br />
the totals for each country <strong>are</strong> collected from the statistics and <strong>are</strong> then<br />
spatially disaggregated based on the land use information.<br />
Service and Trade: Stock in Trade (mobile)<br />
Again, due to the non-availability of direct data, the stock volume has to be<br />
estimated based on the net asset value. As the overall service sector has<br />
only a very little stock volume but the subsection of the trade-sector a quite<br />
large one, the relation of trade to the other services needs to be taken into<br />
account for the stock estimation. This relation ranges from about 3 to 10%.<br />
Agriculture: Buildings and Equipment (net asset value,<br />
immobile)<br />
In the agricultural sector, the asset disaggregation is performed using the<br />
employees’ figures in this sector. The scheme is again identical to the one<br />
used for the industry and service sector assets.<br />
Agriculture: Stock in Trade without Livestock (mobile)<br />
The agricultural stock in trade can be divided into livestock and further<br />
stock. As the livestock covers the lion's sh<strong>are</strong> of the mobile assets and has<br />
to be allocated to different land use classes, it needs to be separated from<br />
the other stock assets.<br />
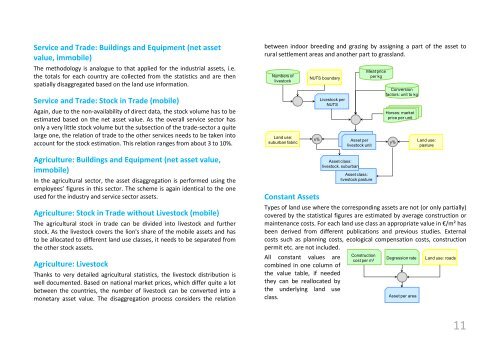
Agriculture: Livestock<br />
Thanks to very detailed agricultural statistics, the livestock distribution is<br />
well documented. Based on national market prices, which differ quite a lot<br />
between the countries, the number of livestock can be converted into a<br />
monetary asset value. The disaggregation process considers the relation<br />
between indoor breeding and grazing by assigning a part of the asset to<br />
rural settlement <strong>are</strong>as and another part to grassland.<br />
Numbers of<br />
livestock<br />
Land use:<br />
suburban fabric<br />
Constant <strong>Assets</strong><br />
NUTS boundary<br />
x%<br />
Livestock per<br />
NUTS<br />
Types of land use where the corresponding assets <strong>are</strong> not (or only partially)<br />
covered by the statistical figures <strong>are</strong> estimated by average construction or<br />
maintenance costs. For each land use class an appropriate value in €/m² has<br />
been derived from different publications and previous studies. External<br />
costs such as planning costs, ecological compensation costs, construction<br />
permit etc. <strong>are</strong> not included.<br />
All constant values <strong>are</strong><br />
combined in one column of<br />
the value table, if needed<br />
they can be reallocated by<br />
the underlying land use<br />
class.<br />
Asset<br />
Asset per<br />
Livestock<br />
livestock unit<br />
Asset class:<br />
livestock. suburban<br />
Asset class:<br />
livestock pasture<br />
Construction<br />
cost per m²<br />
Meat price<br />
per kg<br />
Conversion<br />
factors: unit to kg<br />
Horses: market<br />
price per unit<br />
y%<br />
Degression rate<br />
Asset per <strong>are</strong>a<br />
Land use:<br />
pasture<br />
Land use: roads<br />
11