design and characteristics of a split hopkinson pressure bar apparatus
design and characteristics of a split hopkinson pressure bar apparatus
design and characteristics of a split hopkinson pressure bar apparatus

Create successful ePaper yourself
Turn your PDF publications into a flip-book with our unique Google optimized e-Paper software.
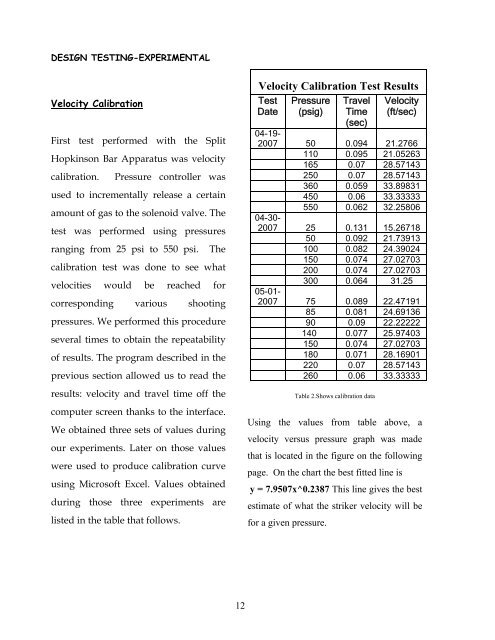
DESIGN TESTING-EXPERIMENTAL<br />
Velocity Calibration<br />
First test performed with the Split<br />
Hopkinson Bar Apparatus was velocity<br />
calibration. Pressure controller was<br />
used to incrementally release a certain<br />
amount <strong>of</strong> gas to the solenoid valve. The<br />
test was performed using <strong>pressure</strong>s<br />
ranging from 25 psi to 550 psi. The<br />
calibration test was done to see what<br />
velocities would be reached for<br />
corresponding various shooting<br />
<strong>pressure</strong>s. We performed this procedure<br />
several times to obtain the repeatability<br />
<strong>of</strong> results. The program described in the<br />
previous section allowed us to read the<br />
results: velocity <strong>and</strong> travel time <strong>of</strong>f the<br />
computer screen thanks to the interface.<br />
We obtained three sets <strong>of</strong> values during<br />
our experiments. Later on those values<br />
were used to produce calibration curve<br />
using Micros<strong>of</strong>t Excel. Values obtained<br />
during those three experiments are<br />
listed in the table that follows.<br />
12<br />
Velocity Calibration Test Results<br />
Test<br />
Date<br />
Pressure<br />
(psig)<br />
Travel<br />
Time<br />
(sec)<br />
Velocity<br />
(ft/sec)<br />
04-19-<br />
2007 50 0.094 21.2766<br />
110 0.095 21.05263<br />
165 0.07 28.57143<br />
250 0.07 28.57143<br />
360 0.059 33.89831<br />
450 0.06 33.33333<br />
550 0.062 32.25806<br />
04-30-<br />
2007 25 0.131 15.26718<br />
50 0.092 21.73913<br />
100 0.082 24.39024<br />
150 0.074 27.02703<br />
200 0.074 27.02703<br />
300 0.064 31.25<br />
05-01-<br />
2007 75 0.089 22.47191<br />
85 0.081 24.69136<br />
90 0.09 22.22222<br />
140 0.077 25.97403<br />
150 0.074 27.02703<br />
180 0.071 28.16901<br />
220 0.07 28.57143<br />
260 0.06 33.33333<br />
Table 2.Shows calibration data<br />
Using the values from table above, a<br />
velocity versus <strong>pressure</strong> graph was made<br />
that is located in the figure on the following<br />
page. On the chart the best fitted line is<br />
y = 7.9507x^0.2387 This line gives the best<br />
estimate <strong>of</strong> what the striker velocity will be<br />
for a given <strong>pressure</strong>.