design and characteristics of a split hopkinson pressure bar apparatus
design and characteristics of a split hopkinson pressure bar apparatus
design and characteristics of a split hopkinson pressure bar apparatus

You also want an ePaper? Increase the reach of your titles
YUMPU automatically turns print PDFs into web optimized ePapers that Google loves.
solenoid valve letting the gas exp<strong>and</strong> to the<br />
launching tube pushing the striker out. When<br />
the striker reaches the end <strong>of</strong> the <strong>bar</strong>rel it<br />
blocks the laser beam that is shining at the<br />
sensor, changing the voltage seen by the<br />
control system. At the same time striker <strong>bar</strong><br />
impacts the incident <strong>bar</strong> producing the<br />
propagation wave through the <strong>bar</strong>s. The<br />
control system closes the valve blocking <strong>of</strong>f<br />
the delivery <strong>of</strong> nitrogen. The velocity <strong>of</strong> the<br />
striker is measured from the time the solenoid<br />
valve is opened to the time the voltage<br />
changes closing the solenoid valve.<br />
The excess <strong>of</strong> the <strong>pressure</strong> from the launching<br />
tube is released by a h<strong>and</strong> operated valve <strong>and</strong><br />
then the vacuum suction is applied to move<br />
the striker <strong>bar</strong> to starting position.<br />
Fig.3 shows a diagram <strong>of</strong> the <strong>apparatus</strong><br />
The second part <strong>of</strong> the <strong>apparatus</strong> is the strain<br />
measuring section. It is composed <strong>of</strong> a<br />
striker <strong>bar</strong>, an incident <strong>bar</strong>, the test specimen<br />
<strong>and</strong> the output <strong>bar</strong>. The impact <strong>of</strong> the striker<br />
<strong>bar</strong> on incident <strong>bar</strong> produces a rectangular<br />
compression wave <strong>of</strong> well-defined<br />
amplitude <strong>and</strong> length in the incident <strong>bar</strong>.<br />
6<br />
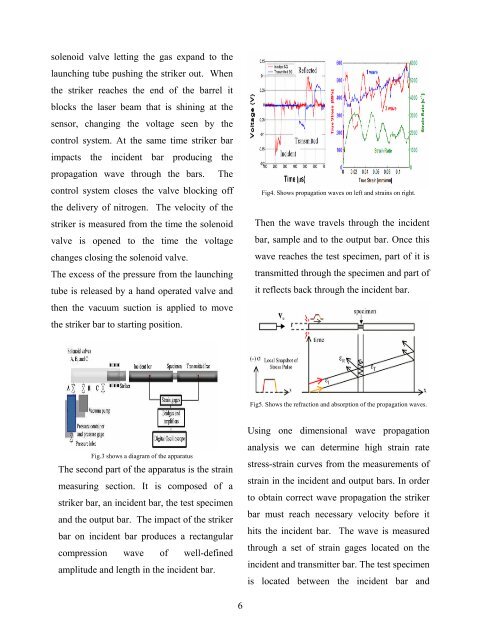
Fig4. Shows propagation waves on left <strong>and</strong> strains on right.<br />
Then the wave travels through the incident<br />
<strong>bar</strong>, sample <strong>and</strong> to the output <strong>bar</strong>. Once this<br />
wave reaches the test specimen, part <strong>of</strong> it is<br />
transmitted through the specimen <strong>and</strong> part <strong>of</strong><br />
it reflects back through the incident <strong>bar</strong>.<br />
Fig5. Shows the refraction <strong>and</strong> absorption <strong>of</strong> the propagation waves.<br />
Using one dimensional wave propagation<br />
analysis we can determine high strain rate<br />
stress-strain curves from the measurements <strong>of</strong><br />
strain in the incident <strong>and</strong> output <strong>bar</strong>s. In order<br />
to obtain correct wave propagation the striker<br />
<strong>bar</strong> must reach necessary velocity before it<br />
hits the incident <strong>bar</strong>. The wave is measured<br />
through a set <strong>of</strong> strain gages located on the<br />
incident <strong>and</strong> transmitter <strong>bar</strong>. The test specimen<br />
is located between the incident <strong>bar</strong> <strong>and</strong>