Developing crop descriptor lists - Bioversity International
Developing crop descriptor lists - Bioversity International
Developing crop descriptor lists - Bioversity International
Create successful ePaper yourself
Turn your PDF publications into a flip-book with our unique Google optimized e-Paper software.
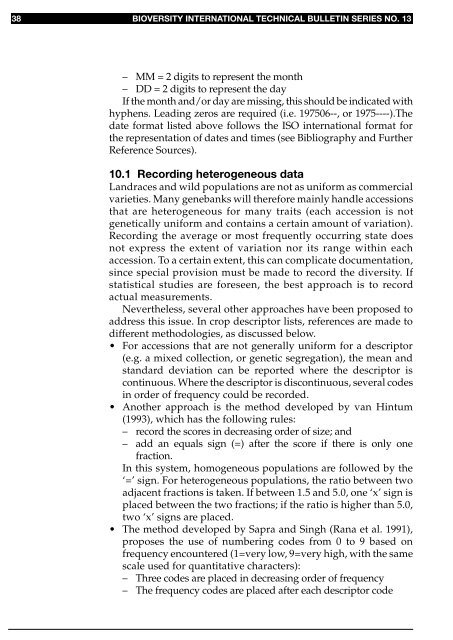
38 BIOVERSITY INTERNATIONAL TECHNICAL BULLETIN SERIES NO. 13<br />
– MM = 2 digits to represent the month<br />
– DD = 2 digits to represent the day<br />
If the month and/or day are missing, this should be indicated with<br />
hyphens. Leading zeros are required (i.e. 197506--, or 1975----).The<br />
date format listed above follows the ISO international format for<br />
the representation of dates and times (see Bibliography and Further<br />
Reference Sources).<br />
10.1 Recording heterogeneous data<br />
Landraces and wild populations are not as uniform as commercial<br />
varieties. Many genebanks will therefore mainly handle accessions<br />
that are heterogeneous for many traits (each accession is not<br />
genetically uniform and contains a certain amount of variation).<br />
Recording the average or most frequently occurring state does<br />
not express the extent of variation nor its range within each<br />
accession. To a certain extent, this can complicate documentation,<br />
since special provision must be made to record the diversity. If<br />
statistical studies are foreseen, the best approach is to record<br />
actual measurements.<br />
Nevertheless, several other approaches have been proposed to<br />
address this issue. In <strong>crop</strong> <strong>descriptor</strong> <strong>lists</strong>, references are made to<br />
different methodologies, as discussed below.<br />
• For accessions that are not generally uniform for a <strong>descriptor</strong><br />
(e.g. a mixed collection, or genetic segregation), the mean and<br />
standard deviation can be reported where the <strong>descriptor</strong> is<br />
continuous. Where the <strong>descriptor</strong> is discontinuous, several codes<br />
in order of frequency could be recorded.<br />
• Another approach is the method developed by van Hintum<br />
(1993), which has the following rules:<br />
– record the scores in decreasing order of size; and<br />
– add an equals sign (=) after the score if there is only one<br />
fraction.<br />
In this system, homogeneous populations are followed by the<br />
‘=’ sign. For heterogeneous populations, the ratio between two<br />
adjacent fractions is taken. If between 1.5 and 5.0, one ‘x’ sign is<br />
placed between the two fractions; if the ratio is higher than 5.0,<br />
two ‘x’ signs are placed.<br />
• The method developed by Sapra and Singh (Rana et al. 1991),<br />
proposes the use of numbering codes from 0 to 9 based on<br />
frequency encountered (1=very low, 9=very high, with the same<br />
scale used for quantitative characters):<br />
– Three codes are placed in decreasing order of frequency<br />
– The frequency codes are placed after each <strong>descriptor</strong> code


