Shipping Statistics and Market Review - Institut für ...
Shipping Statistics and Market Review - Institut für ...
Shipping Statistics and Market Review - Institut für ...

You also want an ePaper? Increase the reach of your titles
YUMPU automatically turns print PDFs into web optimized ePapers that Google loves.
Container <strong>and</strong> general cargo fleet, supply/dem<strong>and</strong>, ports<br />
SUPPLY / DEMAND PATTERNS IN<br />
CONTAINER AND GENERAL CARGO<br />
SHIPPING<br />
Global Insight - World trade outlook <strong>and</strong> world<br />
contaierised trade development up to 2006 9<br />
Pages<br />
49-61<br />
Nowhere has the building momentum in the global<br />
recovery been more joyously received than among<br />
shipowners. Liner operators are making money, <strong>and</strong><br />
they are euphoric about it. Box rates are increasing<br />
steadily, <strong>and</strong> the full ships have encouraged a sharp<br />
increase in the orderbook stretching deliveries out to<br />
2007, despite rising new build prices.<br />
Since the bursting of the IT bubble in 2000, the world<br />
has had three years to adjust <strong>and</strong> absorb the resulting<br />
damage to the economy. Terrorist attacks, the<br />
Afghanistan <strong>and</strong> Iraq wars, escalating energy prices,<br />
<strong>and</strong> corporate accounting sc<strong>and</strong>als have diverted<br />
economic resources, raised social costs, <strong>and</strong> reduced<br />
investors’ <strong>and</strong> consumers’ confidence <strong>and</strong>, therefore,<br />
slowed the economic recovery process. Continuing<br />
technology progress, population growth, <strong>and</strong><br />
government monetary <strong>and</strong> fiscal stimulus have helped<br />
to keep the global recovery on track. Entering 2004,<br />
although the recovery has not yet played out, the<br />
economies of most major countries have returned to<br />
healthy conditions, with the structure <strong>and</strong> sustained<br />
strength to continue growing. Non-Japan Asia <strong>and</strong> the<br />
United States are taking the lead in this new round of<br />
economic expansion, followed by Australia, New<br />
Zeal<strong>and</strong>, Canada, the United Kingdom, <strong>and</strong> then<br />
Japan. Even Germany has returned to positive growth,<br />
<strong>and</strong> the whole Eurozone has climbed out of recession.<br />
Other economies, whether they experienced a<br />
recession or maintained economic growth, are all<br />
boosted by the recovery of the world’s major<br />
economies. Global Insight’s latest forecast for the<br />
world as a whole is for real GDP in 2004 to increase<br />
by 4 per cent.<br />
World full-container traffic is predicted to reach 69.7<br />
million TEUs in 2004, an increase of 6.4 per cent<br />
over last year. This is only a slightly slower growth<br />
than in 2003 (which was 6.8 per cent), but far<br />
superior to the meagre 1.1per cent growth in 2001.<br />
With economic growth strong in most importing<br />
regions, <strong>and</strong> with China exporting so much liner<br />
cargo, the drivers of this increase are clear. Its<br />
container exports are more than double those of the<br />
9 The contribution is based on the World Trade Service published<br />
by Global Insight. Compare www.globalinsight.com<br />
10 SSMR June 2004<br />
United States. Also, the growth of China's exports is<br />
projected to be one of the fastest in the world.<br />
The amazing dominance of China as an exporter of<br />
containerised cargo can be seen in table 11; China's<br />
exports in 2005 will be more than double its exports<br />
in 2000. Its average annual growth of 6 per cent will<br />
keep it in the top position throughout the forecast<br />
period.<br />
This year, China will gain another 5 per cent share of<br />
total container exports over 2003, an amazing feat.<br />
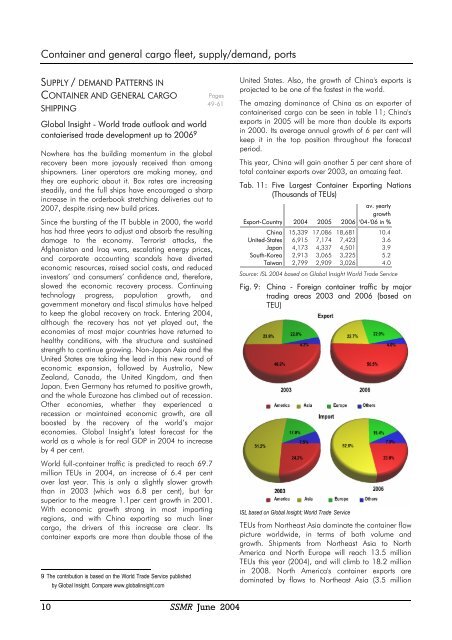
Tab. 11: Five Largest Container Exporting Nations<br />
(Thous<strong>and</strong>s of TEUs)<br />
av. yearly<br />
growth<br />
Export-Country 2004 2005 2006 '04-'06 in %<br />
China 15,339 17,086 18,681 10.4<br />
United-States 6,915 7,174 7,423 3.6<br />
Japan 4,173 4,337 4,501 3.9<br />
South-Korea 2,913 3,065 3,225 5.2<br />
Taiwan 2,799 2,909 3,026 4.0<br />
Source: ISL 2004 based on Global Insight World Trade Service<br />
Fig. 9: China - Foreign container traffic by major<br />
trading areas 2003 <strong>and</strong> 2006 (based on<br />
TEU)<br />
ISL based on Global Insight; World Trade Service<br />
TEUs from Northeast Asia dominate the container flow<br />
picture worldwide, in terms of both volume <strong>and</strong><br />
growth. Shipments from Northeast Asia to North<br />
America <strong>and</strong> North Europe will reach 13.5 million<br />
TEUs this year (2004), <strong>and</strong> will climb to 18.2 million<br />
in 2008. North America's container exports are<br />
dominated by flows to Northeast Asia (3.5 million