HPLC–FLD for the Simultaneous Determination of Primary and ...
HPLC–FLD for the Simultaneous Determination of Primary and ...
HPLC–FLD for the Simultaneous Determination of Primary and ...

Create successful ePaper yourself
Turn your PDF publications into a flip-book with our unique Google optimized e-Paper software.
<strong>HPLC–FLD</strong> <strong>for</strong> <strong>the</strong> <strong>Simultaneous</strong> <strong>Determination</strong> <strong>of</strong><br />
<strong>Primary</strong> <strong>and</strong> Secondary Amino Acids from Complex<br />
Biological Sample by Pre-column Derivatization<br />
Shailesh M. Buha1,* , Ashwin Panchal1 , Haresh Panchal1 , Ravindra Chambhare1 , Sanjeev Kumar2 , Mukul Jain3 , <strong>and</strong><br />
Pankaj R. Patel1 1Department <strong>of</strong> Biopharmaceutics, 2Department <strong>of</strong> Biotechnology, 3Department <strong>of</strong> Pharmacology <strong>and</strong> Toxicology, Zydus Research Centre,<br />
Cadila Healthcare Ltd., Ahmedabad-382210, Gujarat-India<br />
Abstract<br />
A rapid, sensitive, <strong>and</strong> reproducible pre-column derivatisation<br />
procedure has been established <strong>for</strong> <strong>the</strong> simultaneous determination<br />
<strong>of</strong> 20 amino acids by high-per<strong>for</strong>mance liquid chromatography<br />
using fluorescence detection. The amino acids were derivatized<br />
using o-phthalaldehyde <strong>and</strong> 9-fluorenylmethyl-chloro<strong>for</strong>mate<br />
reagents. The optimal conditions <strong>for</strong> simultaneous separation <strong>and</strong><br />
detection <strong>of</strong> both primary <strong>and</strong> secondary amino acids were<br />
investigated. The developed method has several advantages,<br />
namely automated pre-column derivatization, short analysis time<br />
with optimal separation, a simple <strong>and</strong> economical mobile phase,<br />
high level <strong>of</strong> precision <strong>for</strong> peak area <strong>and</strong> retention time, <strong>and</strong> higher<br />
sensitivity with more reliability <strong>of</strong> peak identification. The<br />
biological media development is <strong>the</strong> key parameter <strong>for</strong><br />
macromolecule drug discovery. Biological media amino acids in<br />
three consecutive discovery batches were determined <strong>and</strong> <strong>the</strong><br />
results showed a good agreement with hypo<strong>the</strong>tical value. The<br />
method appears suitable <strong>for</strong> application to measure biological<br />
media amino acids at various stages <strong>of</strong> macromolecule drug<br />
discovery.<br />
Introduction<br />
The amino acid is a key chemical in all branches <strong>of</strong> chemistry<br />
<strong>and</strong> life sciences. It has a long history in characterization during<br />
discovery <strong>and</strong> development <strong>of</strong> drug <strong>and</strong> <strong>the</strong>rapeutic proteins. The<br />
amino acids <strong>for</strong>m a large group <strong>of</strong> compounds <strong>of</strong> both biochemical<br />
<strong>and</strong> pharmaceutical interest <strong>and</strong> <strong>the</strong>ir determination necessitate<br />
<strong>the</strong> use <strong>of</strong> accurate <strong>and</strong> precise techniques (1).<br />
The amino acids do not absorb UV–vis light significantly; however,<br />
to increase sensitivity, <strong>the</strong>ir analysis normally includes a<br />
derivatization step in which <strong>the</strong> amino acid react with a precursor<br />
to yield a strong fluorescent compound. Derivatization<br />
can be per<strong>for</strong>med be<strong>for</strong>e <strong>the</strong> chromatographic separation or after<br />
<strong>the</strong> separation step.<br />
The amino acid analysis was first introduced by Stein <strong>and</strong><br />
Moore (2), which involved ion exchange chromatography <strong>for</strong> <strong>the</strong><br />
separation <strong>of</strong> underivatized amino acid followed by <strong>the</strong> post<br />
*Author to whom correspondence should be addressed: email sms_buha@yahoo.com.<br />
118<br />
column derivatization with ninhydrin. There are many o<strong>the</strong>r<br />
reagents such as ninhydrin (3,4), fluorescamine (4,5), dansyl<br />
chloride (6), 4-fluoro-7-nitrobenzo-2, 1, 3 oxadiazole (7),<br />
phenylisocynate (8), o-phthalaldehyde (9,10) that are commonly<br />
used in amino acid analysis. Birwe et al. (9) have used o-phthalaldehyde<br />
(OPA) <strong>for</strong> pre- <strong>and</strong> post-column derivatization <strong>of</strong> pri-<br />
Reproduction (photocopying) <strong>of</strong> editorial content <strong>of</strong> this journal is prohibited without publisher’s permission.<br />
Journal <strong>of</strong> Chromatographic Science, Vol. 49, February 2011<br />
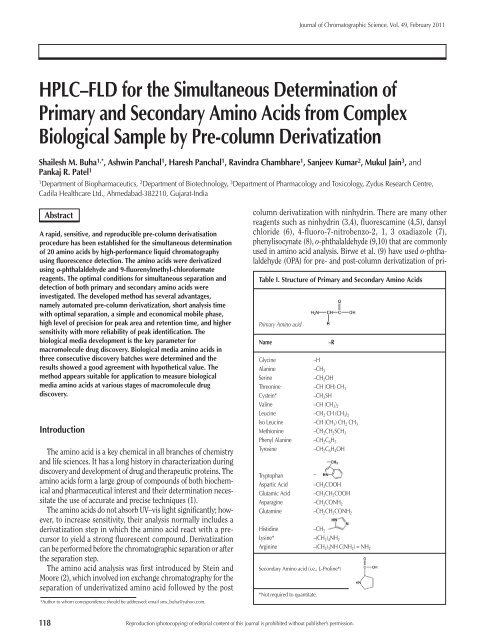
Table I. Structure <strong>of</strong> <strong>Primary</strong> <strong>and</strong> Secondary Amino Acids<br />
<strong>Primary</strong> Amino acid<br />
Name –R<br />
Glycine –H<br />
Alanine –CH 3<br />
Serine –CH 2OH<br />
Threonine –CH (OH) CH 3<br />
Cystein* –CH 2SH<br />
Valine –CH (CH 3) 2<br />
Leucine –CH 2 CH (CH 3) 2<br />
Iso Leucine –CH (CH 3) CH 2 CH 3<br />
Methionine –CH 2CH 2SCH 3<br />
Phenyl Alanine –CH 2C 6H 5<br />
Tyrosine –CH 2C 6H 4OH<br />
Tryptophan<br />
–<br />
Aspartic Acid –CH2COOH Glutamic Acid –CH2CH2COOH Asparagine –CH2CONH2 Glutamine –CH2CH2CONH2 Histidine –CH 2<br />
Lysine* –(CH 2) 4NH 2<br />
Arginine –(CH 2) 3NH C(NH 2) = NH 2<br />
Secondary Amino acid (i.e., L-Proline*)<br />
*Not required to quantitate.
Journal <strong>of</strong> Chromatographic Science, Vol. 49, February 2011<br />
mary amino acids in presence <strong>of</strong> 3-mercaptopropionic acid to<br />
<strong>for</strong>m intensely fluorescent N-substituted-1-alkylthioisoindoles<br />
(11). Though several reagents are used with OPA <strong>for</strong> primary<br />
amino acids, but 3-mercaptopropionic acid has higher derivative<br />
stability with respect to time. The secondary amino acids do not<br />
react with OPA <strong>and</strong> remain as such in sample – biological media.<br />
This limitation is overcome by using 9-fluoronylmethyl chloro<strong>for</strong>mate<br />
(FMOC) <strong>for</strong> derivatization <strong>of</strong> secondary amino acid<br />
[i.e., l-proline (12)].<br />
The biological media <strong>for</strong> <strong>the</strong> discovery <strong>and</strong> production <strong>of</strong> <strong>the</strong>rapeutic<br />
proteins <strong>and</strong> monitoring <strong>of</strong> amino acid during development<br />
is m<strong>and</strong>atory. The analysis <strong>of</strong> amino acid in complex<br />
biological mixture is challenging due to presence <strong>of</strong> many o<strong>the</strong>r<br />
components like fatty acids, lactic acid etc. Moreover, due to <strong>the</strong><br />
significant differences in <strong>the</strong> functional groups <strong>of</strong> various components,<br />
ranging from non polar to highly polar, may interfere<br />
with <strong>the</strong> derivatization <strong>and</strong> detection <strong>of</strong> <strong>the</strong> amino acids.<br />
In this paper a procedure which consists <strong>of</strong> pre-column derivatization<br />
with o-phthalaldehyde (OPA) <strong>and</strong> 9-fluoronylmethyl<br />
chloro<strong>for</strong>mate (FMOC) in a borate buffer (alkaline medium) is<br />
described, giving fluorescent active iso-indoles that can be separated<br />
by reversed phase chromatography. A total <strong>of</strong> 20 amino<br />
acids were identified, out <strong>of</strong> which 17 amino acids, were added in<br />
cell culture <strong>and</strong> quantified simultaneously using <strong>the</strong> described<br />
procedure. The amino acids studied with structure are given in<br />
Table I. Cysteine, lysine, <strong>and</strong> proline were not monitored in <strong>the</strong><br />
process <strong>and</strong> thus were not quantified.<br />
The method shows excellent linearity, accuracy, precision, <strong>and</strong><br />
very short analysis time (< 19 min) <strong>for</strong> <strong>the</strong> baseline resolution <strong>of</strong><br />
20 amino acids. OPA used in <strong>the</strong> present study does not interfere<br />
as it is non fluorescent, though its derivatives give fluorescent<br />
compounds. The method was accurately validated <strong>for</strong> specificity,<br />
linearity, precision, recovery, limit <strong>of</strong> detection (LOD), <strong>and</strong> limit<br />
<strong>of</strong> quantification (LOQ), according to approved guideline (13)<br />
<strong>and</strong> o<strong>the</strong>r reports (14–15).<br />
Table II. Autosampler Programming Instruction<br />
Position <strong>of</strong> Vials<br />
Position 10: Borate Buffer<br />
Position 11: OPA reagent<br />
Position 12: HPLC grade water<br />
Position 14: FMOC reagent<br />
Position X: Sample (Amino acid st<strong>and</strong>ard, biological media)<br />
X is any o<strong>the</strong>r position in autosampler tray<br />
Derivatization/Injection routine<br />
1 Draw 5 µL from Vial 10 (Borate buffer)<br />
2 Draw 1 µL from Vial 11 (OPA reagent)<br />
3 Draw 0 µL from Vial 12 (Water)<br />
4 Draw 1 µL from X Vial (Sample or St<strong>and</strong>ard Vial)<br />
5 Draw 0 µL from Vial 12 (Water)<br />
6 Mix 8.0 µL in air, maximum speed, six times<br />
7 Draw 1.0 µL from Vial 14 (FMOC)<br />
8 Draw 1.0 µL from Vial 12 (Water)<br />
9 Mix 9 µL in air, maximum speed, 3 times<br />
10 Inject<br />
11 Wait 0.1 min<br />
12 Valve Bypass<br />
Experimental<br />
Chemicals <strong>and</strong> materials<br />
AR grade sodium acetate trihydrate, triethyl amine, acetic acid<br />
glacial, while high-per<strong>for</strong>mance liquid chromatography grade<br />
methanol <strong>and</strong> acetonitrile were purchased from S.D. Fine-Chem<br />
limited (Mumbai, India). High-per<strong>for</strong>mance liquid chromatography<br />
(HPLC) grade tetrahydr<strong>of</strong>uran <strong>and</strong> AR grade hydrochloric<br />
acid (35%, w/w) were procured from Merck (Mumbai, India). The<br />
amino acid kit was purchased from Sigma (St. Louis, MO).<br />
Biological samples or media were received from Department <strong>of</strong><br />
Biotechnology, Zydus Research Centre (Zydus Cadila, India), The<br />
OPA reagent, FMOC reagent <strong>and</strong> borate buffer were purchased<br />
from Agilent (Waldbronn, Germany). Ultra pure water was<br />
obtained from a NANO pure Diamond water purification system<br />
(Barnstead, Iowa) with conductivity lower than 0.055 µs/cm.<br />
Solutions to be analyzed were filtered through 0.45-µm mdi<br />
Nylon syringe filters from Advanced Microdevices Pvt. Ltd.,<br />
(Ambala Cantt, India). Hypersil-AA ODS stainless steel column,<br />
amber wide-opening HPLC vials, glass conical inserts with<br />
polymer feet <strong>and</strong> screw caps were purchased from Agilent<br />
(Waldbronn, Germany), while syringes were purchased from<br />
Becton Dickinson Indian (P) Ltd., (Haryana, India).<br />
Equipment<br />
HPLC measurement was per<strong>for</strong>med on Agilent 1200 series<br />
HPLC–DAD <strong>and</strong> Agilent 1100 series fluorescence detector (FLD),<br />
(Agilent Technologies, Germany). Automated derivatization was<br />
Table III. Gradient Composition <strong>of</strong> Mobile Phase <strong>and</strong> Flow Rate*<br />
Time (min) % A % B Flow rate (mL/min)<br />
0.00 100 0 0.45<br />
10.00 78 22 0.45<br />
17.00 40 60 0.45<br />
18.00 0 100 0.45<br />
18.10 0 100 0.45<br />
18.50 0 100 0.80<br />
23.90 0 100 0.80<br />
24.00 0 100 0.45<br />
25.00 100 0 0.45<br />
*Post time: 5.00 min.<br />
Figure 1. Derivatization reaction <strong>for</strong> (I) primary amino acids with OPA in 3mercaptopropionic<br />
acid using borate buffer <strong>and</strong> (II) secondary amino acid<br />
using FMOC reagent.<br />
119
carried out using an Agilent 1200 series autosampler (Agilent,<br />
Böblingen, Germany). The data were collected <strong>and</strong> processed on<br />
PC equipped with ChemStation s<strong>of</strong>tware. Sonication was per<strong>for</strong>med<br />
on Sonicator 8891 (Cole-Parmer, Vernon Hills, IL), while<br />
<strong>the</strong> vortexer was purchased from Tarson - 3020 (Kolkata, India).<br />
Weighing was done on Analytical balance (AG245) <strong>and</strong><br />
Microbalance (UMT2) from Mettler Toledo (Greifensee,<br />
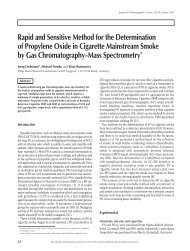
Figure 2. Chromatograms <strong>for</strong> amino acids (A), <strong>and</strong> blank solution (B), using 17 mM sodium acetate in<br />
mobile phase A <strong>and</strong> 85 mM sodium acetate in mobile phase B.<br />
Table IV. Order <strong>of</strong> Elution, Retention Time <strong>and</strong> Resolution <strong>for</strong> Amino Acids<br />
Peak Amino Sequence Derivative Retention<br />
No. acid Name Type time (min) % RSD* R s †<br />
1. Aspartic Acid (ASP) D OPA 1.47 0.24 –<br />
2. Glutamic Acid (GLU) E OPA 1.65 0.35 1.08<br />
3. Asparagine (ASP) N OPA 5.06 0.45 19.25<br />
4. Serine (SER) S OPA 5.37 0.33 1.70<br />
5. Glutamine (GLU) Q OPA 6.43 0.17 5.19<br />
6. Histidine (HIS) H OPA 6.78 0.19 1.62<br />
7. Glycine (GLY) G OPA 7.02 0.01 1.12<br />
8. Threonine (THR) T OPA 7.54 0.15 2.52<br />
9. Alanine (ALA) A OPA 9.46 0.15 9.15<br />
10. Arginine (ARG) R OPA 9.81 0.12 1.66<br />
11. Tyrosine (TYR) Y OPA 2.06 0.15 10.81<br />
12. Cysteine (CYS) ‡ C OPA 14.21 0.15 9.38<br />
13. Valine (VAL) V OPA 14.51 0.11 1.43<br />
14. Methionine (MET) M OPA 14.73 0.12 1.12<br />
15. Tryptophan (TRP) W OPA 15.57 0.11 4.31<br />
16. Phenylalanine (PHE) F OPA 15.90 0.10 1.72<br />
17. Iso Leucine (ILE) I OPA 16.08 0.10 0.87<br />
18. Leucine (LEU) L OPA 16.58 0.10 2.46<br />
19. Lysine (LYS) ‡ K OPA 6.93 0.09 1.88<br />
20. Proline (PRO) ‡ P FMOC 19.17 0.04 13.25<br />
* Relative st<strong>and</strong>ard deviation<br />
† Resolution factor.<br />
‡ Not <strong>for</strong> quantification only <strong>for</strong> identification in this experiment or study.<br />
120<br />
Journal <strong>of</strong> Chromatographic Science, Vol. 49, February 2011<br />
Switzerl<strong>and</strong>). Autopipettes were procured from Eppendorf<br />
(Hauppauge, NY).<br />
Derivatization procedure<br />
The primary <strong>and</strong> secondary amino acids were derivatized with<br />
OPA <strong>and</strong> FMOC reagent by programming <strong>of</strong> robotic autosampler<br />
(Table II). The N-substituted-1-alkylthioisoindole derivatives<br />
<strong>for</strong>med <strong>and</strong> <strong>the</strong>ir structures are described in<br />
Table I <strong>and</strong> Figure 1.<br />
Chromatographic condition<br />
After automatic derivatization step, an amount<br />
equivalent to 1 µL <strong>of</strong> each sample <strong>and</strong> st<strong>and</strong>ard<br />
was injected on a pre equilibrated Hypersil AA<br />
ODS, 5 µm (250 mm, length × 4.6 mm, internal<br />
diameter) stainless steel column operated at 40°C<br />
± 2°C. The detection <strong>of</strong> amino acid derivatives<br />
was per<strong>for</strong>med using FLD at excitation wavelength<br />
(λ Ex) 340 nm <strong>and</strong> emission wavelength<br />
(λ Em) 450 nm from 0 min to 18.0 min. Fur<strong>the</strong>r,<br />
from 18.0 to 25.0 min at <strong>the</strong> excitation <strong>and</strong> emission<br />
wavelengths were maintained at 266 nm <strong>and</strong><br />
305 nm respectively. Mobile phase A was 3% (v/v)<br />
tetrahydr<strong>of</strong>uran in 17 mM sodium acetate trihydrate<br />
[pH 7.2 adjusted using 2% (v/v) glacial<br />
acetic acid], while mobile phase B was a mixture<br />
<strong>of</strong> 85 mM sodium acetate trihydrate [pH 7.2<br />
adjusted using 2% (v/v) glacial acetic acid]–<br />
acetonitrile–methanol (1:2:2, v/v/v). The separation<br />
was obtained with gradient program <strong>of</strong><br />
mobile phase <strong>and</strong> flow rate (Table III). The total<br />
analysis time was 25.0 min.<br />
St<strong>and</strong>ard amino acid preparation<br />
The combined stock solution <strong>of</strong> amino acids<br />
(containing 50 µg/mL <strong>of</strong> each) was prepared by<br />
dissolving <strong>the</strong>ir requisite amounts in 0.1N HCl.<br />
Calibration st<strong>and</strong>ards <strong>of</strong> 0.5, 1.0, 1.5, 2.0, <strong>and</strong> 2.5<br />
µg/mL concentration were prepared by taking<br />
0.2, 0.4, 0.6, 0.8, <strong>and</strong> 1.0 mL aliquots, respectively<br />
from stock solution in 20 mL volumetric flask<br />
<strong>and</strong> diluting with 0.1N HCl. The solutions were<br />
filtered through 0.45-µm mdi nylon filter be<strong>for</strong>e<br />
measurement.<br />
Analysis <strong>of</strong> biological media<br />
Sample preparation<br />
Sample solution was prepared by mixing 10 µL<br />
<strong>of</strong> biological sample with 950 µL <strong>of</strong> water, sonicated<br />
<strong>and</strong> vortex mix to get a homogeneous<br />
sample. The sample solution was filtered through<br />
0.45-µm nylon mdi filter <strong>and</strong> used <strong>for</strong> fur<strong>the</strong>r<br />
study.<br />
Assay procedure<br />
A 1 µL aliquot <strong>of</strong> all calibration st<strong>and</strong>ard solutions<br />
was derivatized with OPA <strong>and</strong> FMOC prior<br />
to injection in <strong>the</strong> HPLC system, equipped with
Journal <strong>of</strong> Chromatographic Science, Vol. 49, February 2011<br />
FLD. Likewise, <strong>the</strong> sample solutions were derivatized <strong>and</strong> <strong>the</strong><br />
amino acid content in each sample was determined from linearity<br />
graph.<br />
Validation procedures<br />
Specificity <strong>of</strong> <strong>the</strong> method was checked by analyzing blank biological<br />
media, diluent (0.1N HCl) <strong>and</strong> mobile phase (initial ratio)<br />
following <strong>the</strong> assay procedure. Similarly, linearity <strong>of</strong> <strong>the</strong> method<br />
was ascertained by analyzing <strong>the</strong> calibration st<strong>and</strong>ards. The<br />
accuracy <strong>of</strong> <strong>the</strong> method was determined as mean recovery <strong>of</strong> two<br />
solutions containing known amount <strong>of</strong> amino acids comparable<br />
with <strong>the</strong> amount in cell culture feed. Precision, expressed as %<br />
relative st<strong>and</strong>ard deviation (%RSD) was evaluated by analyzing<br />
<strong>the</strong> highest calibration st<strong>and</strong>ard (2.5 µg/mL) in triplicate.<br />
Similarly, <strong>the</strong> biological media from three different batches was<br />
analyzed in duplicate.<br />
Results <strong>and</strong> Discussion<br />
Derivatization<br />
The derivatization process <strong>of</strong> primary <strong>and</strong> secondary<br />
amino acids with OPA <strong>and</strong> FMOC reagent<br />
in <strong>the</strong> presence <strong>of</strong> 3-mercaptopropionic acid in<br />
borate buffer was carried out by automated<br />
injector program. The derivatization <strong>of</strong> complex<br />
biological media was also per<strong>for</strong>med in <strong>the</strong> same<br />
manner after dilution, however, <strong>the</strong> complexity<br />
<strong>of</strong> <strong>the</strong> matrix makes it difficult to derivatize. The<br />
stability <strong>of</strong> <strong>the</strong> reagent was also crucial during<br />
derivatization, <strong>the</strong> OPA reagent can be used upto<br />
seven days (stored at 5°C ± 3°C) from <strong>the</strong> date <strong>of</strong><br />
opening <strong>the</strong> ampoule. After seven days, <strong>the</strong>re was<br />
a gradual reduction in resolution factor <strong>and</strong><br />
intensity <strong>of</strong> <strong>the</strong> peak. It may be due to variation<br />
in pH <strong>of</strong> <strong>the</strong> buffer, concentration <strong>of</strong> <strong>the</strong> OPA <strong>and</strong><br />
its degradation. The FMOC reagent is also useable<br />
up to 7 days when stored at 5°C ± 3°C.<br />
Chromatography<br />
During development, a resolution factor <strong>of</strong><br />
1.0 was considered optimum <strong>for</strong> <strong>the</strong> separation<br />
<strong>of</strong> analytes (i.e., derivatives <strong>of</strong> amino acids),<br />
based on <strong>the</strong> series <strong>of</strong> in-house experiments.<br />
Except isoleucine (ILE), which had 0.87 as <strong>the</strong><br />
resolution factor, all o<strong>the</strong>r analytes were separated<br />
with much higher factor values (Table IV).<br />
However, this did not effect <strong>the</strong> quantitation <strong>of</strong><br />
iso lucine or o<strong>the</strong>r analytes. The elution order<br />
<strong>for</strong> N-substituted-1-alkylthioisoindole derivatives<br />
<strong>of</strong> primary amino acids <strong>and</strong> N α -(9-<br />
Fluorenylmethoxycarbonyl)-L-proline is also<br />
mentioned in (Table IV). The method was suitably<br />
optimized to have short chromatographic<br />
analysis time including derivatization <strong>for</strong> routine<br />
monitoring <strong>of</strong> large number <strong>of</strong> samples at<br />
industrial level.<br />
Effect <strong>of</strong> buffer concentration<br />
The effect <strong>of</strong> buffer concentration was investigated to attain<br />
sharp peak shape as well as estabilsh <strong>the</strong> order <strong>of</strong> elution with<br />
optimum resolution. Initially, 20 mM <strong>of</strong> sodium acetate in<br />
mobile phase A <strong>and</strong> 100 mM <strong>of</strong> sodium acetate in mobile phase B<br />
were tested, however, <strong>the</strong> resolution between aspartic acid <strong>and</strong><br />
glutamic acid was less than 0.5 with a broad peak. Fur<strong>the</strong>rmore,<br />
different combinations <strong>of</strong> mobile phase A <strong>and</strong> B were tried by<br />
varying <strong>the</strong> concentration <strong>of</strong> sodium acetate, but <strong>the</strong> resolution<br />
between <strong>the</strong> peaks 6 <strong>and</strong> 7; 16 <strong>and</strong> 17 was not adequate. Finally,<br />
17 mM sodium acetate in mobile phase A <strong>and</strong> 85 mM sodium<br />
acetate in mobile phase B gave <strong>the</strong> best resolution <strong>and</strong> peak<br />
shape <strong>for</strong> all <strong>the</strong> analytes. The resolution factor obtained between<br />
aspartic acid <strong>and</strong> glutamic acid was 1.08 (Figure 2A).<br />
Effect <strong>of</strong> column oven temperature<br />
The effect <strong>of</strong> column oven temperature was also investigated<br />
to achieve optimal resolution. At 25°C, <strong>the</strong> separation <strong>of</strong> peaks 1<br />
<strong>and</strong> 2 (aspartic acid <strong>and</strong> glutamic acid); peaks 6 <strong>and</strong> 7 (phenyl alanine<br />
<strong>and</strong> iso leucine) <strong>and</strong> peaks 16 <strong>and</strong> 17 (histidine <strong>and</strong> lycine)<br />
were insufficient with resolution factor < 0.5. Raising <strong>the</strong> temperature<br />
to 30°C helped in resolving peak 6 <strong>and</strong> 7; 16 <strong>and</strong> 17 with<br />
Figure 3. Chromatogram at column oven temperature 40°C, showing resolution between co-eluting<br />
amino acid, peak 1 <strong>and</strong> 2 (aspartic acid <strong>and</strong> glutamic acid), peak 6 <strong>and</strong> 7 (histidine <strong>and</strong> glycine) <strong>and</strong><br />
peak 16 <strong>and</strong> 17 (phenylalanine <strong>and</strong> iso Leucine).<br />
Table V. Linearity, Precision, Recovery, LOD, <strong>and</strong> LOQ <strong>for</strong> 17 Amino Acids<br />
Amino FLD coefficient Precision † Recovery LOD LOQ<br />
acid <strong>of</strong> linearity* (r 2 ) (%RSD) (%) (ng/mL) (ng/mL)<br />
Aspartic Acid 0.99979 2.23 101.32 70.02 212.18<br />
Glutamic Acid 0.99715 0.26 89.28 46.58 141.17<br />
Aspargine 0.99820 3.50 97.63 53.28 161.45<br />
Serine 0.99942 3.96 102.22 196.05 594.08<br />
Glutamine 0.99953 4.48 100.51 40.27 122.02<br />
Histidine 0.99095 1.29 96.27 102.34 310.10<br />
Glycine 0.99969 3.68 91.51 182.95 554.40<br />
Threonine 0.99851 2.59 97.64 89.36 270.80<br />
Alanine 0.99792 3.25 96.70 40.52 122.77<br />
Arginine 0.99142 3.99 109.50 34.17 103.57<br />
Tyrosine 0.99462 1.68 90.26 64.111 94.27<br />
Valine 0.99617 1.06 99.50 63.03 191.01<br />
Methionine 0.99740 3.63 112.07 49.28 149.32<br />
Tryptophan 0.99978 0.07 100.61 45.57 138.08<br />
Phenylalanine 0.99610 2.32 95.13 58.78 178.13<br />
Isoleucine 0.99364 4.36 97.45 96.96 293.82<br />
Leucine 0.99765 2.77 103.62 36.61 110.95<br />
* Linearity from 0.5 to 2.5 µg/mL.<br />
† Precision (RSD) <strong>of</strong> peak area <strong>for</strong> three replicates.<br />
121
a factor greater than 1.0. Finally, optimizing <strong>the</strong> temperature at<br />
40°C resulted in baseline separation <strong>of</strong> all twenty amino acids<br />
(Figure 3).<br />
Specificity<br />
The specificity <strong>of</strong> <strong>the</strong> method was demonstrated by analyzing<br />
<strong>the</strong> blank <strong>and</strong> matrix following <strong>the</strong> proposed derivatization procedure.<br />
No interference was found <strong>for</strong> any <strong>of</strong> <strong>the</strong> amino acid peak<br />
in blank <strong>and</strong> matrix sample (Figure 2A <strong>and</strong> 2B). The method is<br />
specific <strong>for</strong> simultaneous identification (20) <strong>and</strong> quantification<br />
(17) <strong>of</strong> amino acids.<br />
Table VI. Results <strong>of</strong> Three Batches <strong>of</strong> Biological Media<br />
Amino Actual Amino acid obtained (µg/mL)<br />
acid amount B 1 B 2 B 3<br />
ASP 13.00 13.17 13.25 13.03<br />
GLU 14.70 13.12 12.96 13.31<br />
ASN 15.00 14.64 14.73 14.79<br />
SER 10.50 10.73 10.55 10.63<br />
GLN 146.00 146.74 145.61 146.30<br />
HIS 20.96 20.17 19.96 20.58<br />
GLY 7.50 6.86 6.90 6.80<br />
THR 11.90 11.62 11.69 11.31<br />
ALA 9.00 8.70 8.57 8.52<br />
ARG 211.00 231.05 221.55 224.15<br />
TYR 7.78 7.22 7.18 7.34<br />
VAL 11.70 11.64 11.84 11.14<br />
MET 4.48 5.02 4.90 4.98<br />
TRP 1.04 1.05 1.06 1.02<br />
PHE 4.96 4.72 4.58 4.72<br />
ILE 3.94 3.84 3.87 3.84<br />
LEU 13.00 13.47 13.16 12.78<br />
Figure 4. Linearity graph <strong>of</strong> 17 amino acids.<br />
Figure 5. Typical chromatogram <strong>of</strong> a biological sample.<br />
122<br />
Journal <strong>of</strong> Chromatographic Science, Vol. 49, February 2011<br />
Linearity, LOD, <strong>and</strong> LOQ<br />
The linearity was determined by linear least square regression<br />
on five spiked st<strong>and</strong>ard solutions at 0.5, 1.0, 1.5, 2.0, <strong>and</strong> 2.5<br />
µg/mL concentration as shown in Figure 4. Correlation coefficient<br />
found <strong>for</strong> seventeen amino acids was greater than 0.99<br />
(Table V) which is within <strong>the</strong> acceptance criteria. The LOD <strong>and</strong><br />
LOQ <strong>for</strong> all amino acids is also summarized in <strong>the</strong> same table.<br />
Precision <strong>and</strong> accuracy<br />
The precision <strong>of</strong> <strong>the</strong> method was determined by three test<br />
solutions <strong>of</strong> 2.5 µg/mL concentration in matrix. The peak area<br />
calculated was very wide due to complexity <strong>of</strong> media, thus <strong>the</strong><br />
precision (%RSD) was kept at 5.0% (Table V). The precision<br />
obtained <strong>for</strong> retention time was less than 0.50% <strong>for</strong> five determinations<br />
as shown in Table IV.<br />
The accuracy or recovery was done by spiking amino acids to<br />
complex biological media, corresponding to <strong>the</strong> amount fed to<br />
<strong>the</strong> cell line. The average recovery <strong>for</strong> different amino acids<br />
obtained was between 90% <strong>and</strong> 110% except methionine <strong>and</strong><br />
glutamic acid, which 112.07% <strong>and</strong> 89.28% respectively. Hence<br />
<strong>the</strong> limit was set between 87% <strong>and</strong> 113% <strong>for</strong> all <strong>the</strong> amino acids.<br />
Sample analysis<br />
The three consecutive batches <strong>of</strong> biological media samples<br />
were analyzed as per <strong>the</strong> described procedure. The required<br />
quantity <strong>of</strong> seventeen amino acids were weighed <strong>and</strong> diluted with<br />
biological media to feed up cell line <strong>for</strong> growth <strong>of</strong> <strong>the</strong>rapeutic<br />
protein. The chromatographic separation <strong>of</strong> each amino acids in<br />
<strong>the</strong> biological media (Figure 5) was similar to <strong>the</strong> composite<br />
st<strong>and</strong>ard solution. The individual amounts <strong>of</strong> amino acid found<br />
in three different batches are presented in Table VI. The results<br />
show good agreement <strong>of</strong> accuracy <strong>and</strong> reproducibility<br />
compared to added amount.<br />
Conclusion<br />
The analytical method described is suitable <strong>for</strong><br />
rapid <strong>and</strong> highly sensitive determination <strong>of</strong> primary<br />
<strong>and</strong> secondary amino acid present in complex<br />
biological media. The major advantage <strong>of</strong><br />
this method is <strong>the</strong> short analysis time (< 19 min)<br />
required <strong>for</strong> separation <strong>of</strong> 20 amino acids. The<br />
method <strong>of</strong>fers excellent linear <strong>and</strong> quantitation<br />
range, as well recovery <strong>for</strong> simultaneous identification<br />
<strong>of</strong> twenty amino acid <strong>and</strong> quantification <strong>of</strong><br />
seventeen baseline resolved amino acid using<br />
HPLC-Fluorescence. The automated pre-column<br />
derivatization procedure toge<strong>the</strong>r with a simple<br />
<strong>and</strong> economical mobile phase makes this method<br />
highly attractive <strong>for</strong> routine high throughput<br />
analysis.<br />
Acknowledgement<br />
We are thankful to <strong>the</strong> management <strong>of</strong> Zydus<br />
Research Centre <strong>and</strong> Zydus Group <strong>for</strong> <strong>the</strong> con-
Journal <strong>of</strong> Chromatographic Science, Vol. 49, February 2011<br />
stant encouragement <strong>and</strong> support during <strong>the</strong> course <strong>of</strong> <strong>the</strong> study.<br />
Thanks are due to analytical research laboratory scientists <strong>for</strong><br />
<strong>the</strong>ir technical inputs, <strong>and</strong> <strong>the</strong> biotechnology department <strong>and</strong><br />
library staff <strong>for</strong> <strong>the</strong>ir kind support.<br />
References<br />
1. A.M. El-Brashy <strong>and</strong> S.M. Al-Ghannam. High per<strong>for</strong>mance liquid<br />
chromatographic determination <strong>of</strong> some amino acids after derivatisation<br />
with 2-Hydroxy-1-naphthaldehyde. Analyst 122: 147–150<br />
(1997).<br />
2. S. Moore <strong>and</strong> W.H. Stein. Chromatography <strong>of</strong> amino acids on<br />
sulphonated polystyrene resins. J. Biol. Chem. 192: 663–681 (1951).<br />
3. M. Rubenstein, S. Chen-Kiang, S. Stein, <strong>and</strong> S. Undenfriend.<br />
Characterization <strong>of</strong> proteins <strong>and</strong> peptides by high-per<strong>for</strong>mance<br />
liquid chromatography <strong>and</strong> fluorescence monitoring <strong>of</strong> <strong>the</strong>ir tryptic<br />
digests. Anal. Biochem. 95: 117–121 (1979).<br />
4. J.R. Benson <strong>and</strong> P.E. Haret. o-Phthalaldehyde: fluorogenic detection<br />
<strong>of</strong> primary amines in <strong>the</strong> picomole range. Comparison with fluorescamine<br />
<strong>and</strong> ninhydrin. Proc. Natl. Acad. Sci. 72: 619–622<br />
(1975).<br />
5. P. Fürst, L. Pollack, T.A. Graser, H. Godel, <strong>and</strong> P. Stehle. Appraisal <strong>of</strong><br />
four pre-column derivatisation methods <strong>for</strong> <strong>the</strong> high-per<strong>for</strong>mance<br />
liquid chromatographic determination <strong>of</strong> free amino acids in biological<br />
materials. J. Chromatogr. 499: 557–569 (1990).<br />
6. M.A. Sanz, G. Castillo, <strong>and</strong> A. Hernández. Isocratic high-per<strong>for</strong>mance<br />
liquid chromatographic method <strong>for</strong> quantitative determination<br />
<strong>of</strong> lysine, histidine <strong>and</strong> tyrosine in foods. J. Chromatogr. 719:<br />
195–201 (1996).<br />
7. Alegrfa, R. Barberfi, R. Farro, M. Ferreros, M.J. Lagarda, <strong>and</strong><br />
J.C. Ldpez. Isocratic high-per<strong>for</strong>mance liquid chromatographic<br />
determination <strong>of</strong> tryptophan in infant <strong>for</strong>mulas. J. Chromatogr. 721:<br />
83–88 (1996).<br />
8. R. Soto-Otero, E. Mendez-Alvarez, J. Galan-Valiente, E. Aguilar-<br />
Veiga, <strong>and</strong> G. Sierra-Marcuno. Quantitative analysis <strong>of</strong> neuroactive<br />
amino acids in brain tissue by liquid chromatography using fluorescent<br />
pre-column labelling with o-phthalaldehyde <strong>and</strong> N-acetyl-Lcysteine.<br />
Biomed. Chromatogr. 8: 114–118 (1994).<br />
9. H. Birwe <strong>and</strong> A. Hesse. High-per<strong>for</strong>mance liquid chromatographic<br />
determination <strong>of</strong> urinary cysteine <strong>and</strong> cystine. Clin. Chim. Acta. 199:<br />
33–42 (1991).<br />
10. J.R. Cronin, S. Pizzarello, <strong>and</strong> W.E. G<strong>and</strong>y. Amino acid analysis<br />
with o-phthalaldehyde detection: Effects <strong>of</strong> reaction temperature<br />
<strong>and</strong> thiol on fluorescence yields. Anal. Biochem. 93: 174–179<br />
(1979).<br />
11. S. S. Simons Jr. <strong>and</strong> D. F. Johnson. The structure <strong>of</strong> <strong>the</strong> fluorescent<br />
adduct <strong>for</strong>med in <strong>the</strong> reaction <strong>of</strong> o-phthalaldehyde <strong>and</strong> thiols with<br />
amines. J. Am. Chem. Soc. 98: 7098–7099 (1976).<br />
12. J. Kirschbaum, B. Lucas, <strong>and</strong> W.-D. Beinert. Pre-column derivatization<br />
<strong>of</strong> biogenic amines <strong>and</strong> amino acids with 9-fluorenylmethyl<br />
chloro<strong>for</strong>mate <strong>and</strong> heptylamine. J. Chromatogr. 661: 193–199<br />
(1994).<br />
13. International conference on harmonization (ICH), Q2 (R1),<br />
Validation <strong>of</strong> Analytical Procedure, Text <strong>and</strong> Methodology, Version-<br />
4. November, 2005.<br />
14. M.G. Gioi, P. Andreatta, S. Boschetti, <strong>and</strong> R. Gatti. Development<br />
<strong>and</strong> validation <strong>of</strong> a liquid chromatographic method <strong>for</strong> <strong>the</strong> determination<br />
<strong>of</strong> branched-chain amino acids in new dosage <strong>for</strong>ms.<br />
J. Phram. Biomed Anal. 45: 456–464 (2007).<br />
15. H. G. Wor<strong>the</strong>n <strong>and</strong> H. Liu. Automatic pre-column derivatisation<br />
<strong>and</strong> reversed-phase high per<strong>for</strong>mance liquid chromatography <strong>of</strong><br />
primary <strong>and</strong> secondary amino acids in plasma with photo-diode<br />
array <strong>and</strong> fluorescence detection. J. Liq. Chromatogr. Rel. Tech. 15:<br />
3323–3341 (1992).<br />
Manuscript received May 31, 2009;<br />
revision received August 14, 2009.<br />
123