Determination of Volatile Aroma Compounds of Blaufrankisch Wines ...
Determination of Volatile Aroma Compounds of Blaufrankisch Wines ...
Determination of Volatile Aroma Compounds of Blaufrankisch Wines ...

Create successful ePaper yourself
Turn your PDF publications into a flip-book with our unique Google optimized e-Paper software.
Journal <strong>of</strong> Chromatographic Science, Vol. 36, October 1998<br />
<strong>Determination</strong> <strong>of</strong> <strong>Volatile</strong> <strong>Aroma</strong> <strong>Compounds</strong> <strong>of</strong><br />
<strong>Blaufrankisch</strong> <strong>Wines</strong> Extracted by Solid-Phase<br />
Microextraction<br />
G. Vas 1<br />
, L Gál 1<br />
, J. Harangi 2<br />
, A. Dobo 3<br />
, and K. Vékey 3<br />
1<br />
Research Institute for Viticulture and Enology, H-3301 Eger Kólyukteto, P.O. Box 83, Hungary; 2<br />
Hewlett Packard Hungary, Budapest Erzsébet<br />
királyné útja 1/C, Hungary; and institute <strong>of</strong> Chemistry, Hungarian Academy <strong>of</strong> Sciences, Η-Ί 025 Budapest, Pusztaszeri ut 59-67, Hungary<br />
Abstract<br />
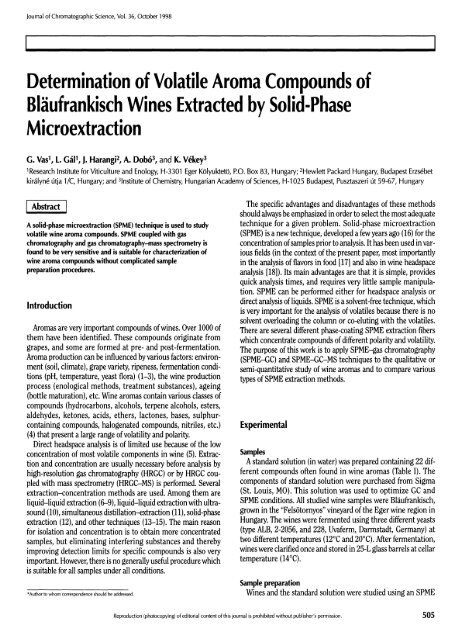
A solid-phase microextraction (SPME) technique is used to study<br />
volatile wine aroma compounds. SPME coupled with gas<br />
chromatography and gas chromatography-mass spectrometry is<br />
found to be very sensitive and is suitable for characterization <strong>of</strong><br />
wine aroma compounds without complicated sample<br />
preparation procedures.<br />
Introduction<br />
<strong>Aroma</strong>s are very important compounds <strong>of</strong> wines. Over 1000 <strong>of</strong><br />
them have been identified. These compounds originate from<br />
grapes, and some are formed at pre- and post-fermentation.<br />
<strong>Aroma</strong> production can be influenced by various factors: environment<br />
(soil, climate), grape variety, ripeness, fermentation conditions<br />
(pH, temperature, yeast flora) (1-3), the wine production<br />
process (enological methods, treatment substances), ageing<br />
(bottle maturation), etc. Wine aromas contain various classes <strong>of</strong><br />
compounds (hydrocarbons, alcohols, terpene alcohols, esters,<br />
aldehydes, ketones, acids, ethers, lactones, bases, sulphurcontaining<br />
compounds, halogenated compounds, nitriles, etc.)<br />
(4) that present a large range <strong>of</strong> volatility and polarity.<br />
Direct headspace analysis is <strong>of</strong> limited use because <strong>of</strong> the low<br />
concentration <strong>of</strong> most volatile components in wine (5). Extraction<br />
and concentration are usually necessary before analysis by<br />
high-resolution gas chromatography (HRGC) or by HRGC coupled<br />
with mass spectrometry (HRGC-MS) is performed. Several<br />
extraction-concentration methods are used. Among them are<br />
liquid-liquid extraction (6-9), liquid-liquid extraction with ultrasound<br />
(10), simultaneous distillation-extraction (11), solid-phase<br />
extraction (12), and other techniques (13-15). The main reason<br />
for isolation and concentration is to obtain more concentrated<br />
samples, but eliminating interfering substances and thereby<br />
improving detection limits for specific compounds is also very<br />
important. However, there is no generally useful procedure which<br />
is suitable for all samples under all conditions.<br />
*Author to whom correspondence should be addressed.<br />
The specific advantages and disadvantages <strong>of</strong> these methods<br />
should always be emphasized in order to select the most adequate<br />
technique for a given problem. Solid-phase microextraction<br />
(SPME) is a new technique, developed a few years ago (16) for the<br />
concentration <strong>of</strong> samples prior to analysis. It has been used in various<br />
fields (in the context <strong>of</strong> the present paper, most importantly<br />
in the analysis <strong>of</strong> flavors in food [17] and also in wine headspace<br />
analysis [18]). Its main advantages are that it is simple, provides<br />
quick analysis times, and requires very little sample manipulation.<br />
SPME can be performed either for headspace analysis or<br />
direct analysis <strong>of</strong> liquids. SPME is a solvent-free technique, which<br />
is very important for the analysis <strong>of</strong> volatiles because there is no<br />
solvent overloading the column or co-eluting with the volatiles.<br />
There are several different phase-coating SPME extraction fibers<br />
which concentrate compounds <strong>of</strong> different polarity and volatility.<br />
The purpose <strong>of</strong> this work is to apply SPME-gas chromatography<br />
(SPME-GC) and SPME-GC-MS techniques to the qualitative or<br />
semi-quantitative study <strong>of</strong> wine aromas and to compare various<br />
types <strong>of</strong> SPME extraction methods.<br />
Experimental<br />
Samples<br />
A standard solution (in water) was prepared containing 22 different<br />
compounds <strong>of</strong>ten found in wine aromas (Table I). The<br />
components <strong>of</strong> standard solution were purchased from Sigma<br />
(St. Louis, MO). This solution was used to optimize GC and<br />
SPME conditions. All studied wine samples were <strong>Blaufrankisch</strong>,<br />
grown in the "Felsotornyos" vineyard <strong>of</strong> the Eger wine region in<br />
Hungary. The wines were fermented using three different yeasts<br />
(type ALB, 2-2056, and 228, Uvaferm, Darmstadt, Germany) at<br />
two different temperatures (12°C and 20°C). After fermentation,<br />
wines were clarified once and stored in 25-L glass barrels at cellar<br />
temperature (14°C).<br />
Sample preparation<br />
<strong>Wines</strong> and the standard solution were studied using an SPME<br />
Reproduction (photocopying) <strong>of</strong> editorial content <strong>of</strong> this journal is prohibited without publisher's permission. 505
technique according to the following protocol. Wine (125 mL)<br />
was put into a 130-mL sampling bottle. The extraction fiber was<br />
inserted into the headspace and held in place for 10 min or, alternatively,<br />
immersed in the liquid for 1 h at ambient temperature<br />
(22°C). During sampling, the liquid phase was stirred with a<br />
magnetic stirrer at 200 rpm. During this time, aroma compounds<br />
were adsorbed and concentrated in the extraction fiber.<br />
After sampling, the fiber was manually inserted into the hot<br />
(250°C) GC injector for 5 min, where the compounds were desorbed<br />
and entered into the capillary GC column for analysis.<br />
Two different SPME extraction fibers were used with an apolar<br />
polydimethylsiloxane (PDMS) and a polar polyacrylate (PA)<br />
phase coating (Supelco, Bellefonte, PA). Film thicknesses were<br />
100 μm and 85 μm, respectively. PDMS coating is primarily suitable<br />
for extracting apolar compounds, and PA coating is primarily<br />
suitable for extracting polar compounds.<br />
For comparison, a "classical" and <strong>of</strong>ten-utilized solventsolvent<br />
extraction method was also used. A wine sample (200<br />
mL) was extracted three times with 60 mL organic solvent<br />
(n-pentane-dichloro-methane, 1:2). The organic phase was dried<br />
with anhydrous Na 2SO 4. The extract was concentrated to 500 μL<br />
with a Vigreux-column apparatus at 40°C. To obtain a more concentrated<br />
sample, the aroma extract was concentrated to 100 μL<br />
under continuous N 2 at -15 to -20°C. From this extract, a 1-μL<br />
aliquot was directly injected manually into the GC injector. To<br />
avoid overloading the column with these samples, a 1:50 split,<br />
ratio had to be used.<br />
Table I. List <strong>of</strong> Standard <strong>Compounds</strong> Relative Sensitivities Using Different Sampling Techniques<br />
Journal <strong>of</strong> Chromatographic Science, Vol. 36, October 1998<br />
GC and MS<br />
Semi-quantitation (peak area measurement) was performed<br />
using GC with a flame ionization detector (FID). A Hewlett-<br />
Packard (Palo Alto, CA) 5890 series II GC equipped with a twochannel<br />
electronic pressure control and an FID detector was<br />
used with a J&W Scientific (Folsom, CA) 40-m × 0.182-mm<br />
fused-silica capillary column coated with a poly-ethylene-glycol<br />
(PEG) stationary phase (0.30-pm film thickness). The injector<br />
and the FID detector temperatures were 250°C. The splitless<br />
purge valve was closed for 5 min. The carrier gas was hydrogen<br />
(UCAR, Cleveland, OH, purity 5.5). The gas flow was 1.42<br />
mL/min. The temperature program <strong>of</strong> the GC was as follows: initial<br />
temperature, 35°C, held 5 min; first ramp, 5°C/min to 100°C,<br />
held 0 min; second ramp, 3°C/min to 200°C held 1 min; third<br />
ramp, 20°C/min to 240°C, held 2 min.<br />
The compounds were identified by GC-MS and by Kováts<br />
retention indices. In these analyses, the same GC with a Hewlett-<br />
Packard 5972 mass-selective detector in electron impact ionization<br />
mode (70 eV) was used. The temperature <strong>of</strong> the GC-MS<br />
transfer line was 200°C, and the source temperature was 140°C.<br />
GC run parameters were the same as previously described,<br />
except that the carrier gas was He. Retention indices were calculated<br />
twice a day from retention times using external calibration,<br />
utilizing s<strong>of</strong>tware written by János Harangi (Hewlett-Packard,<br />
Budapest, Hungary). The calibration mixture contained 20<br />
aliphatic hydrocarbons (C 8-C 27). Day-to-day reproducibility <strong>of</strong><br />
retention index determination was ± 1 unit.<br />
SPME headspace sampling<br />
using 100-μm PDMS fiber Solvent-solvent extraction<br />
Retention Standard Relative Relative<br />
Compound name index Abbreviation concentration (ppb) RSD% sensitivity RSD% sensitivity<br />
Acetaldehyde 538 A 50 15.4 1.7 25.6 280.8<br />
Ethyl acetate 715 Β 50 10.8 0.8 143.9 88.8<br />
Ethanol 868 C 1000000 9.7 0.003 29.6 0.001<br />
Ethyl butanoate 1044 D 10 9.1 9.2 29 98.0<br />
Butylacetate 1075 Ε 50 8.7 3.8 29.6 5.4<br />
2-Methyl-propanol 1114 Ε 50 ND 28.8 3.7<br />
Isoamyl acetate 1126 G 50 3.8 9.5 32 4.6<br />
Butanol 1163 Η 50 2.8 10.5 27.8 2.4<br />
Hexyl acetate 1282 I 10 1.6 58.6 31.4 9.0<br />
Ethyl lactate 1356 J 50 9.5 1.7 47.1 2.2<br />
Hexanol 1363 Κ 50 4.3 1.7 28 6.4<br />
3-Hexen-1-ol(Z) 1375 L 25 4.5 2.7 28.1 6.6<br />
3-Hexen-1-ol (E) 1392 Μ 25 6.8 4.5 42.7 15.6<br />
Ethyl octanoate 1436 Ν 10 4.7 100.0 76.2 45.0<br />
Acetic acid 1463 Ο 100 8.1 6.1 32.3 0.8<br />
Linalool 1535 Ρ 10 5.2 21.6 139 36.2<br />
Linalyl acetate 1563 R 10 9 284.2 27.1 19.0<br />
Ethyl decanoate 1646 S 10 5.7 105.0 30 8.4<br />
Diethyl succinate 1698 Τ 50 8.4 4.9 19 9.6<br />
Terpineol 1715 υ 10 7.6 4.9 50.6 9.6<br />
Citronellol 1779 χ 10 7.7 3.7 28.6 4.9<br />
Phenethylacetate 1833 Υ 10 4.8 12.1 28.8 20.7<br />
Gearniol 1873 ν 10 6 6.6 30.4 15.2<br />
Benzyl alcohol 1893 ζ 50 11 1.2 28.9 10.6<br />
Phenethyl alcohol 1929 W 10 3 4.8 24.8 30.0<br />
506
Journal <strong>of</strong> Chromatographic Science, Vol. 36, October 1998<br />
Statistical calculations and calibration<br />
Data presented in this paper represent the average <strong>of</strong> three<br />
parallel measurements except when mentioned otherwise.<br />
Reproducibility is defined as the relative standard deviation <strong>of</strong><br />
data expressed in percentages. Semi-quantitation was performed<br />
by comparing relative peak areas observed using FID detection.<br />
The results (Tables I—III) are expressed in percentages relative to<br />
the peak area <strong>of</strong> ethyl octanoate observed using headspace analysis<br />
with PDMS fibers. This implies that the numbers given in<br />
Tables II and III are proportional to the amount <strong>of</strong> compounds<br />
injected onto the column, but the relative sensitivity <strong>of</strong> FID and<br />
extraction efficiency for individual components are not taken<br />
into account. The combined effects <strong>of</strong> FID sensitivity and extraction<br />
efficiency for individual compounds are characterized in<br />
Table I in a semi-quantitative manner: peak areas divided by the<br />
concentration in solution and compared again to that <strong>of</strong> ethyl<br />
octanoate using headspace analysis with PDMS fiber. Estimation<br />
<strong>of</strong> the quantity <strong>of</strong> individual components in the wine samples (in<br />
ppm or mg/L) has not been attempted.<br />
Results and Discussion<br />
<strong>Wines</strong> produced under different fermentation conditions were<br />
analyzed by headspace and immersion analysis using SPME-<br />
GC-FID and SPME-GC-MS. SPME exhibits selectivity, concentrating<br />
different wine components to various degrees. Relative<br />
sensitivity and reproducibility (as described in the Experimental<br />
section) <strong>of</strong> the SPME technique (headspace analysis with PDMS<br />
Table II. Semi-Quantitative Comparison <strong>of</strong> Different Extraction Methods in the Case <strong>of</strong> a <strong>Blaufrankisch</strong> Wine Fermented at<br />
20°C Using ALB Yeast*<br />
Compound name Retention index Abbreviation Headspace PDMS Immersed PDMS Immersed PA Solvent extracted<br />
Acetaldehyde 538 1 0.3 0.4 0.8 1.4<br />
Ethyl acetate 715 2 9.4 6.8 4.4 1.1<br />
Methanol 746 3 0.5 0.4 1.1 12.4<br />
Ethanol 868 4 408.8 360.3 989.4 808.7<br />
Propanol 905 5 15.5 4.2 0.0 0.1<br />
Butyl acetate 1075 6 0.4 0.1 0.0 0.0<br />
2-Methyl-propanol 1114 7 3.0 2.1 4.7 26.8<br />
Isoamyl acetate 1126 8 7.7 6.4 1.7 0.6<br />
Butanol 1163 9 0.1 0.0 0.0 0.0<br />
2-Methyl-1 -butanol 1220 10 8.8 0.2 13.4 0.0<br />
3-Methyl-1 -butanol 1223 11 42.1 7.1 59.3 316.7<br />
Ethyl hexanoate 1238 12 12.5 40.8 3.1 0.4<br />
3-Hydroxy-2-butanone 1336 13 0.3 0.2 0.1 0.2<br />
Ethyl lactate 1356 14 0.7 0.7 1.4 24.4<br />
Hexanol 1363 15 1.4 1.1 2.2 2.7<br />
3-Hexen-1-ol (E) 1392 16 0.5 0.3 0.2 0.1<br />
Ethyl octanoate 1436 17 100.0 40.3 9.0 0.3<br />
Isoamyl hexanoate 1440 18 2.6 0.5 0.4 12.3<br />
Acetic acid 1452 19 1.6 5.8 5.6 0.2<br />
Benzaldehyde 1518 21 0.5 0.6 0.8 0.1<br />
Linalool 1548 22 0.3 0.1 0.1 0.0<br />
5-Methyl-furfural 1590 23 1.1 0.5 0.7 0.0<br />
Ethyl decanoate 1646 24 61.1 12.9 4.6 4.0<br />
Isoamyl octanoate 1663 25 1.3 0.3 19.8 0.0<br />
Diethyl succinate 1698 26 2.3 0.7 0.7 1.6<br />
Terpineol 1715 27 0.1 0.2 0.2 0.1<br />
Citronellol 1779 28 0.1 0.2 0.1 0.3<br />
Ethyl dodecanoate 1850 29 3.7 0.9 0.3 0.0<br />
Hexanoic acid 1857 30 0.3 0.4 2.7 1.8<br />
Geraniol 1868 31 0.4 0.1 0.2 0.0<br />
Benzyl-alcohol 1893 32 0.1 0.5 0.6 0.5<br />
Phenethyl-alcohol 1929 33 5.8 6.7 44.2 68.2<br />
Ethyl tetradecanoate 2072 34 2.0 3.0 14.9 2.2<br />
Glycerin 2358 35 28.6 102.3 47.9 1.3<br />
Unknown 1448 20 0.2 2.8 0.4 0.0<br />
Unknown 1554 36 0.5 8.2 3.1 12.6<br />
Unknown 1598 37 0.7 3.1 1.4 2.8<br />
Unknown 2201 38 2.2 10.6 9.0 0.0<br />
* Peak areas are scaled to that <strong>of</strong> ethyl octanoate (= 100) observed using headspace analysis with a PDMS fiber.<br />
507
fiber) and solvent-solvent extraction were compared using the<br />
standard. The results are listed in Table I. The chromatogram <strong>of</strong><br />
the standard solution using SPME headspace analysis with a<br />
100-μm PDMS fiber is shown in Figure 1. The sensitivity is based<br />
on the peak areas divided by sample concentration in standard<br />
solution; relative sensitivity is compared to that <strong>of</strong> ethyl<br />
octanoate sampled by SPME. Under the experimental conditions<br />
employed, the approximate detection limit for some components<br />
is in the low-ppt level (ethyl-octanoate, ethyl-decanoate, terpenealcohols,<br />
β-phenethyl-alcohol); for some other components, it is<br />
in the low-ppb level (ethyl-acetate, alcohols). The reproducibility<br />
<strong>of</strong> the technique was also checked. Depending on the aroma<br />
components, these were found to be between 1 and 15% relative<br />
standard deviation (RSD). The values are listed in Table I.<br />
Journal <strong>of</strong> Chromatographic Science, Vol. 36, October 1998<br />
Reproducibility <strong>of</strong> solvent-solvent extraction is poorer than that<br />
<strong>of</strong> SPME. Immersion analysis with a PDMS fiber shows surprisingly<br />
lower sensitivity than headspace analysis for most aroma<br />
components. However, polar compounds <strong>of</strong> low volatility (glycerine,<br />
for example) are detected with better sensitivity using<br />
immersion rather than headspace analysis. Immersion analysis<br />
<strong>of</strong> Bläufrankisch wine (Table II) with a PA fiber shows a similar<br />
overall sensitivity to that <strong>of</strong> the PDMS fiber. The selectivity for<br />
various components <strong>of</strong> the aroma mixture is significantly different<br />
using the two different fibers (19), which may be an advantage<br />
in the detection <strong>of</strong> individual aroma components.<br />
Headspace analysis with a PA fiber has a lower sensitivity over<br />
two orders <strong>of</strong> magnitude and therefore is not suitable for wine<br />
aroma characterization. For this reason, these data are not<br />
Table III. Semi-Quantitative Comparison <strong>of</strong> <strong>Aroma</strong> Components <strong>of</strong> Bläufrankisch <strong>Wines</strong> Produced by Different Fermentation<br />
Conditions Using PDMS Headspace Analysis*<br />
Fermentation type<br />
Compound name Retention index Abbreviation ALB (20°C) 2-2056 (20°C) 228 (20°C) ALB (12°C) 2-2056 (12°C) 228 (12°C)<br />
Acetaldehyde 538 1 0.3 0.5 0.3 0.6 0.6 0.6<br />
Ethyl acetate 715 2 9.4 7.2 10.1 9.2 10.6 9.6<br />
Methanol 746 3 0.5 0.3 0.5 0.4 0.4 0.4<br />
Ethanol 868 4 408.8 361.8 381.4 353.0 351.3 384.1<br />
Propanol 905 5 15.5 0.0 0.0 0.0 0.0 0.0<br />
Butyl acetate 1075 6 0.4 0.2 0.6 0.2 0.4 0.4<br />
2-Methyl-propanol 1114 7 3.0 3.0 3.7 3.0 3.1 3.4<br />
Isoamyl acetate 1126 8 7.7 6.6 6.3 8.3 7.6 7.0<br />
Butanol 1163 9 0.1 0.1 0.1 0.0 0.0 0.0<br />
2-Methyl-1-butanol 1220 10 8.8 8.3 9.7 7.2 7.1 7.4<br />
3-Methyl-1 -butanol 1223 11 42.1 37.6 40.4 37.4 38.1 40.8<br />
Ethyl hexanoate 1238 12 12.5 12.0 11.9 13.4 14.7 13.6<br />
3-Hydroxy-2-butanone 1336 13 0.3 0.2 0.3 0.4 0.4 0.3<br />
Ethyl lactate 1356 14 0.8 0.5 0.6 0.3 0.3 0.2<br />
Hexanol 1363 15 1.4 1.3 1.4 1.6 1.5 1.5<br />
3-Hexen-1-ol (E) 1392 16 0.5 0.3 0.4 0.3 0.3 0.3<br />
Ethyl octanoate 1436 17 100.0 91.5 95.7 112.2 116.0 100.4<br />
Isoamyl hexanoate 1440 18 2.6 0.2 2.4 0.4 2.2 2.5<br />
Acetic acid 1452 19 1.6 3.5 1.4 2.6 2.7 2.6<br />
Benzaldehyde 1518 21 0.5 0.6 0.5 0.4 0.4 0.3<br />
Linalool 1548 22 0.3 0.3 0.3 0.3 0.3 0.3<br />
5-Methyl-furfural 1590 23 1.1 0.8 0.6 0.7 0.7 0.7<br />
Ethyl decanoate 1646 24 61.1 57.0 65.3 79.7 83.1 61.6<br />
Isoamyl octanoate 1663 25 1.4 1.3 1.7 1.9 2.1 1.7<br />
Diethyl succinate 1698 26 2.3 2.3 2.9 3.3 4.4 2.9<br />
Terpineol 1715 27 0.1 0.2 0.1 0.1 0.1 0.1<br />
Citronellol 1779 28 0.1 0.1 0.1 0.1 0.1 0.1<br />
Ethyl dodecanoate 1850 29 3.7 3.2 5.0 4.4 6.0 3.0<br />
Hexanoic acid 1857 30 0.3 0.3 0.3 0.5 0.5 0.5<br />
Geraniol 1868 31 0.4 0.5 0.7 0.5 0.7 0.4<br />
Benzyl-alcohol 1893 32 0.1 0.2 0.1 0.0 0.1 0.0<br />
Phenethyl-alcohol 1929 33 5.8 6.3 4.7 5.1 4.8 4.6<br />
Ethyl tetradecanoate 2072 34 2.0 2.1 2.2 2.4 2.5 2.2<br />
Glycerin 2358 35 28.6 14.6 14.2 1.0 1.7 1.0<br />
Unknown 1448 20 0.2 12.1 11.1 9.2 10.1 8.1<br />
Unknown 1554 36 0.5 3.1 0.3 0.2 0.3 0.2<br />
Unknown 1598 37 0.7 1.8 0.7 0.6 0.6 0.5<br />
Unknown 2201 38 2.2 14.4 1.0 0.0 0.0 0.0<br />
* Peak areas are scaled to that <strong>of</strong> ethyl octanoate (= 100) observed using headspace analysis with a PDMS fiber and ALB yeast at 20°C.<br />
508
Journal <strong>of</strong> Chromatographic Science, Vol. 36, October 1998<br />
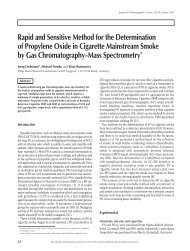
Figure 1. Headspace chromatogram <strong>of</strong> the standard solution using a 100-μm PDMS extraction fiber.<br />
Figure 2. Headspace chromatogram <strong>of</strong> Bläufrankisch wine using a 100-μm PDMS extraction fiber. This<br />
wine was produced by ALB (Uvaferm) yeast at 20°C fermentation temperature.<br />
Figure 3. Headspace chromatogram <strong>of</strong> Bläufrankisch wine using a 100-μm PDMS extraction fiber. This<br />
wine was produced by ALB (Uvaferm) yeast at 12°C fermentation temperature.<br />
shown in Table I. Among the techniques<br />
described, headspace analysis using a PDMS fiber<br />
seems most suitable for a rapid and general characterization<br />
<strong>of</strong> wine aromas.<br />
A typical gas chromatogram <strong>of</strong> the headspace<br />
<strong>of</strong> Bläufrankisch wine using SPME-GC-MS is<br />
shown in Figure 2. This wine was produced by<br />
the ALB yeast at 20°C. The chromatogram shows<br />
more than 100 peaks <strong>of</strong> significant intensity.<br />
More than 30 <strong>of</strong> the most abundant peaks were<br />
identified by their mass spectra and retention<br />
indices. A list <strong>of</strong> these is shown in Table II. This<br />
data, along with data shown in Table I, indicate<br />
that headspace analysis using SPME with a<br />
PDMS fiber is a very sensitive technique for the<br />
detection <strong>of</strong> ethyl-esters and terpene alcohols,<br />
which are important fragrance compounds. The<br />
technique provides good results for other aroma<br />
components as well. Immersion sampling with a<br />
100-μm PDMS fiber can extract a larger amount<br />
<strong>of</strong> polar compounds from wines. Its main disadvantage<br />
is that it is slower than headspace analysis<br />
(it requires more time to reach equilibrium<br />
conditions in the solvent phase than in the gas<br />
phase). Headspace analysis using a PA fiber has<br />
low sensitivity and is not recommended for wine<br />
analysis. Immersion sampling with PA fiber also<br />
has low sensitivity (except with alcohols). A further<br />
disadvantage is that the fiber is damaged<br />
after only approximately 20 analyses (in typical<br />
cases, fibers can be used for hundreds <strong>of</strong> analyses).<br />
This is probably caused by a very strong<br />
binding <strong>of</strong> polyphenols to this fiber.<br />
For comparison, a commonly used solventsolvent<br />
extraction was also performed (as detailed<br />
in the Experimental section); the results<br />
are shown in Table II. The presence <strong>of</strong> a solvent<br />
peak in the chromatogram is disadvantageous in<br />
this case because it limits the amount <strong>of</strong> sample<br />
which can be injected onto the column. This is,<br />
in fact, the reason for the 1:50 split ratio that had<br />
to be used following solvent-solvent extraction,<br />
whereas it is possible to use splitless injection<br />
with the SPME technique. Extraction is also<br />
more expensive and more time-consuming than<br />
that <strong>of</strong> the SPME technique.<br />
The results <strong>of</strong> the wine sample confirm the findings<br />
using the standard solution; SPME headspace<br />
analysis using a PDMS fiber is an advantageous<br />
analytical technique for fast, sensitive, and general<br />
qualitative and semi-quantitative characterization<br />
<strong>of</strong> wine aroma components. The following studies<br />
were performed using this technique.<br />
The influence <strong>of</strong> different fermentation conditions<br />
on the production <strong>of</strong> wine aromas was<br />
studied using three different yeasts in fermentation<br />
at two different temperatures. A semi-quantitative<br />
comparison <strong>of</strong> the data (peak areas <strong>of</strong><br />
509
main aroma compounds) is shown in Table III. Fermenting wine<br />
at 20°C using the three different yeast cultures resulted in wine<br />
aroma patterns which were very similar to each other. This correlates<br />
well with the sensory evaluation: the wines were tested by a<br />
52-member panel using a 20-point (positive) score sheet. The<br />
mean score for these wines were 17.7,17.4, and 17.5 (for ALB,<br />
2-2056, and 228, respectively), which indicates that these wines<br />
are <strong>of</strong> similar quality. At low-temperature fermentation, the concentration<br />
<strong>of</strong> some aroma compounds (e.g., isoamyl-acetate,<br />
ethyl hexanoate, ethyl octanoate, ethyl decanoate, isoamyl<br />
octanoate) is higher than that at high-temperature fermentation.<br />
However, at low temperature, a smaller number <strong>of</strong> aroma compounds<br />
are produced; there are over 110 peaks in the headspace<br />
chromatogram <strong>of</strong> wines fermented at 20°C,whereas there are<br />
only 80-90 in those obtained at 12°C. This is illustrated by a comparison<br />
<strong>of</strong> Figure 2 (ALB yeast at 20°C) with Figure 3 (ALB yeast<br />
at 12°C). In the case <strong>of</strong> low-temperature fermentation, the three<br />
yeast cultures produced characteristic differences in the wine<br />
aroma pattern. The score for sensory evaluation <strong>of</strong> wines fermented<br />
at low temperature is much worse (by 0.9 points, on<br />
average; 17.1,16.7, and 16.1 in the sequence previously mentioned).<br />
Panel discussion after tasting suggests that the main<br />
result <strong>of</strong> worse quality is a less "full-bodied" taste <strong>of</strong> these wines.<br />
Conclusion<br />
This study demonstrates that the SPME sample preparation<br />
technique coupled with GC analysis is well suited for a qualitative<br />
and semi-quantitative analysis <strong>of</strong> aroma compounds in<br />
wines. The results are suitable to compare and optimize fermentation<br />
conditions and can be correlated to sensory evaluation.<br />
SPME provides a simple, fast, sensitive, and reproducible alternative<br />
to solvent-solvent extraction and is especially well-suited<br />
to GC analysis using either FID or MS detection. Quantitation<br />
using standard solutions and a dilution series seems feasible,<br />
although it has not been the object <strong>of</strong> the present paper.<br />
Acknowledgments<br />
The authors would like to thank Hewlett-Packard for a temporary<br />
loan <strong>of</strong> their HP 6890 GC-MS system.<br />
References<br />
1. C. Lema, C. Garcia-Jares, I. Oriols, and L. Agnulo. Contributions <strong>of</strong><br />
saccharomyces and non-saccharomyces populations to the production<br />
<strong>of</strong> components os Albarino wine aroma. Am. J. Enol. Vitic. 47:<br />
206-16(1996).<br />
2. J. Mateo, M. Jimenez, T. Huerta, and A. Paster. Comparison <strong>of</strong><br />
volatiles produced by four Saccharomyces cerevisiae strains <strong>of</strong><br />
510<br />
Journal <strong>of</strong> Chromatographic Science, Vol. 36, October 1998<br />
some Monastrell musts. Am. J. Enol. Vitic. 43:206-209 (1992).<br />
3. P. Ribéreau-Gayon. New developments in wine microbiology. Am.<br />
J. Enol. Vitic. 36:1-10 (1985).<br />
4. A. Rapp. Wine <strong>Aroma</strong> Substances from Gas Chromatographic<br />
Analysis. In Wine Analysis, H.F. Linskens and J.F. Jackson, Eds.<br />
Springer-Verlag, Berlin, Germany, 1988, ρ 29-65.<br />
5. Μ. Shimoda, Τ. Shibamoto, and A.C. Noble. Evaluation <strong>of</strong> headspace<br />
volatiles <strong>of</strong> Cabernet Sauvignon wines sampled by an on<br />
column method. J. Agric. Food Chem. 41:1664-68 (1993).<br />
6. P.J. Hardy. Extraction and concentration <strong>of</strong> volatiles from dilute<br />
aqueous and aqueous-alcoholic solution using trichlor<strong>of</strong>luoromethane.<br />
J. Agric. Food Chem. 17:656-58 (1969).<br />
7. G. Vernin, C. Boniface, J. Metzger, D. Fraisse, D. Doan, and<br />
S. Alamercery. <strong>Aroma</strong>s <strong>of</strong> Syrah wines: Identification <strong>of</strong> volatile<br />
compounds by GC-MS spectra data bank and classification by statistical<br />
methods. Frontiers <strong>of</strong> Flavor, Proceedings <strong>of</strong> the 5th<br />
International Flavor Conference, Porto Karras, Chalkidiki, Greece,<br />
July 1-3,1987.<br />
8. A. Rapp, H. Hastrich, and H. Engel. Gas-chromatographic investigations<br />
on the aroma constituents <strong>of</strong> grape. Concentration and separation<br />
by capillary glass columns. Vitis 15:29-36 (1976).<br />
9. V. Ferreira, A. Rapp, J.F. Cacho, H. Hastrich, and I. Yavas. Fast and<br />
quantitative determination <strong>of</strong> wine flavor compounds using<br />
microextraction with Freon 113.J Agric. Food Chem. 41:1413-20<br />
(1993).<br />
10. C. Cocito, G. Gaetano, and C. Delfíni. Rapid extraction <strong>of</strong> aroma<br />
compounds in must and wine by means <strong>of</strong> ultrasound. Food<br />
Chemistry 52: 311-20 (1995).<br />
11. A.J. Nunez and J.M.H. Bemelmans. Recoveries from an aqueous<br />
model system using semi-micro steam distillation-solvent extraction<br />
procedure. J. Chromatogr. 294:361-65 (1984).<br />
12. G. Edwards and R.B. Beelman. Extraction and analysis <strong>of</strong> volatile<br />
compounds in white wines using Amberlite XAD-2 resin & capillary<br />
GC. J. Agric. Food Chem. 38:216-20 (1990).<br />
13. C. García-Jares, S. Garcia-Martm, and R. Cela-Torrijos. Analysis <strong>of</strong><br />
some highly volatile compounds <strong>of</strong> wine by means <strong>of</strong> purge and<br />
cold trapping injector capillary gas-chromatography. Application to<br />
the differentation <strong>of</strong> Rias Biaxas Spanish white wines. J. Agric. Food<br />
Chem. 43: 764-68 (1995).<br />
14. M.R. Salinas, G.L. Alonso, and F.J. Javier-Infantes. Adsorption<br />
thermal desorption gas-chromatography applied to the determination<br />
<strong>of</strong> wine aromas. J. Agric. Food Chem. 42:1328-31 (1994).<br />
15. Villén, F.J. Senoras, G. Reglero, and M. Herriaz. Analysis <strong>of</strong> wine<br />
aroma by direct injection gas-chromatography without previous<br />
extraction. J. Agric Food Chem. 43: 717-22 (1995).<br />
16. C.L. Arthur and J. Pawliszyn. Solid phase microextraction with<br />
thermal desorption using fused silica optical fibers. Anal. Chem. 62:<br />
2145-48 (1990).<br />
17. X. Yang and T. Peppard. Solid phase microextraction for flavor analysis.<br />
J. Agric. Food Chem. 42:1925-30 (1994).<br />
18. D.C. Garcia, S. Magnaghi, M. Reichenbacher, and K. Danzer.<br />
Systematic optimization <strong>of</strong> the wine bouquet components by solid<br />
phase microextraction. J. High Resol. Chromatogr. 19: 257-62<br />
(1996).<br />
19. W.M. Coleman, III. A study <strong>of</strong> the behavior <strong>of</strong> polar and nonpolar<br />
solid-phase microextraction fibers for the extraction <strong>of</strong> Maillard<br />
reaction products. J. Chromatogr. Sci. 35:245-58 (1997).<br />
20. G. Vas and K. Vékey. Rapid determination <strong>of</strong> aroma compounds in<br />
wines using solid phase microextraction (SPME)-GC-MS technique.<br />
14 th<br />
Informal Meeting on Mass Spectrometry proceedings,<br />
Padova, Italy, 1996, ρ 20.<br />
Manuscript accepted August 9,1998.