Measuring success - McKinsey & Company
Measuring success - McKinsey & Company
Measuring success - McKinsey & Company

You also want an ePaper? Increase the reach of your titles
YUMPU automatically turns print PDFs into web optimized ePapers that Google loves.
Proprietary and asset-backed<br />
trading dominate activity<br />
At the top-line level, key performance indicators<br />
vary significantly both in absolute<br />
and relative terms. For example, the largest<br />
player in the sample netted more than E500<br />
million in revenues produced by the trading<br />
team while the smallest player only recorded<br />
some E10 million. Likewise, productivity<br />
varies greatly: the best-performing players<br />
boast productivity significantly above E10<br />
million in net revenues per trader, while less<br />
sophisticated players have a productivity that<br />
is roughly three times lower.<br />
A closer look at the various trading activities<br />
paints a similar picture in terms of<br />
divergence in key performance indicators.<br />
Interestingly, most of the players focus on<br />
either asset-backed or proprietary trading,<br />
while structured products/origination is<br />
still a rare occurrence within the observed<br />
players. Remuneration levels for asset-backed<br />
and proprietary trading are very different.<br />
Companies that excel in both are those<br />
who have clearly separated these activities,<br />
thereby managing the inherent conflict in<br />
terms of skill set and trader remuneration<br />
schemes (see figure 3).<br />
The maturity of proprietary trading instruments<br />
is also an excellent differentiator<br />
between asset-backed-focused and proprietary-focused<br />
players. Typically, proprietary-focused<br />
players have longer maturity<br />
contracts (more than six months) than those<br />
that are focused on asset-backed trading.<br />
A reason is that in financial contracts, the<br />
greatest leverage is in longer-term contracts<br />
due to the higher uncertainty involved. This<br />
higher level of risk requires a higher skill<br />
set, leading to the fact that primarily only<br />
proprietary traders trade actively long-term<br />
contracts. Contract types traded also differ<br />
between the two types of traders. While<br />
proprietary-focused players use all instruments,<br />
asset-backed traders mainly use<br />
futures contracts and avoid trading options<br />
and other non-linear products. Here, skill set<br />
also becomes a crucial point.<br />
In business support, which in this instance<br />
refers to the middle and back office, the<br />
divergence is much narrower than that<br />
between different trading functions. Average<br />
business support costs per trader vary by<br />
only a factor of two. In this context, IT is by<br />
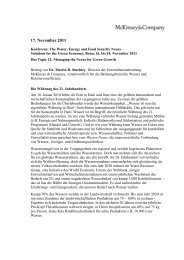
Proprietary trading<br />
• Power<br />
• Natural gas<br />
• Oil<br />
• Coal<br />
• CO 2<br />
• Structures, exotics, true<br />
cross-community<br />
• Others<br />
Asset-backed trading<br />
• Short-term trading<br />
• Mid- to long-term trading<br />
• Balance management<br />
• Ancillary services<br />
Further split by<br />
geographies:<br />
continental Europe, UK<br />
and Nordics<br />
for power and gas<br />
Structured products/<br />
origination<br />
• Brokerage,<br />
back-to-back deal<br />
• Match deals<br />
• External structured<br />
products<br />
• Internal structured<br />
products<br />
• Sourcing contracts<br />
• Commodity-related<br />
advisory<br />
F1. <strong>McKinsey</strong> Energy Trading Survey – scope of trading activities<br />
What commodities and geographies are included?<br />
far the largest cost driver and shows by far<br />
the greatest variance between participants,<br />
mostly due to economies of scale, scope and<br />
sophistication of trading, and risk management<br />
activities.<br />
Risk management does not keep<br />
up with expanding trading<br />
We also observed a large divergence in<br />
performance and sophistication in risk<br />
management and risk measurement across<br />
almost all dimensions, whereby only the most<br />
sophisticated and trading-oriented utility<br />
companies have ‘adequate’ capabilities. <strong>Measuring</strong><br />
operational risk, using state-of the-art<br />
modelling techniques such as Monte Carlo<br />
simulations, capturing tail risk by applying<br />
measures such as conditional value-at-risk,<br />
and deriving and allocating risk limits to<br />
Source: <strong>McKinsey</strong><br />
The best-performing players boast<br />
productivity significantly above E10 million<br />
in net revenues per trader, while less<br />
sophisticated players have a productivity<br />
that is roughly three times lower<br />
efficiently utilise risk capital, are still more<br />
the exception than the rule. Particularly<br />
with banks, less sophisticated players reveal<br />
large gaps that need to be closed, especially<br />
if trading activities continue to expand – as<br />
most players plan to do.<br />
The biggest differences in sophistication<br />
become obvious when taking a closer look at<br />
the modelling techniques applied. Only half<br />
May 2007 energy risk 57