Measuring success - McKinsey & Company
Measuring success - McKinsey & Company
Measuring success - McKinsey & Company
You also want an ePaper? Increase the reach of your titles
YUMPU automatically turns print PDFs into web optimized ePapers that Google loves.
Utilities survey<br />
A cutting-edge survey by <strong>McKinsey</strong> & <strong>Company</strong> reveals which types of<br />
trading are most prevalent and <strong>success</strong>ful among utilities. Using survey data,<br />
<strong>McKinsey</strong>’s Jörg Doege, Sven Heiligtag and Peter De Wit suggest guidelines for<br />
creating <strong>success</strong>ful trading and risk management functions<br />
<strong>Measuring</strong> <strong>success</strong><br />
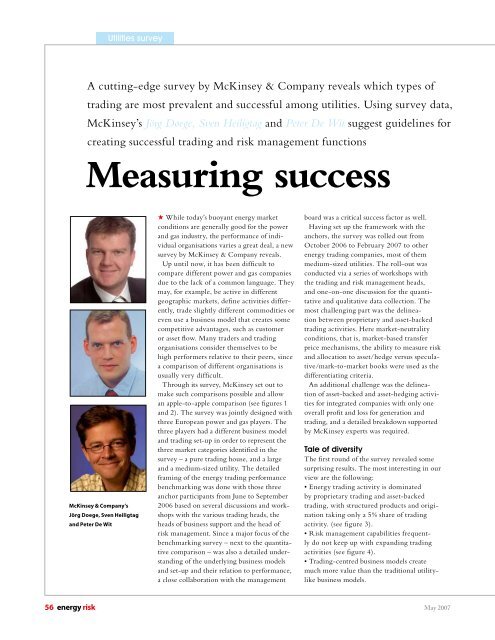
<strong>McKinsey</strong> & <strong>Company</strong>’s<br />
Jörg Doege, Sven Heiligtag<br />
and Peter De Wit<br />
H While today’s buoyant energy market<br />
conditions are generally good for the power<br />
and gas industry, the performance of individual<br />
organisations varies a great deal, a new<br />
survey by <strong>McKinsey</strong> & <strong>Company</strong> reveals.<br />
Up until now, it has been difficult to<br />
compare different power and gas companies<br />
due to the lack of a common language. They<br />
may, for example, be active in different<br />
geographic markets, define activities differently,<br />
trade slightly different commodities or<br />
even use a business model that creates some<br />
competitive advantages, such as customer<br />
or asset flow. Many traders and trading<br />
organisations consider themselves to be<br />
high performers relative to their peers, since<br />
a comparison of different organisations is<br />
usually very difficult.<br />
Through its survey, <strong>McKinsey</strong> set out to<br />
make such comparisons possible and allow<br />
an apple-to-apple comparison (see figures 1<br />
and 2). The survey was jointly designed with<br />
three European power and gas players. The<br />
three players had a different business model<br />
and trading set-up in order to represent the<br />
three market categories identified in the<br />
survey – a pure trading house, and a large<br />
and a medium-sized utility. The detailed<br />
framing of the energy trading performance<br />
benchmarking was done with those three<br />
anchor participants from June to September<br />
2006 based on several discussions and workshops<br />
with the various trading heads, the<br />
heads of business support and the head of<br />
risk management. Since a major focus of the<br />
benchmarking survey – next to the quantitative<br />
comparison – was also a detailed understanding<br />
of the underlying business models<br />
and set-up and their relation to performance,<br />
a close collaboration with the management<br />
board was a critical <strong>success</strong> factor as well.<br />
Having set up the framework with the<br />
anchors, the survey was rolled out from<br />
October 2006 to February 2007 to other<br />
energy trading companies, most of them<br />
medium-sized utilities. The roll-out was<br />
conducted via a series of workshops with<br />
the trading and risk management heads,<br />
and one-on-one discussion for the quantitative<br />
and qualitative data collection. The<br />
most challenging part was the delineation<br />
between proprietary and asset-backed<br />
trading activities. Here market-neutrality<br />
conditions, that is, market-based transfer<br />
price mechanisms, the ability to measure risk<br />
and allocation to asset/hedge versus speculative/mark-to-market<br />
books were used as the<br />
differentiating criteria.<br />
An additional challenge was the delineation<br />
of asset-backed and asset-hedging activities<br />
for integrated companies with only one<br />
overall profit and loss for generation and<br />
trading, and a detailed breakdown supported<br />
by <strong>McKinsey</strong> experts was required.<br />
Tale of diversity<br />
The first round of the survey revealed some<br />
surprising results. The most interesting in our<br />
view are the following:<br />
• Energy trading activity is dominated<br />
by proprietary trading and asset-backed<br />
trading, with structured products and origination<br />
taking only a 5% share of trading<br />
activity. (see figure 3).<br />
• Risk management capabilities frequently<br />
do not keep up with expanding trading<br />
activities (see figure 4).<br />
• Trading-centred business models create<br />
much more value than the traditional utilitylike<br />
business models.<br />
56 energy risk May 2007
Proprietary and asset-backed<br />
trading dominate activity<br />
At the top-line level, key performance indicators<br />
vary significantly both in absolute<br />
and relative terms. For example, the largest<br />
player in the sample netted more than E500<br />
million in revenues produced by the trading<br />
team while the smallest player only recorded<br />
some E10 million. Likewise, productivity<br />
varies greatly: the best-performing players<br />
boast productivity significantly above E10<br />
million in net revenues per trader, while less<br />
sophisticated players have a productivity that<br />
is roughly three times lower.<br />
A closer look at the various trading activities<br />
paints a similar picture in terms of<br />
divergence in key performance indicators.<br />
Interestingly, most of the players focus on<br />
either asset-backed or proprietary trading,<br />
while structured products/origination is<br />
still a rare occurrence within the observed<br />
players. Remuneration levels for asset-backed<br />
and proprietary trading are very different.<br />
Companies that excel in both are those<br />
who have clearly separated these activities,<br />
thereby managing the inherent conflict in<br />
terms of skill set and trader remuneration<br />
schemes (see figure 3).<br />
The maturity of proprietary trading instruments<br />
is also an excellent differentiator<br />
between asset-backed-focused and proprietary-focused<br />
players. Typically, proprietary-focused<br />
players have longer maturity<br />
contracts (more than six months) than those<br />
that are focused on asset-backed trading.<br />
A reason is that in financial contracts, the<br />
greatest leverage is in longer-term contracts<br />
due to the higher uncertainty involved. This<br />
higher level of risk requires a higher skill<br />
set, leading to the fact that primarily only<br />
proprietary traders trade actively long-term<br />
contracts. Contract types traded also differ<br />
between the two types of traders. While<br />
proprietary-focused players use all instruments,<br />
asset-backed traders mainly use<br />
futures contracts and avoid trading options<br />
and other non-linear products. Here, skill set<br />
also becomes a crucial point.<br />
In business support, which in this instance<br />
refers to the middle and back office, the<br />
divergence is much narrower than that<br />
between different trading functions. Average<br />
business support costs per trader vary by<br />
only a factor of two. In this context, IT is by<br />
Proprietary trading<br />
• Power<br />
• Natural gas<br />
• Oil<br />
• Coal<br />
• CO 2<br />
• Structures, exotics, true<br />
cross-community<br />
• Others<br />
Asset-backed trading<br />
• Short-term trading<br />
• Mid- to long-term trading<br />
• Balance management<br />
• Ancillary services<br />
Further split by<br />
geographies:<br />
continental Europe, UK<br />
and Nordics<br />
for power and gas<br />
Structured products/<br />
origination<br />
• Brokerage,<br />
back-to-back deal<br />
• Match deals<br />
• External structured<br />
products<br />
• Internal structured<br />
products<br />
• Sourcing contracts<br />
• Commodity-related<br />
advisory<br />
F1. <strong>McKinsey</strong> Energy Trading Survey – scope of trading activities<br />
What commodities and geographies are included?<br />
far the largest cost driver and shows by far<br />
the greatest variance between participants,<br />
mostly due to economies of scale, scope and<br />
sophistication of trading, and risk management<br />
activities.<br />
Risk management does not keep<br />
up with expanding trading<br />
We also observed a large divergence in<br />
performance and sophistication in risk<br />
management and risk measurement across<br />
almost all dimensions, whereby only the most<br />
sophisticated and trading-oriented utility<br />
companies have ‘adequate’ capabilities. <strong>Measuring</strong><br />
operational risk, using state-of the-art<br />
modelling techniques such as Monte Carlo<br />
simulations, capturing tail risk by applying<br />
measures such as conditional value-at-risk,<br />
and deriving and allocating risk limits to<br />
Source: <strong>McKinsey</strong><br />
The best-performing players boast<br />
productivity significantly above E10 million<br />
in net revenues per trader, while less<br />
sophisticated players have a productivity<br />
that is roughly three times lower<br />
efficiently utilise risk capital, are still more<br />
the exception than the rule. Particularly<br />
with banks, less sophisticated players reveal<br />
large gaps that need to be closed, especially<br />
if trading activities continue to expand – as<br />
most players plan to do.<br />
The biggest differences in sophistication<br />
become obvious when taking a closer look at<br />
the modelling techniques applied. Only half<br />
May 2007 energy risk 57
Utilities survey<br />
Relative performance vs. peer group<br />
Absolute performance v. peer group<br />
(millions , %)<br />
Systematic comparison of<br />
• Profits<br />
• Revenues<br />
• Product risk<br />
• Productivities<br />
• Compensations<br />
• Costs<br />
• Head counts<br />
RORAC front<br />
office (%)<br />
Risk categories measured<br />
Market risk<br />
Credit risk<br />
Operational<br />
risk<br />
Usage of CVAR calculation<br />
Not at all<br />
On demand<br />
Weekly<br />
Daily<br />
Contribution<br />
front office<br />
( millions)<br />
Market risk<br />
capital<br />
( millions)<br />
0<br />
15<br />
15<br />
30<br />
You<br />
Net trading<br />
revenues<br />
( millions)<br />
Compensation<br />
( millions)<br />
Source: <strong>McKinsey</strong> Energy Trading Performance Benchmarking<br />
the participants use exponentially weighted<br />
moving average to model volatility or correlations,<br />
while the rest indicated that volatility<br />
The overall trading productivity for independent<br />
and integrated trading-focused companies is two to<br />
three times higher than for pure retail players<br />
of commodities is treated as constant over<br />
time. However, unlike many banking players,<br />
none of the participants uses approaches such<br />
as Arch or Garch to deal with stochastic<br />
volatility in the longer term. In addition, less<br />
than half the participants model spreads as a<br />
stochastic variable while the rest simply treat<br />
it as the difference of two commodity prices.<br />
Consequently, this results in mis-pricing of<br />
100<br />
100<br />
70<br />
Net trading<br />
revenues/trader<br />
( millions)<br />
Number of<br />
traders<br />
FTE<br />
Compensation/<br />
trader<br />
( millions)<br />
Methodology to calculate VAR<br />
Parametric<br />
Historic<br />
Monte Carlo<br />
Methodology to derive risk limits<br />
Historical<br />
grown limits<br />
Limits set<br />
by board<br />
Linear model<br />
Non-linear<br />
model<br />
Qualitative survey<br />
F2. <strong>McKinsey</strong> energy trading survey – methodology<br />
• Detailed overview and comparison<br />
of role of setup of trading - for<br />
example: prevailing business models,<br />
setup of activities within trading, interface<br />
with generation/upstream and<br />
sales/marketing.<br />
• Detailed assessment of value pools/<br />
trading activities – for example: in<br />
terms of the focus of products, activities<br />
and commodities, compensation levels/<br />
incentive schemes, productivities<br />
• Detailed assessment of sophistication<br />
of risk management – for example,<br />
in terms of risk categories measured,<br />
risk modelling/quantative analysis, risk<br />
capital/limits and overall setup<br />
• Overview of business and<br />
management support costs<br />
F3. Proprietary and asset-backed trading<br />
dominate activity Source: <strong>McKinsey</strong> Energy Trading Performance Benchmarking<br />
0<br />
15<br />
20<br />
contracts, or mis-measuring of products, and<br />
certainly creates arbitrage opportunities for<br />
more sophisticated players.<br />
Trading-centred models create<br />
more value than traditional models<br />
The fundamental differences in performance<br />
and sophistication are primarily explained<br />
by two elements of the underlying business<br />
model: the scope and set-up of the trading<br />
activities and the role of trading within the<br />
organisation. In this regard, four different<br />
business models were observed. These ranged<br />
from the traditional utility-like models in<br />
which retail or generation is the core activity<br />
to very advanced trading-focused models in<br />
which trading is responsible for the commercial<br />
optimisation across the entire value and<br />
consequently create more value out of their<br />
trading activities. They are:<br />
• Retail-centred players who use generation<br />
and trading to satisfy the retail demand at any<br />
given point in time. They focus primarily<br />
on mitigating risk and hedging demand and<br />
only perform some short-term, asset-backed<br />
trading and little proprietary trading beyond<br />
this. Both types of trading activities are<br />
performed by the same traders/desks.<br />
• Generation-centred players who use trading<br />
to physically optimise and market generation<br />
capacity. They focus on both hedging their<br />
assets and short-term, asset-backed trading<br />
but only do little proprietary trading beyond<br />
this. Both types of trading activities are<br />
performed by the same traders/desks.<br />
• Independent trading-centred players who<br />
trade on top of their generation and retail<br />
business by leveraging market insights from<br />
their asset and customer base. These players<br />
can get their positions internally from the<br />
asset-base or externally from the market.<br />
They focus on proprietary trading, partially<br />
structured products/origination, and also<br />
frequently perform short-term, asset-backed<br />
trading. In this way, the inherent conflict<br />
58 energy risk May 2007<br />
35<br />
40<br />
40<br />
50
etween asset-backed and proprietary<br />
trading activities is managed by clearly<br />
separating them.<br />
• An integrated trading-focused model<br />
in which trading is responsible for the<br />
commercial optimisation across the entire<br />
value chain and portfolio. They participate<br />
in all asset/contract and retail activities<br />
from hedging in the medium to long term,<br />
short-term, asset-backed trading, as well<br />
as structured products/origination including<br />
procurement. The extent of proprietary<br />
trading activities depends on the overall<br />
risk appetite. However, certain activities<br />
are always performed to gain market access,<br />
conceal own-asset positions or generate<br />
market insights.<br />
Opportunities to create value through<br />
sophisticated trading and risk management<br />
capabilities are high – when you do it right.<br />
The best-performing, trading-focused players<br />
are able to add significantly more than 50%<br />
on top of the intrinsic value of their generation<br />
portfolio compared with only up to 30%<br />
for the more classical utility-like players.<br />
In general, the overall trading productivity<br />
for independent and integrated tradingfocused<br />
companies is two to three times<br />
higher than for pure retail or even generation-focused<br />
players. Consequently, the latter<br />
companies are in high risk of losing not only<br />
market share but also their talent.<br />
Implications<br />
The energy trading performance benchmarking<br />
survey highlights many important questions<br />
that the players in this still relatively<br />
young industry are struggling with to define<br />
the future role and position of trading. In our<br />
view, three very important pieces of advice<br />
can be taken from the survey. They are:<br />
• Defining the role of trading. Define the<br />
ambition level with respect to the three key<br />
roles of trading, that is, optimising assets and<br />
portfolios through asset-backed trading; creating<br />
growth opportunities through proprietary<br />
trading; and creating growth opportunities<br />
through structured products/origination.<br />
• Designing the trading function. Choose<br />
the organisational design with respect to:<br />
the organisational set-up of trading within<br />
the group and the corresponding interfaces<br />
with generation and sales; and the organisational<br />
set-up within the trading unit itself, for<br />
Share of trading revenues<br />
Average % across participants Indexed<br />
Proprietary<br />
trading<br />
Asset-backed<br />
trading<br />
Structured products/<br />
origination<br />
example, front, middle and back office.<br />
• Assessing the gap in capabilities/resources<br />
and choosing the path to <strong>success</strong>. Understand<br />
the gap in terms of: skills, for<br />
example, trading, risk management and IT;<br />
performance management, for example,<br />
remuneration levels and incentive schemes;<br />
and systems, tools and processes. It then<br />
needs to be decided whether to implement<br />
the first two points above in a big bang<br />
or a sequential approach and whether it<br />
should be done organically or through joint<br />
ventures/acquisitions.<br />
In answering these questions, players need to<br />
understand that trading involves risk-taking<br />
and that, consequently, activities should only<br />
be expanded after the corresponding risk<br />
management capabilities have been developed<br />
and not the other way around.<br />
Given the great enthusiasm and feedback in<br />
the first round, the energy trading survey is<br />
being rolled out for the second round. In addition<br />
to the power and gas players that were the<br />
focus in the first round, we are planning to<br />
include players from both the financial community<br />
and the US in the second round.<br />
For further information, or to participate in the second<br />
round of the survey, please contact:<br />
Sven Heiligtag or Jörg Doege, <strong>McKinsey</strong> & <strong>Company</strong>,<br />
Email: sven _ heiligtag@mckinsey.com,<br />
joerg _ doege@mckinsey.com<br />
The other authors of the survey are Markus Böhme,<br />
Hervé Touati and Thomas Vahlenkamp.<br />
May 2007 energy risk 59<br />
5<br />
45<br />
50<br />
Compensation vs. productivity<br />
Compensation*<br />
per trader<br />
100<br />
80<br />
60<br />
40<br />
20<br />
0<br />
Proprietary<br />
trading<br />
Asset-backed<br />
trading<br />
0 50 100<br />
Productivity**<br />
F4. Risk management capabilities frequently do not<br />
keep up with expanding trading activities<br />
* Including fiexed compensation and bonus payments<br />
** Net trading revenues per trader<br />
Source: <strong>McKinsey</strong> Energy Trading Performance Benchmarking


