Fermentation optimization for the production of ... - Massey University
Fermentation optimization for the production of ... - Massey University
Fermentation optimization for the production of ... - Massey University

Create successful ePaper yourself
Turn your PDF publications into a flip-book with our unique Google optimized e-Paper software.
Abstract<br />
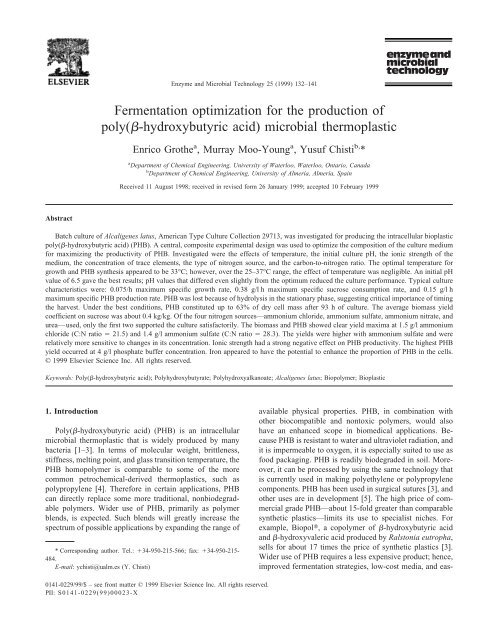
<strong>Fermentation</strong> <strong>optimization</strong> <strong>for</strong> <strong>the</strong> <strong>production</strong> <strong>of</strong><br />
poly(-hydroxybutyric acid) microbial <strong>the</strong>rmoplastic<br />
Enrico Gro<strong>the</strong> a , Murray Moo-Young a , Yusuf Chisti b, *<br />
a Department <strong>of</strong> Chemical Engineering, <strong>University</strong> <strong>of</strong> Waterloo, Waterloo, Ontario, Canada<br />
b Department <strong>of</strong> Chemical Engineering, <strong>University</strong> <strong>of</strong> Almería, Almería, Spain<br />
Received 11 August 1998; received in revised <strong>for</strong>m 26 January 1999; accepted 10 February 1999<br />
Batch culture <strong>of</strong> Alcaligenes latus, American Type Culture Collection 29713, was investigated <strong>for</strong> producing <strong>the</strong> intracellular bioplastic<br />
poly(-hydroxybutyric acid) (PHB). A central, composite experimental design was used to optimize <strong>the</strong> composition <strong>of</strong> <strong>the</strong> culture medium<br />
<strong>for</strong> maximizing <strong>the</strong> productivity <strong>of</strong> PHB. Investigated were <strong>the</strong> effects <strong>of</strong> temperature, <strong>the</strong> initial culture pH, <strong>the</strong> ionic strength <strong>of</strong> <strong>the</strong><br />
medium, <strong>the</strong> concentration <strong>of</strong> trace elements, <strong>the</strong> type <strong>of</strong> nitrogen source, and <strong>the</strong> carbon-to-nitrogen ratio. The optimal temperature <strong>for</strong><br />
growth and PHB syn<strong>the</strong>sis appeared to be 33°C; however, over <strong>the</strong> 25–37°C range, <strong>the</strong> effect <strong>of</strong> temperature was negligible. An initial pH<br />
value <strong>of</strong> 6.5 gave <strong>the</strong> best results; pH values that differed even slightly from <strong>the</strong> optimum reduced <strong>the</strong> culture per<strong>for</strong>mance. Typical culture<br />
characteristics were: 0.075/h maximum specific growth rate, 0.38 g/l h maximum specific sucrose consumption rate, and 0.15 g/l h<br />
maximum specific PHB <strong>production</strong> rate. PHB was lost because <strong>of</strong> hydrolysis in <strong>the</strong> stationary phase, suggesting critical importance <strong>of</strong> timing<br />
<strong>the</strong> harvest. Under <strong>the</strong> best conditions, PHB constituted up to 63% <strong>of</strong> dry cell mass after 93 h <strong>of</strong> culture. The average biomass yield<br />
coefficient on sucrose was about 0.4 kg/kg. Of <strong>the</strong> four nitrogen sources—ammonium chloride, ammonium sulfate, ammonium nitrate, and<br />
urea—used, only <strong>the</strong> first two supported <strong>the</strong> culture satisfactorily. The biomass and PHB showed clear yield maxima at 1.5 g/l ammonium<br />
chloride (C:N ratio 21.5) and 1.4 g/l ammonium sulfate (C:N ratio 28.3). The yields were higher with ammonium sulfate and were<br />
relatively more sensitive to changes in its concentration. Ionic strength had a strong negative effect on PHB productivity. The highest PHB<br />
yield occurred at 4 g/l phosphate buffer concentration. Iron appeared to have <strong>the</strong> potential to enhance <strong>the</strong> proportion <strong>of</strong> PHB in <strong>the</strong> cells.<br />
© 1999 Elsevier Science Inc. All rights reserved.<br />
Keywords: Poly(-hydroxybutyric acid); Polyhydroxybutyrate; Polyhydroxyalkanoate; Alcaligenes latus; Biopolymer; Bioplastic<br />
1. Introduction<br />
Poly(-hydroxybutyric acid) (PHB) is an intracellular<br />
microbial <strong>the</strong>rmoplastic that is widely produced by many<br />
bacteria [1–3]. In terms <strong>of</strong> molecular weight, brittleness,<br />
stiffness, melting point, and glass transition temperature, <strong>the</strong><br />
PHB homopolymer is comparable to some <strong>of</strong> <strong>the</strong> more<br />
common petrochemical-derived <strong>the</strong>rmoplastics, such as<br />
polypropylene [4]. There<strong>for</strong>e in certain applications, PHB<br />
can directly replace some more traditional, nonbiodegradable<br />
polymers. Wider use <strong>of</strong> PHB, primarily as polymer<br />
blends, is expected. Such blends will greatly increase <strong>the</strong><br />
spectrum <strong>of</strong> possible applications by expanding <strong>the</strong> range <strong>of</strong><br />
* Corresponding author. Tel.: 34-950-215-566; fax: 34-950-215-<br />
484.<br />
E-mail: ychisti@ualm.es (Y. Chisti)<br />
Enzyme and Microbial Technology 25 (1999) 132–141<br />
0141-0229/99/$ – see front matter © 1999 Elsevier Science Inc. All rights reserved.<br />
PII: S0141-0229(99)00023-X<br />
available physical properties. PHB, in combination with<br />
o<strong>the</strong>r biocompatible and nontoxic polymers, would also<br />
have an enhanced scope in biomedical applications. Because<br />
PHB is resistant to water and ultraviolet radiation, and<br />
it is impermeable to oxygen, it is especially suited to use as<br />
food packaging. PHB is readily biodegraded in soil. Moreover,<br />
it can be processed by using <strong>the</strong> same technology that<br />
is currently used in making polyethylene or polypropylene<br />
components. PHB has been used in surgical sutures [3], and<br />
o<strong>the</strong>r uses are in development [5]. The high price <strong>of</strong> commercial<br />
grade PHB—about 15-fold greater than comparable<br />
syn<strong>the</strong>tic plastics—limits its use to specialist niches. For<br />
example, Biopol, a copolymer <strong>of</strong> -hydroxybutyric acid<br />
and -hydroxyvaleric acid produced by Ralstonia eutropha,<br />
sells <strong>for</strong> about 17 times <strong>the</strong> price <strong>of</strong> syn<strong>the</strong>tic plastics [3].<br />
Wider use <strong>of</strong> PHB requires a less expensive product; hence,<br />
improved fermentation strategies, low-cost media, and eas-
ier downstream recovery methods are needed [6–8]. This<br />
work reports on <strong>the</strong> <strong>optimization</strong> <strong>of</strong> PHB <strong>production</strong> in <strong>the</strong><br />
bacterium Alcaligenes latus.<br />
Microbial <strong>production</strong> <strong>of</strong> PHB has predominantly relied<br />
upon <strong>the</strong> bacterium A. eutrophus [9,10] and, to a lesser<br />
degree, A. latus [11,12]. A. eutrophus accumulates PHB<br />
when a nutrient, such as phosphate, limits its growth but <strong>the</strong><br />
carbon substrate is present in nonlimiting amounts. This<br />
necessitates a more expensive two-stage cultivation: first,<br />
<strong>the</strong> cells must be grown to a high concentration under<br />
nonlimiting conditions, followed by a PHB-accumulating<br />
second phase. A. latus, on <strong>the</strong> o<strong>the</strong>r hand, is a growthassociated<br />
producer <strong>of</strong> PHB; hence, a single-stage fermentation<br />
is sufficient [11,13]. Fur<strong>the</strong>rmore, A. latus can be<br />
cultured readily on sucrose, which is less expensive than <strong>the</strong><br />
glucose that is typically used in A. eutrophus fermentations.<br />
Up to 80% <strong>of</strong> dry cell mass <strong>of</strong> A. latus can be PHB. Because<br />
<strong>of</strong> <strong>the</strong>se fundamental advantages, <strong>the</strong> fermentation <strong>optimization</strong><br />
studies reported here focus on A. latus.<br />
A. latus is a nonsporulating, Gram-negative, obligate<br />
aerobe. The bacterial cells are short rods or coccoids, 1.2–<br />
2.4 m in diameter and 1.6–2.4 m in length. The cells<br />
occur singly, in pairs, or in short chains [14,15]. The bacterium<br />
is sluggishly motile by means <strong>of</strong> 5–10 peritrichous<br />
flagella [14,15]. Optimal growth temperature is about 35°C.<br />
Growth occurs over <strong>the</strong> pH range 6.0–7.5. Colonies are<br />
opaque, yellowish to grayish pink, and round.<br />
As <strong>for</strong> any fermentation [16,17], <strong>the</strong> A. latus culture<br />
per<strong>for</strong>mance is affected by numerous variables, including<br />
temperature, pH, carbon-to-nitrogen ratio in <strong>the</strong> feed, concentration<br />
<strong>of</strong> substrates, concentration <strong>of</strong> trace elements,<br />
ionic strength (IS), agitation intensity, and dissolved oxygen.<br />
Optimization <strong>of</strong> fermentation conditions has been used<br />
to substantially enhance yield and productivity <strong>of</strong> many<br />
bioprocesses [18,19]. Conventionally, fermentations are optimized<br />
empirically by using one-at-a-time variation <strong>of</strong> process<br />
parameters. This approach is inefficient and time consuming.<br />
Moreover, it assumes that <strong>the</strong> various fermentation<br />
parameters do not interact and that <strong>the</strong> process response is a<br />
direct function <strong>of</strong> <strong>the</strong> single varied parameter. In contrast,<br />
<strong>the</strong> observed behavior <strong>of</strong> a fermentation results from <strong>the</strong><br />
interactive influences <strong>of</strong> <strong>the</strong> various variables. Unlike conventional<br />
<strong>optimization</strong>, statistical <strong>optimization</strong> methods can<br />
take into account <strong>the</strong> interaction <strong>of</strong> variables in generating<br />
<strong>the</strong> process response [20]. Factorial design <strong>of</strong> <strong>optimization</strong><br />
experiments is especially suitable to account <strong>for</strong> <strong>the</strong> interactions,<br />
and it is efficient. A combination <strong>of</strong> factors (independent<br />
process variables) that generate a certain optimum<br />
response can be identified through factorial design and <strong>the</strong><br />
use <strong>of</strong> response surface methodology [21,22]. A central<br />
composite factorial experimental design [20,21] was used<br />
<strong>for</strong> <strong>the</strong> medium <strong>optimization</strong> reported here. In this approach,<br />
concentrations <strong>of</strong> medium components are <strong>the</strong> variables;<br />
each variable is referred to some base value and varied in a<br />
certain pattern. This pattern was designed by using statistical<br />
methods to yield <strong>the</strong> most in<strong>for</strong>mation from a minimum<br />
E. Gro<strong>the</strong> et al. / Enzyme and Microbial Technology 25 (1999) 132–141<br />
number <strong>of</strong> experiments. As with any statistical experimental<br />
design, attention to replication, randomization, and blocking<br />
is necessary.<br />
Whereas <strong>the</strong> biochemistry <strong>of</strong> PHB syn<strong>the</strong>sis in A. eutrophus<br />
is known [23], similar in<strong>for</strong>mation <strong>for</strong> A. latus is not<br />
available. Never<strong>the</strong>less, by analogy with A. eutrophus, enzymes<br />
such as -ketothiolase A, acetyl-coenzyme A reductase,<br />
and PHB synthase are likely to be involved. Moreover,<br />
because PHB <strong>production</strong> in A. latus is growth-associated, all<br />
enzymes participating in cellular metabolism are likely to<br />
affect PHB <strong>production</strong>, even if indirectly. Some <strong>of</strong> those<br />
enzymes may be sensitive to amounts <strong>of</strong> trace elements;<br />
hence, <strong>optimization</strong> <strong>of</strong> trace element concentration in <strong>the</strong><br />
culture medium was an important aspect <strong>of</strong> <strong>the</strong> work reported.<br />
A knowledge <strong>of</strong> elemental composition <strong>of</strong> biomass is a<br />
useful starting point <strong>for</strong> <strong>optimization</strong> <strong>of</strong> <strong>the</strong> <strong>for</strong>mulation <strong>of</strong><br />
<strong>the</strong> culture medium. A comparison <strong>of</strong> <strong>the</strong> elemental composition<br />
<strong>of</strong> A. latus [24] with typical ranges <strong>for</strong> bacteria [25]<br />
reveals a general similarity, but <strong>the</strong>re are two notable exceptions:<br />
<strong>the</strong> C:N ratio in A. latus (7.7) is higher, and, at<br />
21.5, <strong>the</strong> C:Fe ratio is substantially lower than <strong>the</strong> 230–<br />
2600 range that is typical <strong>for</strong> bacteria. The relatively high<br />
C:N ratio in A. latus is probably explained by <strong>the</strong> large<br />
amounts <strong>of</strong> PHB in <strong>the</strong> cells; PHB does not contain nitrogen.<br />
The PHB yield <strong>optimization</strong> approach demonstrated here<br />
nearly doubled <strong>the</strong> yield by identifying a suitable composition<br />
<strong>of</strong> <strong>the</strong> culture medium and <strong>the</strong> environmental conditions<br />
through statistically directed experimentation. Unlike<br />
conventional developmental methods, <strong>the</strong> experimental ef<strong>for</strong>t<br />
was minimal because multiple parameters were varied<br />
in a given fermentation batch. This reduced <strong>the</strong> number <strong>of</strong><br />
fermentations, time, labor, and consumption <strong>of</strong> material,<br />
while allowing a comprehensive investigation <strong>of</strong> <strong>the</strong> culture<br />
behavior. A systematic <strong>optimization</strong> approach has not been<br />
applied to A. latus be<strong>for</strong>e. The results reveal important<br />
effects <strong>of</strong> <strong>the</strong> C:N ratio, <strong>the</strong> type <strong>of</strong> <strong>the</strong> nitrogen source, and<br />
<strong>the</strong> IS on productivity <strong>of</strong> PHB.<br />
2. Materials and methods<br />
2.1. Microorganism and culture conditions<br />
An intracellular PHB producer, A. latus, ATCC 29714<br />
(or DSM 1123), was used throughout. The strain was maintained<br />
on agar slants and Petri dishes on <strong>the</strong> minimal medium<br />
1018 as noted in <strong>the</strong> American Type Culture Collection<br />
catalog [26]. After sufficient growth at 33°C, <strong>the</strong><br />
culture was held at 4°C until needed. Shake flasks (200 ml)<br />
containing 50 ml <strong>of</strong> minimal medium 1018 were inoculated<br />
with a loopful <strong>of</strong> cells. After 3–4 days growth (33°C, 200<br />
rev./min shaker), <strong>the</strong> 50 ml <strong>of</strong> inoculum attained cloudiness.<br />
The inoculum was used directly, or held at 4°C until needed.<br />
Shake flask <strong>optimization</strong> experiments used 1 ml <strong>of</strong> inocu-<br />
133
134 E. Gro<strong>the</strong> et al. / Enzyme and Microbial Technology 25 (1999) 132–141<br />
lum <strong>for</strong> 200 ml working volume in 500-ml flasks. All media<br />
were sterilized at 121°C, 20 min, and cooled to 33°C prior<br />
to use.<br />
2.2. Cell dry mass<br />
Biomass content were evaluated by gravimetry. Culture<br />
samples (10 ml) were centrifuged (15 000 g, 4 min, 4°C),<br />
<strong>the</strong> supernatant was refrigerated <strong>for</strong> fur<strong>the</strong>r analysis, and <strong>the</strong><br />
cell pellet was washed in deionized water, recovered<br />
(15 000 g, 4 min, 4°C), dried to constant weight (90°C,<br />
24 h), cooled in a desiccator, and weighed. The biomass<br />
yield coefficient on sucrose (Y X/S) was calculated as <strong>the</strong> cell<br />
dry weight produced per unit mass <strong>of</strong> sucrose consumed. All<br />
measurements were in duplicate.<br />
2.3. Sucrose<br />
The supernatant (1 ml) from biomass determinations was<br />
used to quantify sucrose by refractive index measurements<br />
in an Abbe refractometer (Atago 3T, Japan). The refractometer<br />
had been calibrated by using dilutions <strong>of</strong> freshly prepared<br />
sucrose-containing culture medium. In addition, a few<br />
<strong>of</strong> <strong>the</strong> measurements were verified by high-per<strong>for</strong>mance<br />
liquid chromatography (Millipore) on a lead sulfate column.<br />
Automatic sample injection (Waters 700 Saterlite WISP, 20<br />
l injection volume) was employed. An external differential<br />
refractometer (model R401) was used as <strong>the</strong> detector. Chromatograms<br />
were acquired and integrated with a Baseline<br />
810 Chromatography Workstation . Double deionized water<br />
was <strong>the</strong> eluent (85°C, 0.6 ml/min). The high per<strong>for</strong>mance<br />
liquid chromatography calibration standards were identical<br />
to those used <strong>for</strong> <strong>the</strong> refractometer.<br />
2.4. Ammonium<br />
A calibrated ammonia sensor electrode (model 8002–8,<br />
Electrical Instruments, Chertsey, UK) was used to measure<br />
<strong>the</strong> NH 4 concentration. The measurement range was 50–<br />
2000 mg/l as NH 4 . Just be<strong>for</strong>e measurement, <strong>the</strong> supernatant<br />
(5 ml) from cell dry mass determinations was made<br />
alkaline with concentrated sodium hydroxide (1 ml) to convert<br />
<strong>the</strong> dissolved ammonium ion to ammonia.<br />
2.5. PHB<br />
A gravimetric method similar to those employed previously<br />
by Marchessault et al. [10] and Ramsay et al. [27] was<br />
used. A sodium dodecyl sulfate solution (1% w/v sodium<br />
dodecyl sulfate, 10 ml, pH 10) was added to <strong>the</strong> biomass<br />
pellet obtained as described <strong>for</strong> cell dry mass measurements.<br />
The mixture was incubated on an orbital shaker (60 min,<br />
200 rev./min, 37°C). The solids were recovered by centrifugation<br />
(4 min, 7000 g) and washed with commercial<br />
sodium hypochlorite solution (Javex-5, Colgate–Palmolive;<br />
1 ml, 5.64% w/v sodium hypochlorite) that had been diluted<br />
Fig. 1. Typical pr<strong>of</strong>ile <strong>of</strong> A. latus fermentation. Time variation is shown <strong>for</strong><br />
biomass (CDM), PHB, sucrose, pH, ammonium, and <strong>the</strong> calculated values<br />
<strong>of</strong> <strong>the</strong> yield coefficients Y P/X and Y X/S. Data were obtained at 33°C in<br />
500-ml shake flasks.<br />
to 20 ml. The pellet was centrifuged (4 min, 7000 g),<br />
washed with deionized water (20 ml), and centrifuged<br />
again. The final pellet was dried (90°C, 24 h) to constant<br />
weight in preweighed aluminum dishes. The PHB yield<br />
coefficient relative to biomass (Y P/X) was calculated as <strong>the</strong><br />
mass <strong>of</strong> PHB obtained per unit cell dry weight. Measurements<br />
were in duplicate.<br />
3. Results and discussion<br />
3.1. Batch culture pr<strong>of</strong>ile<br />
Industrial fermentations are conducted predominantly as<br />
batch and fed-batch operations because long-term, continuous<br />
cultures are susceptible to contamination and strain<br />
degeneration [19]. Commercial <strong>production</strong> <strong>of</strong> PHB also<br />
relies on batch and fed-batch culture [11,13,23]; hence, <strong>the</strong><br />
<strong>optimization</strong> studies reported here were conducted in those<br />
modes, ra<strong>the</strong>r than in chemostat continuous culture. Data<br />
were obtained in shake flasks (500 ml) with 200 ml working<br />
volume (33°C, 200 rev./min). Fig. 1 depicts a typical fermentation<br />
pr<strong>of</strong>ile, <strong>the</strong> calculated specific product yield coefficient<br />
(Y P/X), and <strong>the</strong> growth yield coefficient (Y X/S) on<br />
sucrose. The culture characteristics were: 0.075/h maximum<br />
specific growth rate, 0.38 g/l h maximum specific sucrose<br />
consumption rate, and 0.15 g/l h maximum specific PHB<br />
<strong>production</strong> rate. The maximum PHB yield was 60% <strong>of</strong> <strong>the</strong>
Table 1<br />
Comparison <strong>of</strong> culture media<br />
dry cell mass after 93 h <strong>of</strong> culture. PHB loss because <strong>of</strong><br />
hydrolysis was observed (Fig. 1) upon reaching <strong>the</strong> stationary<br />
phase, suggesting critical importance <strong>of</strong> timing <strong>the</strong> harvest.<br />
Because PHB is quite stable in aqueous suspensions<br />
[7,8], <strong>the</strong> observed hydrolysis was associated to enzymemediated<br />
metabolic action in a low-sugar environment. In<br />
most microorganisms, PHB is a food reserve that is degraded<br />
to provide carbon and energy when an external<br />
carbon source is exhausted.<br />
The specific product yield (Y P/X) increased by about<br />
50% during exponential growth, suggesting that cells accumulated<br />
PHB while growing and aging; hence, any strategy<br />
that prolongs <strong>the</strong> growth phase is likely to fur<strong>the</strong>r enhance<br />
<strong>the</strong> PHB yield per unit biomass. The average biomass yield<br />
coefficient on sucrose was about 0.4 kg/kg. Less than 2 g/l<br />
sucrose remained at <strong>the</strong> end <strong>of</strong> fermentation. Both sucrose<br />
and nitrogen consumption patterns (Fig. 1) were consistent<br />
with a lag-exponential-stationary growth pattern <strong>of</strong> biomass.<br />
Low nitrogen levels toward <strong>the</strong> end <strong>of</strong> fermentation<br />
may have limited growth. The culture pH was not controlled,<br />
and it declined from about 7.4 to 5.2.<br />
A published elemental analysis [24] <strong>of</strong> A. latus was used<br />
to establish Medium 2 (Table 1) as <strong>the</strong> basal medium <strong>for</strong><br />
<strong>optimization</strong> experiments. Relative to <strong>the</strong> o<strong>the</strong>r media listed<br />
(Table 1), <strong>the</strong> Medium 2 was high in ammonium sulfate, but<br />
low in phosphates. At <strong>the</strong> o<strong>the</strong>r extreme, <strong>the</strong> Medium 1018<br />
was low in ammonium sulfate, but high in phosphates. The<br />
biomass yields obtained in various media are shown in Fig.<br />
2. Medium 3 provided <strong>the</strong> highest yields. Medium 1018,<br />
which was <strong>the</strong> simplest and <strong>the</strong> least expensive, was also <strong>the</strong><br />
least effective. Medium 2, based on <strong>the</strong> elemental composition<br />
<strong>of</strong> cells, was probably limiting in phosphates. The<br />
PHB yield in Media 1–3 averaged 53 1.3% <strong>of</strong> dry cell<br />
E. Gro<strong>the</strong> et al. / Enzyme and Microbial Technology 25 (1999) 132–141<br />
Component Composition (g/l)<br />
Medium 1 Medium 2 Medium 3 Medium 1018<br />
Sucrose 20 20 20 20<br />
(NH 4) 2SO 4 2 5.16 1.4 1<br />
KH 2PO 4 1.5 0.14 1.5 4.4<br />
Na 2HPO 4 3.6 0.68 1.8 4.8<br />
MgSO 4 7H 2O 0.2 0.3 0.2 0.5<br />
Trace element solution (ml/l) 1 1 1 1<br />
Composition <strong>of</strong> trace element solution (g/l)<br />
TES 1 TES 2 TES 3 TES 4<br />
Ammonium Fe (III) citrate 60 60 6 50<br />
CaCl 2 2H 2O 10 6.2 10 5<br />
H 3BO 3 0.3 2.8 0.3 —<br />
CoCl 2 6H 2O 0.2 3 0.2 —<br />
ZnSO 4 7H 2O 0.1 1 0.1 —<br />
MnCl 2 4H 2O 0.03 2 0.03 —<br />
Na 2MoO 4 2H 2O 0.03 0.5 0.03 —<br />
NiSO 4 7H 2O 0.02 1 0.02 —<br />
CuSO 4 5H 2O 0.01 0.4 0.01 —<br />
mass, whereas <strong>the</strong> yield in Medium 1018 was higher at<br />
61.5% <strong>of</strong> cell mass; never<strong>the</strong>less, <strong>the</strong> total amount <strong>of</strong> PHB<br />
was only about 67% <strong>of</strong> <strong>the</strong> best case results in Medium 3. In<br />
view <strong>of</strong> <strong>the</strong> results <strong>of</strong> Fig. 2, an optimal <strong>production</strong> medium<br />
needs to provide a satisfactory combination <strong>of</strong> <strong>the</strong> cell<br />
biomass yield and a high PHB content in <strong>the</strong> cells.<br />
3.2. Effect <strong>of</strong> trace elements<br />
To separate <strong>the</strong> effect <strong>of</strong> trace elements from those <strong>of</strong><br />
phosphate buffer and ammonium sulfate, <strong>the</strong> Medium 1<br />
(Table 1) was supplemented, in separate experiments, with<br />
trace element solution (TES) 1–4 (Table 1). The results are<br />
shown in Fig. 3, which also includes data in Medium 1<br />
without any added trace elements. As shown in <strong>the</strong> figure,<br />
nei<strong>the</strong>r <strong>the</strong> low trace element media (TES 4, or no trace<br />
Fig. 2. The biomass (CDM) and PHB yields in various media.<br />
135
136 E. Gro<strong>the</strong> et al. / Enzyme and Microbial Technology 25 (1999) 132–141<br />
Fig. 3. Effects <strong>of</strong> various levels <strong>of</strong> TES supplementation on biomass<br />
(CDM) and PHB yields in Medium 1. The TES 1018 corresponds to<br />
Medium 1 supplemented with TES 4.<br />
elements) nor that excessively rich in trace elements (TES<br />
2) produce high yields <strong>of</strong> biomass or PHB. The TES 3<br />
yielded more biomass; however, <strong>the</strong> overall PHB yields <strong>of</strong><br />
TES 1 and TES 3 were comparable, even though <strong>the</strong> latter<br />
was low in iron. These results suggest that iron may have<br />
<strong>the</strong> potential to enhance <strong>the</strong> proportion <strong>of</strong> PHB in <strong>the</strong> cells.<br />
3.3. Carbon-to-nitrogen ratio<br />
Ammonium sulfate (0–5.2 g/l) and ammonium chloride<br />
(0–4.215 g/l) were used to vary <strong>the</strong> C:N ratio in separate<br />
experiments. O<strong>the</strong>r media components were as listed <strong>for</strong><br />
Medium 1 in Table 1. The results are shown in Fig. 4. Both<br />
biomass and PHB showed clear yield maxima at 1.5 g/l<br />
ammonium chloride (C:N ratio 21.5) and 1.4 g/l ammonium<br />
sulfate (C:N ratio 28.3). Note that all vertically<br />
aligned data in <strong>the</strong> upper and <strong>the</strong> lower parts <strong>of</strong> Fig. 4<br />
represent <strong>the</strong> same C:N ratio, but with different concentrations<br />
<strong>of</strong> <strong>the</strong> two salts. The yields were relatively more<br />
sensitive to changes in <strong>the</strong> concentration <strong>of</strong> ammonium<br />
sulfate (Fig. 4), possibly because <strong>of</strong> differences in <strong>the</strong> bioavailability<br />
as a result <strong>of</strong> differences in <strong>the</strong> dissociation<br />
constants <strong>of</strong> <strong>the</strong> two salts. The specific product yield coefficient,<br />
Y P/X, was relatively less sensitive to <strong>the</strong> C:N ratio<br />
(Fig. 4); <strong>the</strong> C:N values <strong>for</strong> best PHB yields did not give <strong>the</strong><br />
highest value <strong>of</strong> Y P/X. Maximum biomass and PHB concentrations<br />
were obtained with ammonium sulfate, hence it was<br />
used in all subsequent work. Sulfur may have been a<br />
growth-limiting factor when ammonium chloride was used.<br />
Using an optimal C:N value <strong>of</strong> 28.3 (Fig. 4), two additional<br />
nitrogen sources—ammonium nitrate and urea—were<br />
tested. O<strong>the</strong>r nutrients were as listed in Table 1 <strong>for</strong> Medium<br />
1. The results <strong>for</strong> all nitrogen sources are summarized in<br />
Fig. 5. In comparison to ammonium sulfate (<strong>the</strong> best nitrogen<br />
source), <strong>the</strong> biomass yield in ammonium nitrate-supplemented<br />
medium was lower by a factor <strong>of</strong> 2.3, and <strong>the</strong><br />
Fig. 4. Effects <strong>of</strong> <strong>the</strong> type <strong>of</strong> nitrogen source and <strong>the</strong> carbon-to-nitrogen<br />
ratio on biomass (CDM), PHB, and <strong>the</strong> product yield coefficient (Y P/X) in<br />
Medium 1.<br />
product yield was lower by a factor <strong>of</strong> 1.7. Apparently with<br />
ammonium nitrate, only <strong>the</strong> nitrogen <strong>of</strong> <strong>the</strong> ammonium was<br />
bioavailable, and enzymes <strong>for</strong> assimilation <strong>of</strong> nitrate were<br />
not syn<strong>the</strong>sized. As shown in Fig. 5, A. latus could not<br />
metabolize urea as <strong>the</strong> sole nitrogen supply: <strong>the</strong> growth and<br />
PHB yield were comparable to <strong>the</strong> that when no nitrogen<br />
source was used.<br />
Fig. 5. Effect <strong>of</strong> <strong>the</strong> nitrogen source on biomass (CDM) and PHB yields at<br />
<strong>the</strong> optimal carbon-to-nitrogen ratio <strong>of</strong> 28.3.
Fig. 6. Effect <strong>of</strong> initial culture pH on biomass (CDM) and PHB yields in<br />
Medium 1.<br />
3.4. Influence <strong>of</strong> initial pH and temperature<br />
The influence <strong>of</strong> initial culture pH on biomass yield and<br />
PHB <strong>production</strong> is shown in Fig. 6. The results shown were<br />
obtained in Medium 1 (Table 1) with <strong>the</strong> initial pH having<br />
been adjusted by dropwise addition <strong>of</strong> concentrated hydrochloric<br />
acid or sodium hydroxide as needed. Clearly, as<br />
shown in Fig. 6, an initial pH value <strong>of</strong> 6.5 gave <strong>the</strong> best<br />
results; pH values that differed even slightly from <strong>the</strong> optimum<br />
reduced <strong>the</strong> culture per<strong>for</strong>mance. These results are<br />
consistent with Palleroni and Palleroni [14],who recommended<br />
a pH range <strong>of</strong> 6.0–7.5 <strong>for</strong> microbial growth. The<br />
initial pH value may have affected <strong>the</strong> bioavailability <strong>of</strong><br />
some <strong>of</strong> <strong>the</strong> trace elements. Note that acidic pHs as low as<br />
pH 5.5 developed during culture do not seem to affect A.<br />
latus; thus in Fig. 1, <strong>the</strong> exponential growth pattern is<br />
unaffected by <strong>the</strong> pH drop.<br />
The effect <strong>of</strong> temperature on growth and PHB yield is<br />
shown in Fig. 7. From <strong>the</strong> data shown, 33°C appears to be<br />
<strong>the</strong> optimal temperature <strong>for</strong> growth and PHB syn<strong>the</strong>sis;<br />
however, over <strong>the</strong> 25–37°C range, <strong>the</strong> temperature effect<br />
was negligible in view <strong>of</strong> <strong>the</strong> reproducibility <strong>of</strong> <strong>the</strong> measurements,<br />
which was 0.1 g/l.<br />
3.5. Media development by factorial design<br />
The factorial design approach to medium development<br />
relies on three stages <strong>of</strong> experimentation: screening, <strong>optimization</strong>,<br />
and verification. Screening experiments include<br />
many variables, but provide little in<strong>for</strong>mation per variable.<br />
Screening aims at problem reduction, a determination as to<br />
which few process variable have <strong>the</strong> greatest impact on<br />
per<strong>for</strong>mance. Optimization experiments are designed to<br />
provide in-depth in<strong>for</strong>mation about a few variables identified<br />
during screening as having <strong>the</strong> greatest impact on per<strong>for</strong>mance.<br />
Finally, verification experiments are used to val-<br />
E. Gro<strong>the</strong> et al. / Enzyme and Microbial Technology 25 (1999) 132–141<br />
Fig. 7. Effect <strong>of</strong> culture temperature on <strong>the</strong> biomass (CDM) and PHB<br />
yields.<br />
idate <strong>the</strong> results under specific experimental conditions. The<br />
three levels <strong>of</strong> experimentation used in this study are detailed<br />
separately in <strong>the</strong> following sections.<br />
3.5.1. Screening experiments<br />
The screening experiments were designed to evaluate <strong>the</strong><br />
impact <strong>of</strong> five factors, concentration <strong>of</strong> <strong>the</strong> carbon source,<br />
concentration <strong>of</strong> <strong>the</strong> nitrogen source, culture pH, IS, and <strong>the</strong><br />
concentration <strong>of</strong> TES, at three levels as noted in Table 2. A<br />
two-level fractional factorial design was employed. Thus,<br />
<strong>for</strong> k factors, <strong>the</strong>re were 2 k1 possible combinations <strong>of</strong><br />
factors, or 16 experimental runs. In comparison to a full<br />
factorial design, which would have required 2 k experimental<br />
combinations, <strong>the</strong> two-level fractional factorial design<br />
FF0516 (i.e. 5 factors, 16 combinations) reduced <strong>the</strong> experimental<br />
ef<strong>for</strong>t at <strong>the</strong> expense <strong>of</strong> reduced ability to identify<br />
some higher order interactions among factors. The specific<br />
combinations <strong>of</strong> factors used in 16 runs and <strong>the</strong> resulting<br />
PHB yield (response) are noted in Table 3. The Table also<br />
lists three additional runs 17–19 that were included to check<br />
reproducibility. The runs were conducted in a randomized<br />
order to guard against systematic bias. The FF0516 design<br />
enabled <strong>the</strong> estimation <strong>of</strong> <strong>the</strong> principal effect (i.e. how <strong>the</strong><br />
factor influenced <strong>the</strong> PHB yield) <strong>of</strong> each factor, as well as<br />
synergistic or antagonistic effects <strong>of</strong> two-factor interactions.<br />
The PHB yields obtained in <strong>the</strong> various runs are also<br />
Table 2<br />
Factor levels <strong>for</strong> <strong>the</strong> screening experiments<br />
Factor Units Low level High level Center point<br />
C-source g/l 15.0 25.0 20.0<br />
N-source g/l 1.5 3.0 2.25<br />
pH — 6.5 7.5 7.0<br />
Ionic strength g/l 4.0 12.0 8.0<br />
TES ml/l 1.0 3.0 2.0<br />
137
138 E. Gro<strong>the</strong> et al. / Enzyme and Microbial Technology 25 (1999) 132–141<br />
Table 3<br />
Factor values and response <strong>of</strong> screening runs<br />
Run Experimental factors Response<br />
C-source<br />
(g/l)<br />
N-source<br />
(g/l)<br />
noted in Table 3. In <strong>the</strong> runs noted, <strong>the</strong> values <strong>of</strong> <strong>the</strong> various<br />
factors were set close to <strong>the</strong> optimal settings derived from<br />
<strong>the</strong> preliminary shake flask experiments detailed previously.<br />
In all cases, <strong>the</strong> IS parameter was based on <strong>the</strong> concentration<br />
<strong>of</strong> <strong>the</strong> phosphate buffer components Na 2HPO 4 and<br />
KH 2PO 4. Both buffer components were used in equal<br />
amounts. An alternating pattern <strong>of</strong> high and low PHB yields<br />
is obvious in Table 3. This pattern corresponds to <strong>the</strong> high/<br />
low variation <strong>of</strong> IS (Table 3). Clearly, IS has a strong effect<br />
on PHB productivity. Also conspicuous in Table 3 are <strong>the</strong><br />
three runs 17–19 with similar PHB yields. Those runs were<br />
included in <strong>the</strong> factorial design as additional center points.<br />
(A center point is an observation <strong>for</strong> which all factors have<br />
intermediate values between <strong>the</strong> high and low extremes.)<br />
Because each center point was run at <strong>the</strong> same conditions,<br />
an independent estimation <strong>of</strong> experimental error was possible,<br />
and replication <strong>of</strong> every run was unnecessary. Based on<br />
<strong>the</strong> standard deviation <strong>of</strong> center point, <strong>the</strong> maximum error in<br />
PHB yield was 0.07 g/l.<br />
The interpretation <strong>of</strong> <strong>the</strong> results was based on estimates<br />
<strong>of</strong> how <strong>the</strong> various factors affected <strong>the</strong> response. The principal,<br />
or <strong>the</strong> main effect, <strong>of</strong> each factor was estimated as <strong>the</strong><br />
difference in <strong>the</strong> average PHB yield in going from <strong>the</strong> low<br />
to <strong>the</strong> high setting <strong>of</strong> that factor, i.e. main effect high<br />
level low level. Two-factor interactions were estimated as<br />
<strong>the</strong> average <strong>of</strong> <strong>the</strong> runs in which both factors were at<br />
extreme values, minus <strong>the</strong> average <strong>of</strong> <strong>the</strong> runs in which <strong>the</strong><br />
factor levels were mixed, i.e. interaction effect average <strong>of</strong><br />
high and low level average <strong>of</strong> mixed level. The estimated<br />
main effects and <strong>the</strong> two-factor interactions are shown as a<br />
Pareto chart in Fig. 8. Clearly, <strong>for</strong> <strong>the</strong> ranges <strong>of</strong> variations<br />
tested, concentration <strong>of</strong> trace elements and <strong>the</strong> IS were <strong>the</strong><br />
pH Ionic strength<br />
(g/l)<br />
1 15 1.5 6.5 4 3 2.48<br />
2 15 1.5 6.5 12 1 0.73<br />
3 15 1.5 7.5 4 1 2.19<br />
4 15 1.5 7.5 12 3 1.04<br />
5 15 3 6.5 4 1 1.75<br />
6 15 3 6.5 12 3 1.14<br />
7 15 3 7.5 4 3 2.50<br />
8 15 3 7.5 12 1 1.24<br />
9 25 1.5 6.5 4 1 2.19<br />
10 25 1.5 6.5 12 3 1.17<br />
11 25 1.5 7.5 4 3 2.41<br />
12 25 1.5 7.5 12 1 0.93<br />
13 25 3 6.5 4 3 2.45<br />
14 25 3 6.5 12 1 0.98<br />
15 25 3 7.5 4 1 2.04<br />
16 25 3 7.5 12 3 1.41<br />
17 20 2.25 7 8 2 1.58<br />
18 20 2.25 7 8 2 1.49<br />
19 20 2.25 7 8 2 1.53<br />
TES<br />
(ml/l)<br />
PHB<br />
(g/l)<br />
major influences on <strong>the</strong> PHB yield. Increasing TES had a<br />
beneficial effect on yield, whereas increasing IS was detrimental.<br />
By using multiple regression analysis, <strong>the</strong> observed PHB<br />
yield was correlated with <strong>the</strong> experimental variables as<br />
follows: PBH yield 1.645 0.586 IS 0.159 TES<br />
0.054 pH 0.032 C 0.023 N. For this<br />
equation, <strong>the</strong> regression coefficient (R) value was 0.971, <strong>the</strong><br />
R 2 was 0.944, <strong>the</strong> standard deviation (SD) was 0.160, <strong>the</strong><br />
SD <strong>of</strong> <strong>the</strong> intercept was 0.038, and that <strong>of</strong> <strong>the</strong> coefficient<br />
was 0.041. The R 2 value confirmed that <strong>the</strong> variability in <strong>the</strong><br />
PHB yield could be associated to <strong>the</strong> experimental factors to<br />
Fig. 8. Pareto chart <strong>for</strong> <strong>the</strong> screening experiments. The effects <strong>of</strong> individual<br />
factors and two-factor combinations are noted <strong>for</strong> <strong>the</strong> carbon source concentration,<br />
<strong>the</strong> nitrogen source concentration, <strong>the</strong> amount <strong>of</strong> TES, <strong>the</strong> IS,<br />
and <strong>the</strong> pH.
Table 4<br />
Factor levels <strong>for</strong> <strong>the</strong> <strong>optimization</strong> experiments<br />
Factor Levels<br />
1 0 1 <br />
Ionic strength (g/l) 0.59 1 2 3 3.41<br />
TES (ml/l) 2.59 3 4 5 5.41<br />
<strong>the</strong> extent <strong>of</strong> 94.4%. The coefficients in <strong>the</strong> equation can<br />
also be estimated from <strong>the</strong> Pareto chart (Fig. 8) by dividing<br />
<strong>the</strong> corresponding value <strong>of</strong> an effect by 2. The C and N in<br />
<strong>the</strong> equation are <strong>the</strong> concentrations (g/l) <strong>of</strong> <strong>the</strong> carbon- and<br />
<strong>the</strong> nitrogen-sources, respectively.<br />
In view <strong>of</strong> <strong>the</strong> results <strong>of</strong> <strong>the</strong> screening experiments,<br />
higher levels <strong>of</strong> TES and lower values <strong>of</strong> IS were indicated<br />
<strong>for</strong> <strong>the</strong> future <strong>optimization</strong> runs. The three o<strong>the</strong>r factors—<br />
pH, <strong>the</strong> carbon source, and <strong>the</strong> nitrogen source—did not<br />
have a major impact on yield; hence, <strong>for</strong> future <strong>optimization</strong>,<br />
<strong>the</strong> values <strong>of</strong> those factors could be set to <strong>the</strong> low<br />
economic levels.<br />
3.5.2. Optimization and verification<br />
Two factors—IS (buffer concentration) and TES (concentration<br />
<strong>of</strong> <strong>the</strong> trace element solution)—survived <strong>the</strong> initial<br />
screening <strong>for</strong> significant variables. The scope <strong>of</strong> <strong>the</strong><br />
E. Gro<strong>the</strong> et al. / Enzyme and Microbial Technology 25 (1999) 132–141<br />
Fig. 9. Layout <strong>of</strong> points in <strong>the</strong> experimental space.<br />
problem thus reduced and an <strong>optimization</strong> experiment became<br />
feasible. An orthogonal central composite design<br />
CC0211 <strong>for</strong> two independent factors, each at five levels with<br />
four -points and three replicates at <strong>the</strong> center, was used <strong>for</strong><br />
optimizing PHB <strong>production</strong> in shake flasks. The coding<br />
used <strong>for</strong> <strong>the</strong> two factors in <strong>the</strong> <strong>optimization</strong> runs is noted in<br />
Table 4. The position <strong>of</strong> <strong>the</strong> -points was established statistically<br />
to ensure optimal coverage <strong>of</strong> <strong>the</strong> experimental<br />
space. The layout <strong>of</strong> points in <strong>the</strong> experimental space is<br />
depicted in Fig. 9. The concentrations <strong>of</strong> sucrose and ammonium<br />
sulfate were fixed at 20 g/l and 1.5 g/l, respectively,<br />
and <strong>the</strong> initial pH was 7.0. The levels <strong>of</strong> <strong>the</strong> two variable<br />
factors and <strong>the</strong> resulting PHB yields <strong>for</strong> <strong>the</strong> 11 experimental<br />
runs are noted in Table 5. At 2.97 g/l, <strong>the</strong> average PHB yield<br />
in <strong>the</strong> <strong>optimization</strong> runs was 1.8-fold greater than <strong>the</strong> average<br />
yield in <strong>the</strong> screening experiment; hence, confirming<br />
that <strong>the</strong> three fixed parameters, i.e. pH, C-source level, and<br />
N-source concentration, were at suitable values. Based on<br />
<strong>the</strong> standard deviation <strong>of</strong> <strong>the</strong> center points (runs 9–11 in<br />
Table 5) <strong>the</strong> maximum error in <strong>the</strong> PHB yields was 0.06<br />
g/l.<br />
The results <strong>of</strong> <strong>the</strong> <strong>optimization</strong> runs are depicted in Fig.<br />
10. The highest PHB yield occurred at 1 ml/l TES and 4 g/l<br />
phosphate buffer concentration, thus confirming <strong>the</strong> strong<br />
negative effect <strong>of</strong> IS, but not <strong>the</strong> positive effect <strong>of</strong> TES<br />
139
140 E. Gro<strong>the</strong> et al. / Enzyme and Microbial Technology 25 (1999) 132–141<br />
Table 5<br />
Factor levels and <strong>the</strong> response <strong>of</strong> <strong>the</strong> <strong>optimization</strong> runs<br />
Run a<br />
Ionic strength TES PHB<br />
(g/l)<br />
1 1 1 3.49<br />
2 1 1 2.22<br />
3 1 1 3.45<br />
4 1 1 2.47<br />
5 1.41 0 2.87<br />
6 1.41 0 2.40<br />
7 0 1.41 3.54<br />
8 0 1.41 2.73<br />
9 0 0 3.23<br />
10 0 0 3.14<br />
11 0 0 3.13<br />
a<br />
Runs were conducted in a randomized order to guard against systematic<br />
bias.<br />
observed in <strong>the</strong> prior screening experiments. However, <strong>the</strong><br />
magnitude <strong>of</strong> <strong>the</strong> TES effect was small in comparison to that<br />
<strong>of</strong> <strong>the</strong> IS (see coefficients in <strong>the</strong> first equation).<br />
The relationship among <strong>the</strong> response PHB yield and <strong>the</strong><br />
two investigated factors could be represented as a response<br />
surface plot as shown in Fig. 11. The response surface was<br />
generated by using <strong>the</strong> quadratic polynomial z A B <br />
x C y D x 2 E y 2 F x y. In this<br />
equation, z is <strong>the</strong> predicted response, A is <strong>the</strong> intercept, <strong>the</strong><br />
x and y terms stand <strong>for</strong> <strong>the</strong> two experimental factors, and <strong>the</strong><br />
squared terms represent <strong>the</strong> curvature <strong>of</strong> <strong>the</strong> surface. The<br />
two-factor interaction is represented by <strong>the</strong> x y term. The<br />
polynomial regression <strong>of</strong> <strong>the</strong> experimental data yielded <strong>the</strong><br />
following response surface model: PBH yield 3.167 <br />
0.057 IS 0.425 TES 0.261 IS 2 0.010 TES 2<br />
0.073 IS TES.<br />
The various goodness-<strong>of</strong>-fit indicators <strong>for</strong> this equation<br />
were R 0.998, R 2 0.997, SD 0.104, SD <strong>of</strong> <strong>the</strong><br />
Fig. 10. The PHB yield obtained in <strong>optimization</strong> experiments <strong>for</strong> various<br />
combinations <strong>of</strong> IS and TES.<br />
Fig. 11. The response surface plot <strong>of</strong> PHB yield as a function <strong>of</strong> IS and<br />
TES.<br />
intercept 0.088, and <strong>the</strong> parameter SD 0.095. Based on<br />
<strong>the</strong> R 2 value, <strong>the</strong> variation in <strong>the</strong> PHB yield could be<br />
described by <strong>the</strong> last equation with a certainty <strong>of</strong> 99.7%.<br />
4. Conclusions<br />
Batch cultures <strong>of</strong> A. latus ATCC 29713 were investigated<br />
and optimized <strong>for</strong> <strong>the</strong> <strong>production</strong> <strong>of</strong> <strong>the</strong> microbial<br />
<strong>the</strong>rmoplastic PHB. The typical culture characteristics were:<br />
0.075/h maximum specific growth rate, 0.38 g/l h maximum<br />
specific sucrose consumption rate, and 0.15 g/l h maximum<br />
specific PHB <strong>production</strong> rate. The following specific conclusions<br />
were reached:<br />
1. The PHB <strong>production</strong> is growth associated. Degradation<br />
<strong>of</strong> <strong>the</strong> <strong>for</strong>med PHB commences with <strong>the</strong> onset <strong>of</strong><br />
<strong>the</strong> stationary phase; hence, timing <strong>the</strong> harvest is<br />
essential to prevent loss <strong>of</strong> <strong>the</strong> produced PHB.<br />
2. The type <strong>of</strong> nitrogen source and <strong>the</strong> carbon-to-nitrogen<br />
ratio affect biomass and PHB yields. Ammonium<br />
sulfate is a suitable nitrogen source; ammonium<br />
nitrate is unsatisfactory; and urea is not<br />
metabolized to a significant extent. When using ammonium<br />
nitrate and sucrose, <strong>the</strong> optimal C:N ratio is<br />
28.3. The sensitivity <strong>of</strong> <strong>the</strong> biomass and PHB yields<br />
to changes in C:N depends on <strong>the</strong> type <strong>of</strong> <strong>the</strong> nitrogen<br />
source used.<br />
3. A suitable complement <strong>of</strong> trace elements is essential<br />
to attaining high PHB productivity and yield; however,<br />
excessively high or excessively low concentrations<br />
<strong>of</strong> trace elements reduce productivity.
4. The initial pH <strong>of</strong> <strong>the</strong> culture medium significantly<br />
affects biomass and PHB productivities, presumably<br />
by affecting <strong>the</strong> bioavailability <strong>of</strong> one or more nutrients.<br />
The optimal initial pH is 6.5.<br />
5. The optimal temperature <strong>for</strong> growth and PHB <strong>for</strong>mation<br />
appears to be 33°C, although over <strong>the</strong> 25–<br />
37°C range, <strong>the</strong> effect <strong>of</strong> temperature is negligibly<br />
small.<br />
6. The IS <strong>of</strong> <strong>the</strong> medium has a strong effect on PHB<br />
<strong>production</strong>. A suitable IS value is 4 g/l.<br />
7. Through a statistically designed <strong>optimization</strong>, <strong>the</strong><br />
PHB yield could be increased from an average <strong>of</strong><br />
1.64 g/l in screening experiments to an average <strong>of</strong><br />
2.97 g/l in <strong>the</strong> <strong>optimization</strong> experiments; i.e. a 1.8fold<br />
yield enhancement.<br />
References<br />
[1] Poirier Y, Nawrath C, Somerville C. Production <strong>of</strong> polyhydroxyalkanoates,<br />
a family <strong>of</strong> biodegradable plastics and elastomers, in bacteria<br />
and plants. Biotechnology (NY) 1995;13:142–50.<br />
[2] Lee SY, Chang HN. Production <strong>of</strong> poly(hydroxyalkanoic acid). Adv<br />
Biochem Eng Biotechnol 1995;52:27–58.<br />
[3] Braunegg G, Lefebvre G, Genser KF. Polyhydroxyalkanoates,<br />
biopolyesters from renewable resources: Physiological and engineering<br />
aspects. J Biotechnol 1998;65:127–61.<br />
[4] Barham PJ. Physical properties <strong>of</strong> poly(hydroxybutyrate) and poly-<br />
(hydroxybutyrate-co-hydroxyvalerate). In: Dawes EA, editor. Novel<br />
biodegradable microbial polymers. Dordrecht: Kluwer, 1990. p. 81–<br />
96.<br />
[5] Kim I, Ondrey G, Kamiya T. Betting big on biopolymers. Chem Eng<br />
1998;105(7):43–7.<br />
[6] Chisti Y. Strategies in downstream processing. In: Subramanian G,<br />
editor. Bioseparation and bioprocessing: a handbook, vol. 2. New<br />
York: Wiley, 1998. p. 3–30.<br />
[7] Tamer IM, Moo–Young M, Chisti Y. Disruption <strong>of</strong> Alcaligenes latus<br />
<strong>for</strong> recovery <strong>of</strong> poly(-hydroxybutyric acid): Comparison <strong>of</strong> highpressure<br />
homogenization, bead milling, and chemically induced lysis.<br />
Ind Eng Chem Res 1998;37:1807–14.<br />
[8] Tamer IM, Moo–Young M, Chisti Y. Optimization <strong>of</strong> poly(-hydroxybutyric<br />
acid) recovery from Alcaligenes latus: Combined mechanical<br />
and chemical treatments. Bioprocess Eng 1998;19:459–68.<br />
[9] Byrom D. Industrial <strong>production</strong> <strong>of</strong> copolymer from Alcaligenes eutrophus.<br />
In: Dawes EA, editor. Novel biodegradable microbial polymers.<br />
Dordrecht: Kluwer, 1990. p. 113–17.<br />
E. Gro<strong>the</strong> et al. / Enzyme and Microbial Technology 25 (1999) 132–141<br />
[10] Marchessault RH, Monasterios CJ, Lepoutre P. Properties <strong>of</strong> poly-hydroxyalkanoate<br />
latex: nascent morphology, film <strong>for</strong>mation and<br />
surface chemistry. In: Dawes EA, editor. Novel biodegradable microbial<br />
polymers. Dordrecht: Kluwer, 1990. p. 97–112.<br />
[11] Hänggi UJ. Pilot scale <strong>production</strong> <strong>of</strong> PHB with Alcaligenes latus. In:<br />
Dawes EA, editor. Novel biodegradable microbial polymers. Dordrecht:<br />
Kluwer, 1990. p. 65–70.<br />
[12] Wang FL, Lee SY. Poly(3-hydroxybutyrate) <strong>production</strong> with high<br />
productivity and high polymer content by a fed-batch culture <strong>of</strong><br />
Alcaligenes latus under nitrogen limitation. Appl Env Microbiol<br />
1997;63:3703–6.<br />
[13] Hrabak O. Industrial <strong>production</strong> <strong>of</strong> poly--hydroxybutyrate. FEMS<br />
Microbiol Rev 1992;103:251–6.<br />
[14] Palleroni NJ, Palleroni AV. Alcaligenes latus, a new species <strong>of</strong><br />
hydrogen-utilizing bacteria. Int J Syst Bacteriol 1978;28:416–24.<br />
[15] Holt J, Krieg N, Sneath P, Stealey J, Williams S. Bergey’s manual <strong>of</strong><br />
determinative bacteriology, 9th ed. Baltimore, MD: Williams &<br />
Wilkins, 1994.<br />
[16] Chisti Y, Moo–Young M. <strong>Fermentation</strong> technology, bioprocessing,<br />
scale-up and manufacture. In: Moses V, Cape RE, editors. Biotechnology:<br />
<strong>the</strong> science and <strong>the</strong> business. New York: Harwood, 1991. p.<br />
167–209.<br />
[17] Ejio<strong>for</strong> AO, Chisti Y, Moo–Young M. Culture <strong>of</strong> Saccharomyces<br />
cerevisiae on hydrolysed waste cassava starch <strong>for</strong> <strong>production</strong> <strong>of</strong><br />
baking-quality yeast. Enzyme Microb Technol 1996;18:519–25.<br />
[18] Chisti Y, Moo-Young M. Bioprocess intensification through bioreactor<br />
engineering. Trans Inst Chem Eng 1996;74A:575–83.<br />
[19] Chisti Y. <strong>Fermentation</strong> (industrial). (a) Basic considerations. In: Robinson<br />
R, Batt C, Patel P, editors. Encyclopedia <strong>of</strong> food microbiology.<br />
London: Academic Press, 1999. (In press)<br />
[20] Haaland PD. Experimental design in biotechnology. New York: Dekker,<br />
1989.<br />
[21] Montgomery DC. Design and analysis <strong>of</strong> experiments, 3rd ed. New<br />
York: Wiley, 1991.<br />
[22] Khuri AI, Cornell JA. Response surfaces. Design and analysis. New<br />
York: Dekker, 1987.<br />
[23] Saito Y, Nakamura S, Hiramitsu M, Doi Y, Microbial syn<strong>the</strong>sis and<br />
properties <strong>of</strong> poly(3-hydroxybutyrate-co-4-hydroxybutyrate). Poly<br />
Int 1995;39:169–74.<br />
[24] Yamane T, Fukunaga M, Lee YW. Increased PHB productivity by<br />
high-cell-density fed-batch culture <strong>of</strong> Alcaligenes latus, a growth<br />
associated PHB producer. Biotechnol Bioeng 1996;50:197–202.<br />
[25] Chmiel H. Bioprozesstechnik, vol. 1. Stuttgart: Fischer, 1991.<br />
[26] Gharda R, Rienta P. ATCC Catalog <strong>of</strong> bacteria and bacteriophages,<br />
18th ed. Rockville, MD: American Type Culture Collection, 1995.<br />
[27] Ramsay JA, Berger E, Ramsay BA, Chavarie C. Recovery <strong>of</strong> poly-<br />
3-hydroxyalkanoic acid granules by a surfactant-hypochlorite treatment.<br />
Biotechnol Techn 1990;4:221–26.<br />
141