Introduction to Stata 8
Introduction to Stata 8
Introduction to Stata 8

You also want an ePaper? Increase the reach of your titles
YUMPU automatically turns print PDFs into web optimized ePapers that Google loves.
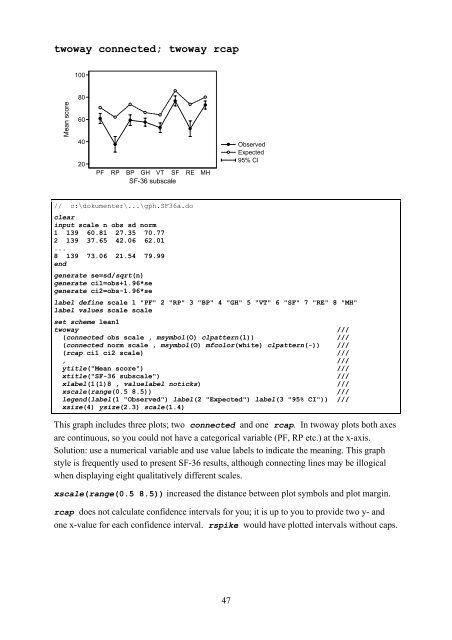
twoway connected; twoway rcap<br />
Mean score<br />
100<br />
80<br />
60<br />
40<br />
20<br />
PF RP BP GH VT SF RE MH<br />
SF-36 subscale<br />
/ / c:\dokumenter\...\gph.SF36a.do<br />
clear<br />
input scale n obs sd norm<br />
1 139 60.81 27.35 70.77<br />
2 139 37.65 42.06 62.01<br />
...<br />
8 139 73.06 21.54 79.99<br />
end<br />
generate se=sd/sqrt(n)<br />
generate ci1=obs+1.96*se<br />
generate<br />
ci2=obs-1.96*se<br />
Observed<br />
Expected<br />
95% CI<br />
label define scale 1 "PF" 2 "RP" 3 "BP" 4 "GH" 5 "VT" 6 "SF" 7 "RE" 8 "MH"<br />
label<br />
values scale scale<br />
set scheme lean1<br />
twoway ///<br />
(connected obs scale , msymbol(O) clpattern(l)) ///<br />
(connected norm scale , msymbol(O) mfcolor(white) clpattern(-)) ///<br />
(rcap ci1 ci2 scale) ///<br />
, ///<br />
ytitle("Mean score") ///<br />
xtitle("SF-36 subscale") ///<br />
xlabel(1(1)8 , valuelabel noticks) ///<br />
xscale(range(0.5 8.5)) ///<br />
legend(label(1 "Observed") label(2 "Expected") label(3 "95% CI")) ///<br />
xsize(4) ysize(2.3) scale(1.4)<br />
X>i< grap> in)1('e< t>ree p1ota.e a )ategori)a1 .aria?1e dPV: RP et)Ec at t>e QUaQii< grap><br />
e 'io(t )ap