agra betree nuwe era met
agra betree nuwe era met
agra betree nuwe era met

You also want an ePaper? Increase the reach of your titles
YUMPU automatically turns print PDFs into web optimized ePapers that Google loves.
How to determine the range of realistic stocking rates of a farm<br />
Drastic changes in animal numbers (red line in Fig. 2) cannot be achieved<br />
on farms that are much smaller than wild ecosystems and subject to<br />
expectations of profi t. A more realistic approach would be to adjust herd<br />
size within a more narrow range of stocking rates (green line in Fig 2).<br />
How can this range be determined? It should be deduced directly from<br />
the vegetation, but for lack of practically applicable and reliable data,<br />
rainfall records can be used instead. The Ministry of Agriculture, Water<br />
and Forestry (MAWF) has for many years investigated the possibility of<br />
calculating carrying capacities from remotely-sensed satellite images 4 .<br />
This research cannot yet be applied to farm level even though much<br />
of the ground-truthing was performed on farms 5 . It remains one of the<br />
objectives of Agra Professional Services to apply this information to farm<br />
level and in real time. However, lacking direct vegetation data and relying<br />
on the proven association between grass production and seasonal<br />
rainfall, animal stocking rate limits can be deduced from a farm’s longterm<br />
rainfall. Fitting a fi ve year moving av<strong>era</strong>ge on the series of individual<br />
rainfall years identifi es the rainfall range. This is an easy procedure<br />
as it is a function that can be selected in most computer spreadsheet<br />
programmes.<br />
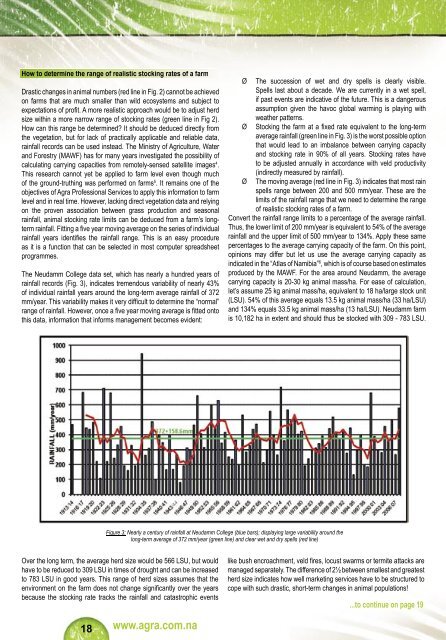
The Neudamm College data set, which has nearly a hundred years of<br />
rainfall records (Fig. 3), indicates tremendous variability of nearly 43%<br />
of individual rainfall years around the long-term av<strong>era</strong>ge rainfall of 372<br />
mm/year. This variability makes it very diffi cult to determine the “normal”<br />
range of rainfall. However, once a fi ve year moving av<strong>era</strong>ge is fi tted onto<br />
this data, information that informs management becomes evident:<br />
Over the long term, the av<strong>era</strong>ge herd size would be 566 LSU, but would<br />
have to be reduced to 309 LSU in times of drought and can be increased<br />
to 783 LSU in good years. This range of herd sizes assumes that the<br />
environment on the farm does not change signifi cantly over the years<br />
because the stocking rate tracks the rainfall and catastrophic events<br />
18<br />
www.<strong>agra</strong>.com.na<br />
Ø The succession of wet and dry spells is clearly visible.<br />
Spells last about a decade. We are currently in a wet spell,<br />
if past events are indicative of the future. This is a dangerous<br />
assumption given the havoc global warming is playing with<br />
weather patterns.<br />
Ø Stocking the farm at a fi xed rate equivalent to the long-term<br />
av<strong>era</strong>ge rainfall (green line in Fig. 3) is the worst possible option<br />
that would lead to an imbalance between carrying capacity<br />
and stocking rate in 90% of all years. Stocking rates have<br />
to be adjusted annually in accordance with veld productivity<br />
(indirectly measured by rainfall).<br />
Ø The moving av<strong>era</strong>ge (red line in Fig. 3) indicates that most rain<br />
spells range between 200 and 500 mm/year. These are the<br />
limits of the rainfall range that we need to determine the range<br />
of realistic stocking rates of a farm.<br />
Convert the rainfall range limits to a percentage of the av<strong>era</strong>ge rainfall.<br />
Thus, the lower limit of 200 mm/year is equivalent to 54% of the av<strong>era</strong>ge<br />
rainfall and the upper limit of 500 mm/year to 134%. Apply these same<br />
percentages to the av<strong>era</strong>ge carrying capacity of the farm. On this point,<br />
opinions may differ but let us use the av<strong>era</strong>ge carrying capacity as<br />
indicated in the “Atlas of Namibia” 6 , which is of course based on estimates<br />
produced by the MAWF. For the area around Neudamm, the av<strong>era</strong>ge<br />
carrying capacity is 20-30 kg animal mass/ha. For ease of calculation,<br />
let’s assume 25 kg animal mass/ha, equivalent to 18 ha/large stock unit<br />
(LSU). 54% of this av<strong>era</strong>ge equals 13.5 kg animal mass/ha (33 ha/LSU)<br />
and 134% equals 33.5 kg animal mass/ha (13 ha/LSU). Neudamm farm<br />
is 10,182 ha in extent and should thus be stocked with 309 - 783 LSU.<br />
Figure 3: Nearly a century of rainfall at Neudamm College (blue bars); displaying large variability around the<br />
long-term av<strong>era</strong>ge of 372 mm/year (green line) and clear wet and dry spells (red line)<br />
like bush encroachment, veld fi res, locust swarms or termite attacks are<br />
managed separately. The difference of 2½ between smallest and greatest<br />
herd size indicates how well marketing services have to be structured to<br />
cope with such drastic, short-term changes in animal populations!<br />
...to continue on page 19