full paper - THE BIOSCAN
full paper - THE BIOSCAN
full paper - THE BIOSCAN

Create successful ePaper yourself
Turn your PDF publications into a flip-book with our unique Google optimized e-Paper software.
MOHAMMAD ILYAS AND HINA PARWEZ<br />
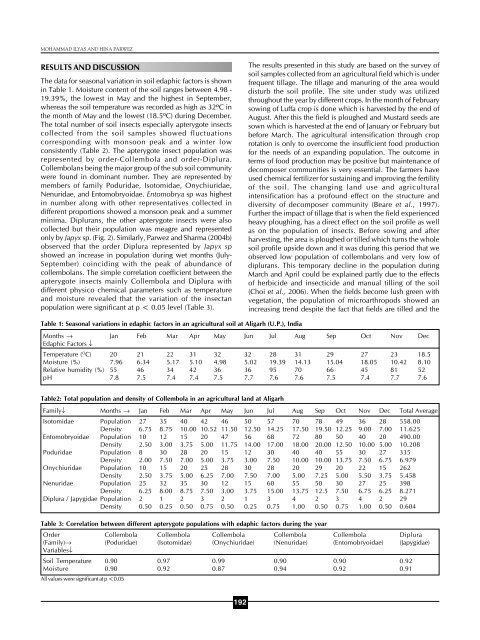
RESULTS AND DISCUSSION<br />
The data for seasonal variation in soil edaphic factors is shown<br />
in Table 1. Moisture content of the soil ranges between 4.98 -<br />
19.39%, the lowest in May and the highest in September,<br />
whereas the soil temperature was recorded as high as 32ºC in<br />
the month of May and the lowest (18.5ºC) during December.<br />
The total number of soil insects especially apterygote insects<br />
collected from the soil samples showed fluctuations<br />
corresponding with monsoon peak and a winter low<br />
consistently (Table 2). The apterygote insect population was<br />
represented by order-Collembola and order-Diplura.<br />
Collembolans being the major group of the sub soil community<br />
were found in dominant number. They are represented by<br />
members of family Poduridae, Isotomidae, Onychiuridae,<br />
Nenuridae, and Entomobryoidae. Entomobrya sp was highest<br />
in number along with other representatives collected in<br />
different proportions showed a monsoon peak and a summer<br />
minima. Diplurans, the other apterygote insects were also<br />
collected but their population was meagre and represented<br />
only by Japyx sp. (Fig. 2). Similarly, Parwez and Sharma (2004b)<br />
observed that the order Diplura represented by Japyx sp<br />
showed an increase in population during wet months (July-<br />
September) coinciding with the peak of abundance of<br />
collembolans. The simple correlation coefficient between the<br />
apterygote insects mainly Collembola and Diplura with<br />
different physico chemical parameters such as temperature<br />
and moisture revealed that the variation of the insectan<br />
population were significant at p < 0.05 level (Table 3).<br />
192<br />
The results presented in this study are based on the survey of<br />
soil samples collected from an agricultural field which is under<br />
frequent tillage. The tillage and manuring of the area would<br />
disturb the soil profile. The site under study was utilized<br />
throughout the year by different crops. In the month of February<br />
sowing of Luffa crop is done which is harvested by the end of<br />
August. After this the field is ploughed and Mustard seeds are<br />
sown which is harvested at the end of January or February but<br />
before March. The agricultural intensification through crop<br />
rotation is only to overcome the insufficient food production<br />
for the needs of an expanding population. The outcome in<br />
terms of food production may be positive but maintenance of<br />
decomposer communities is very essential. The farmers have<br />
used chemical fertilizer for sustaining and improving the fertility<br />
of the soil. The changing land use and agricultural<br />
intensification has a profound effect on the structure and<br />
diversity of decomposer community (Beare et al., 1997).<br />
Further the impact of tillage that is when the field experienced<br />
heavy ploughing, has a direct effect on the soil profile as well<br />
as on the population of insects. Before sowing and after<br />
harvesting, the area is ploughed or tilled which turns the whole<br />
soil profile upside down and it was during this period that we<br />
observed low population of collembolans and very low of<br />
diplurans. This temporary decline in the population during<br />
March and April could be explained partly due to the effects<br />
of herbicide and insecticide and manual tilling of the soil<br />
(Choi et al., 2006). When the fields become lush green with<br />
vegetation, the population of microarthropods showed an<br />
increasing trend despite the fact that fields are tilled and the<br />
Table 1: Seasonal variations in edaphic factors in an agricultural soil at Aligarh (U.P.), India<br />
Months →<br />
Edaphic Factors ↓<br />
Jan Feb Mar Apr May Jun Jul Aug Sep Oct Nov Dec<br />
Temperature ( OC) 20 21 22 31 32 32 28 31 29 27 23 18.5<br />
Moisture (%) 7.96 6.34 5.17 5.10 4.98 5.02 19.39 14.13 15.04 18.05 10.42 8.10<br />
Relative humidity (%) 55 46 34 42 36 36 95 70 66 45 81 52<br />
pH 7.8 7.5 7.4 7.4 7.5 7.7 7.6 7.6 7.5 7.4 7.7 7.6<br />
Table2: Total population and density of Collembola in an agricultural land at Aligarh<br />
Family↓ Months → Jan Feb Mar Apr May Jun Jul Aug Sep Oct Nov Dec Total Average<br />
Isotomidae Population 27 35 40 42 46 50 57 70 78 49 36 28 558.00<br />
Density 6.75 8.75 10.00 10.52 11.50 12.50 14.25 17.50 19.50 12.25 9.00 7.00 11.625<br />
Entomobryoidae Population 10 12 15 20 47 56 68 72 80 50 40 20 490.00<br />
Density 2.50 3.00 3.75 5.00 11.75 14.00 17.00 18.00 20.00 12.50 10.00 5.00 10.208<br />
Poduridae Population 8 30 28 20 15 12 30 40 40 55 30 27 335<br />
Density 2.00 7.50 7.00 5.00 3.75 3.00 7.50 10.00 10.00 13.75 7.50 6.75 6.979<br />
Onychiuridae Population 10 15 20 25 28 30 28 20 29 20 22 15 262<br />
Density 2.50 3.75 5.00 6.25 7.00 7.50 7.00 5.00 7.25 5.00 5.50 3.75 5.458<br />
Nenuridae Population 25 32 35 30 12 15 60 55 50 30 27 25 398<br />
Density 6.25 8.00 8.75 7.50 3.00 3.75 15.00 13.75 12.5 7.50 6.75 6.25 8.271<br />
Diplura / Japygidae Population 2 1 2 3 2 1 3 4 2 3 4 2 29<br />
Density 0.50 0.25 0.50 0.75 0.50 0.25 0.75 1.00 0.50 0.75 1.00 0.50 0.604<br />
Table 3: Correlation between different apterygote populations with edaphic factors during the year<br />
Order Collembola Collembola Collembola Collembola Collembola Diplura<br />
(Family)→<br />
Variables↓<br />
(Poduridae) (Isotomidae) (Onychiuridae) (Nenuridae) (Entomobryoidae) (Japygidae)<br />
Soil Temperature 0.90 0.97 0.99 0.90 0.90 0.92<br />
Moisture 0.90 0.92 0.87 0.94 0.92 0.91<br />
All values were significant at p