Download Elsenburg Joernaal - Department of Agriculture: Western ...
Download Elsenburg Joernaal - Department of Agriculture: Western ...
Download Elsenburg Joernaal - Department of Agriculture: Western ...
You also want an ePaper? Increase the reach of your titles
YUMPU automatically turns print PDFs into web optimized ePapers that Google loves.
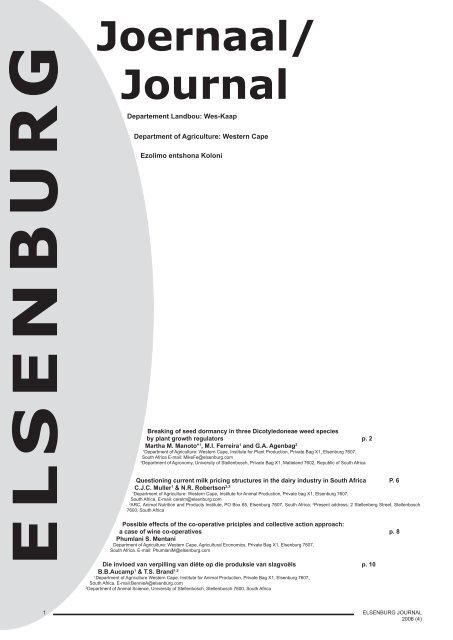
ELSENBURG<br />
<strong>Joernaal</strong>/<br />
Journal<br />
Departement Landbou: Wes-Kaap<br />
<strong>Department</strong> <strong>of</strong> <strong>Agriculture</strong>: <strong>Western</strong> Cape<br />
Ezolimo entshona Koloni<br />
Breaking <strong>of</strong> seed dormancy in three Dicotyledoneae weed species<br />
by plant growth regulators p. 2<br />
Martha M. Manoto* 1 , M.I. Ferreira 1 and G.A. Agenbag 2<br />
<strong>Department</strong> <strong>of</strong> <strong>Agriculture</strong>: <strong>Western</strong> Cape, Institute for Plant Production, Private Bag X , <strong>Elsenburg</strong> 7607,<br />
South Africa E-mail: MikeFe@elsenburg.com<br />
2 <strong>Department</strong> <strong>of</strong> Agronomy, University <strong>of</strong> Stellenbosch, Private Bag X , Matieland 7602, Republic <strong>of</strong> South Africa<br />
Questioning current milk pricing structures in the dairy industry in South Africa P. 6<br />
C.J.C. Muller 1 & N.R. Robertson 2,3<br />
<strong>Department</strong> <strong>of</strong> <strong>Agriculture</strong>: <strong>Western</strong> Cape, Institute for Animal Production, Private bag X , <strong>Elsenburg</strong> 7607,<br />
South Africa, E-mail: carelm@elsenburg.com<br />
2 ARC, Animal Nutrition and Products Institute, PO Box 65, <strong>Elsenburg</strong> 7607, South Africa; 3 Present address: 2 Stellenberg Street, Stellenbosch<br />
7600, South Africa<br />
Possible effects <strong>of</strong> the co-operative priciples and collective action approach:<br />
a case <strong>of</strong> wine co-operatives p. 8<br />
Phumlani S. Mentani<br />
<strong>Department</strong> <strong>of</strong> <strong>Agriculture</strong>: <strong>Western</strong> Cape, Agricultural Economics, Private Bag X , <strong>Elsenburg</strong> 7607,<br />
South Africa. E-mail: PhumlaniM@elsenburg.com<br />
Die invloed van verpilling van diëte op die produksie van slagvoëls p. 10<br />
B.B.Aucamp 1 & T.S. Brand 1,2<br />
<strong>Department</strong> <strong>of</strong> <strong>Agriculture</strong> <strong>Western</strong> Cape. Institute for Animal Production, Private Bag X , <strong>Elsenburg</strong> 7607,<br />
South Africa. E-mail:BennieA@elsenburg.com<br />
2 <strong>Department</strong> <strong>of</strong> Animal Science, University <strong>of</strong> Stellenbosch, Stellenbosch 7600, South Africa<br />
ELSENBURG JOURNAL<br />
2006 (4)
Breaking <strong>of</strong><br />
seed dormancy in three<br />
Dicotyledoneae weed species<br />
by plant growth regulators<br />
Introduction<br />
Dormancy is a property <strong>of</strong> many weed seeds that enables them to survive<br />
conditions hazardous to plant growth and to germinate at some later time<br />
or in some other place. Seeds may persist in the soil for many years<br />
because <strong>of</strong> dormancy and germinate when conditions are favourable<br />
for seedling survival through to maturity (Duke, 985). Bewley & Black<br />
( 982) stated that the ability <strong>of</strong> growth regulators, when applied to seeds,<br />
to release seeds from dormancy and promote germination is particularly<br />
interesting as it gives an indication to possible dormancy mechanisms.<br />
Several chemicals, when applied to dormant seeds, might cause them<br />
to germinate. Although the seed <strong>of</strong> numerous species mostly respond to<br />
one or more <strong>of</strong> these chemicals, large differences are found between<br />
species (Corns, 959; Bewley & Black, 982; Metzger, 983; Hurtt &<br />
Taylorson, 986). Little is however known with regard to the response<br />
<strong>of</strong> some troublesome Dicotyledoneae (dicot) weed species in the<br />
<strong>Western</strong> Cape to these chemicals. Floral variation and other reproductive<br />
morphology provide the basis for dividing the flowering plants into two<br />
major classes: the class Magnoliopsida (dicots) and the class Liliopsida<br />
(monocots).<br />
Povilaitis ( 956), stated that the application <strong>of</strong> chemicals to the soil to<br />
stimulate weed seed germination might be an alternative method <strong>of</strong> weed<br />
control and could result in the weed population being destroyed in one<br />
season rather than by repeated annual applications <strong>of</strong> herbicides.<br />
Generally, selective herbicides are registered for either broadleaf<br />
(dicot) or grass (monocot) weed control because <strong>of</strong> different physiological<br />
responses between the two classes. It is therefore botanically useful to<br />
distinguish anatomically and physiologically between dicot and monocot<br />
weeds.<br />
The informal name dicot refers to the presence <strong>of</strong> two embryonic<br />
leaves (cotyledons) in the seed. The stomata are scattered in leaves<br />
<strong>of</strong> dicot plants. Most dicot leaves have netted venation, meaning they<br />
have one or a few prominent mid veins from which smaller minor veins<br />
branch into a meshed network (Moore et al., 1998). In dicots, flower parts<br />
usually occur in multiples <strong>of</strong> four or five. Pollen usually has three furrows<br />
or pores. The primary vascular bundles in the dicot stem are arranged<br />
in a ring. True secondary growth with vascular cambium is commonly<br />
present in dicots (Moore et al., 998).<br />
The objective <strong>of</strong> this study was to evaluate the effect <strong>of</strong> three growth<br />
regulators to break dormancy and enable simultaneous germination <strong>of</strong><br />
the dicot weeds Arctotheca calendula, Emex australis and Raphanus<br />
raphanistrum.<br />
Materials and Methods<br />
Seeds <strong>of</strong> A. calendula, E. australis and R. raphanistrum, collected during<br />
the year 2000 at Langgewens Experimental Farm in the Swartland wheat<br />
producing area <strong>of</strong> South Africa and stored at room temperature ( 5-25<br />
ºC), were used in this germination study.<br />
To determine the germination response <strong>of</strong> the above-mentioned weed<br />
species to three plant growth regulators, 00 seeds <strong>of</strong> each species were<br />
placed on Whatman’s filter paper in 9.5 cm diameter petri dishes and<br />
ELSENBURG JOERNAAL<br />
2006 (4)<br />
MARTHA M. MANoTo, M.I. FERREIRA AND G.A. AGENBAG<br />
Abstract<br />
Seeds <strong>of</strong> the dicot weeds Arctotheca calendula, Emex australis and Raphanus raphanistrum were used to<br />
determine its germination response to three plant growth regulators in an incubator at 20 oC with a 2-hour<br />
day/night cycle. Cumulative germination <strong>of</strong> A. calendula seeds was not improved by any <strong>of</strong> the chemicals<br />
used. Germination <strong>of</strong> E. australis was significantly increased at 3-7 days by an application <strong>of</strong> 1 mg l -<br />
gibberellic acid, with similar results for both 30 mg l - hydroxylamine and 0.3 mg l - kinetin at 0-3 days. The<br />
germination <strong>of</strong> R. raphanistrum was, apart from the 0-3 day incubation period, significantly improved at all<br />
other incubation periods when 00 mg l - gibberellic acid was applied.<br />
moistened with 5 ml <strong>of</strong> the test solutions gibberellic acid, hydroxylamine<br />
(auxin) or kinetin (cytokinin), respectively. Subsequently, the petri dishes<br />
were then sealed with parafilm and placed in an incubator at 20 o C with a<br />
2 hour day/night cycle.<br />
The following test solutions were used:<br />
Gibberellic acid<br />
Gibberellic acid (purity > 90%) was tested at concentrations <strong>of</strong> 0 (control),<br />
mg l - , 0 mg l - and 00 mg l - . Each test solution also contained 2%<br />
(v/v) acetone and 0. % (v/v) oxysorbic (Tween) which assisted with the<br />
dispersal <strong>of</strong> the test compounds (Metzger, 983). Test solutions were<br />
adjusted to pH 4.8 using 6N KOH.<br />
Hydroxylamine (auxin)<br />
Hydroxylamine concentrations <strong>of</strong> 0 (control), 3 mg l - , 0 mg l - and 30<br />
mg l - were used. Each concentration were adjusted to pH 7.3 using<br />
NaOH and made up to l with distilled water as described by Esashi et<br />
al., ( 979).<br />
Kinetin (cytokinin)<br />
Kinetin concentrations <strong>of</strong> 0 (control), 0.2 mg l - , 0.3 mg l - , 0.5 mg l- were<br />
used. Each quantity was dissolved in 0 ml <strong>of</strong> slightly heated 0.5N NaOH<br />
before diluting with distilled water and made up to l with distilled water<br />
(Igbinnosa & Okonkwo, 992).<br />
The germination was assessed by emergence <strong>of</strong> the radicle and<br />
determined after 3, 7, 0 and 4 days <strong>of</strong> incubation. With the tetrazolium<br />
test, the ugerminated seeds were categorized as either viable or dead<br />
(Wood et al., 997). The germination percentage was based on the total<br />
number <strong>of</strong> seeds germinated as opposed to the total number <strong>of</strong> viable<br />
seeds tested. All treatments were replicated twice in a factorial design.<br />
Statistical Analysis<br />
Data were subjected to analysis <strong>of</strong> variance to assess the effect <strong>of</strong> different<br />
chemical concentrations on the germination <strong>of</strong> three weed species. The<br />
data were analysed using SAS (Statistical Analysis Systems, 987).<br />
Results<br />
Arctotheca calendula<br />
The germination rates <strong>of</strong> Arctotheca calendula were significantly affected<br />
by both the period <strong>of</strong> incubation and concentration <strong>of</strong> the chemicals<br />
used, but not by chemicals as a main factor (Table ). None <strong>of</strong> the A.<br />
calendula seeds germinated during the first three days (0-3 day period) <strong>of</strong><br />
incubation at any <strong>of</strong> the chemical treatments tested, while an average <strong>of</strong><br />
5.4%, 8.8% and 6.7% germinated during the 4-7 day, 8- 0 day and - 4<br />
day periods <strong>of</strong> incubation, respectively. These results are in agreement<br />
with those reported previously at different temperature regimes (Manoto<br />
et al., 2004).<br />
Results also showed a significant (p ≤ 0.05) chemical x concentration<br />
x period interaction, indicating that the response <strong>of</strong> A. calendula to the<br />
2
Table 1 Germination response (%) <strong>of</strong> Arctotheca calendula to three chemicals at four concentrations, over a period <strong>of</strong> 14 days at 20 °C.<br />
different concentrations <strong>of</strong> chemicals used, differed with time. This is due<br />
to significant differences found for different gibberellic acid concentrations<br />
during the 4-7 day period and hydroxylamine concentrations during the<br />
8- 0 and - 4 day periods <strong>of</strong> incubation (Table ). Results were very<br />
inconsistent and did not show any clear trend. Therefore, it is possible<br />
that the above-mentioned significant interactions are thus most likely due<br />
to experimental error.<br />
Cumulative germination figures (Figure 1) also showed that the<br />
germination <strong>of</strong> A. calendula seeds was not improved by any <strong>of</strong> the<br />
chemicals used. Cumulative germination <strong>of</strong> below 40% after 4 days <strong>of</strong><br />
incubation, as also found in the experiment with different temperature<br />
regimes, indicated that A. calendula needed either very specific conditions<br />
for germination or that germination is prevented by an impermeable seedcoat<br />
or immature embryo (Gardner et al., 985).<br />
Emex australis<br />
3<br />
Periods<br />
Weed species Chemical Concentration 0-3 days 4-7 days 8-10 days 11-14 days Mean<br />
Arctotheca<br />
calendula<br />
Mean 3.8<br />
Mean 6.0<br />
Mean 6.0<br />
Gibberellic acid 0mg l -<br />
mg l -<br />
0mg l -<br />
00mg l -<br />
Hydroxylamine 0 mg l -<br />
3 mg l -<br />
0 mg l -<br />
30 mg l -<br />
Kinetin 0 mg l -<br />
0.2 mg l -<br />
0.3 mg l -<br />
0.5 mg l -<br />
0 e<br />
0 e<br />
0 e<br />
0 e<br />
0 e<br />
0 e<br />
0 e<br />
0 e<br />
0 e<br />
0 e<br />
0 e<br />
0 e<br />
22.5 a<br />
2.5 de<br />
2.5 de<br />
0 e<br />
7.5 bcde<br />
0 e<br />
2.5 de<br />
0 e<br />
7.5 bcde<br />
2.5<br />
abcde<br />
5 cde<br />
2.5 de<br />
5 cde<br />
0 e<br />
2.5 de<br />
5 cde<br />
20 ab<br />
0 e<br />
20 ab<br />
7.5 bcde<br />
5 cde<br />
0 abcde<br />
5 abcd<br />
5 abcd<br />
5 cde<br />
0 e<br />
2.5 abcde<br />
2.5 de<br />
2.5 de<br />
7.5 bcde<br />
0 abcde<br />
7.5 abc<br />
7.5 bcde<br />
2.5 de<br />
7.5 bcde<br />
5 cde<br />
Mean 0 b 5.4 a 8.8 a 6.7 a<br />
LSD ‘t’ Main effect chemical (P ≤ 0.05) = 2. 7 N.S.<br />
LSD ‘t’ Main effect concentration (P ≤ 0.05) = 3.1 *<br />
LSD ‘t’ Main effect periods (P ≤ 0.05) = 3.7 *<br />
LSD ‘t’ chemical x concentration (P ≤ 0.05) = 5.3 *<br />
LSD ‘t’ chemical x periods (P ≤ 0.05) = 6.3 N.S.<br />
LSD ‘t’ concentration x periods (P ≤ 0.05) = 7.3 N.S.<br />
LSD ‘t’ chemical x concentration x periods (P ≤ 0.05) = 12.7 *<br />
* P ≤ 0.05 = Significant, N.S. = Not Significant.<br />
8. a<br />
0.6 c<br />
4.4 ab<br />
.9 bc<br />
7.5 a<br />
.9 bc<br />
8. a<br />
6.3 ab<br />
5.0<br />
abc<br />
6.3 ab<br />
6.9 ab<br />
5.6<br />
abc<br />
Germination rates <strong>of</strong> E. australis were significantly (p ≤ 0.05) affected<br />
by period <strong>of</strong> incubation, chemicals used and chemical concentrations<br />
used as main factors, as well as chemical x concentration and chemical<br />
x concentration x period interactions (Table 2). Mean values <strong>of</strong> 23.5%<br />
and 43. % germination during the 0-3 and 4-7 day incubation periods,<br />
clearly indicated that seeds <strong>of</strong> E. australis used in this experiment were<br />
not dormant.<br />
Although mean chemical x concentration values showed significant<br />
differences (p ≤ 0.05) between concentrations for all chemicals tested,<br />
mean germination was not significantly increased by any <strong>of</strong> the chemicals<br />
used. During individual periods <strong>of</strong> incubation, germination <strong>of</strong> E. australis<br />
was significantly increased due to the application <strong>of</strong> 1 mg l - <strong>of</strong> gibberellic<br />
acid at 3-7 days, 30 mg l - hydroxylamine at 0-3 days and 0.3 mg l -<br />
kinetin at 0-3 days.<br />
This resulted in slightly higher cumulative germination values for E.<br />
australis if treated with low concentrations ( and 0 mg l - ) gibberellic acid<br />
Figure 1: Cumulative germination <strong>of</strong> A. calendula due to (a) gibberellic acid, (b) hydroxylamine and (c) kinetin treatments.<br />
Cumulative %<br />
100<br />
90<br />
80<br />
70<br />
60<br />
50<br />
40<br />
30<br />
20<br />
10<br />
0<br />
3 7 10 14<br />
Germination period (days)<br />
0mg/l 1mg/l<br />
10mg/l 100mg/l<br />
Cumulative %<br />
100<br />
90<br />
80<br />
70<br />
60<br />
50<br />
40<br />
30<br />
20<br />
10<br />
0<br />
3 7 10 14<br />
Germination period (days)<br />
0mg/l 3mg/l<br />
10mg/l 30mg/l<br />
Cumulative %<br />
100<br />
90<br />
80<br />
70<br />
60<br />
50<br />
40<br />
30<br />
20<br />
10<br />
0<br />
3 7 10 14<br />
Germination period (days)<br />
0mg/l 0.2mg/l<br />
0.3mg/l 0.5mg/l<br />
ELSENBURG JOURNAL<br />
2006 (4)
Table 2: Germination response (%) <strong>of</strong> Emex australis to three chemicals at four concentrations, over a period <strong>of</strong><br />
14 days at 20 °C.<br />
or medium concentrations <strong>of</strong> hydroxylamine (3 and 0 mg l - ) and kinetin<br />
(0.2 and 0.3 mg l - ) (Figure 2). These treatments with hydroxylamine and<br />
kinetin resulted in cumulative values <strong>of</strong> more than 90% germination <strong>of</strong> E.<br />
australis after 4 days <strong>of</strong> incubation.<br />
Raphanus raphanistrum<br />
Germination <strong>of</strong> R. raphanistrum seeds were also significantly (p ≤ 0.05)<br />
affected by chemicals used, concentration rates and period <strong>of</strong> incubation<br />
as main factors (Table 3).<br />
Although mean germination percentages for different incubation<br />
periods were generally low (less than 20%), significant interactions<br />
between concentration rates and chemicals used, resulted in high<br />
germination rates during specific incubation periods.<br />
The application <strong>of</strong> gibberellic acid did not affect the germination <strong>of</strong> R.<br />
ELSENBURG JOERNAAL<br />
2006 (4)<br />
Periods<br />
Weed species Chemical Concentration 0-3 days 4-7 days 8-10 days 11-14 days Mean<br />
Emex australis Gibberellic acid 0 mg l -<br />
Mean 6.9 b<br />
Mean 9.7 a<br />
Mean 2 .9 a<br />
mg l -<br />
0 mg l -<br />
00 mg l -<br />
Hydroxylamine 0 mg l -<br />
3 mg l -<br />
0 mg l -<br />
30 mg l -<br />
Kinetin 0 mg l -<br />
0.2 mg l -<br />
0.3 mg l -<br />
0.5 mg l -<br />
22.5 defgh<br />
2.5 fgh<br />
2.5 fgh<br />
2.5 h<br />
5 efgh<br />
7.5 gh<br />
7.5 efgh<br />
50 abc<br />
7.5 efgh<br />
27.5 cdefg<br />
60 ab<br />
37.5 bcde<br />
37.5 bcde<br />
60 ab<br />
37.5 bcde<br />
22.5 defgh<br />
57.5 ab<br />
2.5 fgh<br />
67.5 a<br />
45 abcd<br />
50 abc<br />
62.5 a<br />
32.5 cdef<br />
32.5 cdef<br />
5 gh<br />
5 gh<br />
0 fgh<br />
0 fgh<br />
2.5 h<br />
7.5 efgh<br />
2.5 h<br />
0 h<br />
5 gh<br />
7.5 gh<br />
7.5 gh<br />
0 h<br />
Mean 23.5 b 43.1 a 6.0 c 5.8 c<br />
LSD ‘t’ Main effect chemical (P ≤ 0.05) = 4.7 *<br />
LSD ‘t’ Main effect concentration (P ≤ 0.05) = 5.4 *<br />
LSD ‘t’ Main effect periods (P ≤ 0.05) = 7.1 *<br />
LSD ‘t’ chemical x concentration (P ≤ 0.05) = 9.3 *.<br />
LSD ‘t’ chemical x periods (P ≤ 0.05) = 12.3 *<br />
LSD ‘t’ concentration x periods (P ≤ 0.05) = 14.2 N.S.<br />
LSD ‘t’ chemical x concentration x periods (P ≤ 0.05) = 24.6 *<br />
* P ≤ 0.05 = Significant, N.S. = Not Significant<br />
2.5 h<br />
0 h<br />
5 efgh<br />
5 efgh<br />
2.5 h<br />
0 fgh<br />
5 gh<br />
2.5 h<br />
0 h<br />
0 h<br />
0 h<br />
0 fgh<br />
6.8 abc<br />
9.4 a<br />
8.7 abc<br />
2.5 bc<br />
9.4 abc<br />
.9 c<br />
23. a<br />
24.4 a<br />
8. abc<br />
24.3 ab<br />
25.0 a<br />
20.0 abc<br />
raphanistrum<br />
during the 0-3 day incubation period (Table 3 and Figure 3). At all other<br />
incubation periods, germination percentage were significantly (p ≤ 0.05)<br />
improved if 00 mg l- gibberellic acid was applied. Hydroxylamine and<br />
kinetin did not have any effect. The germination <strong>of</strong> R. raphanistrum at all<br />
kinetin treatments increased with an increase in incubation period.<br />
Cumulative values (Figure 3) confirmed the stimulating effects <strong>of</strong><br />
gibberellic acid on the germination <strong>of</strong> R. raphanistrum seeds since the<br />
application <strong>of</strong> 00 mg l- gibberellic acid caused more than 90% <strong>of</strong> the<br />
seed to germinate within 4 days <strong>of</strong> incubation, while kinetin also showed<br />
a stimulating effect at the highest concentration.<br />
Figure 2 Cumulative germination <strong>of</strong> E. australis due to (a) gibberellic acid, (b) hydroxylamine and (c) kinetin treatments.<br />
Cumulative %<br />
100<br />
90<br />
80<br />
70<br />
60<br />
50<br />
40<br />
30<br />
20<br />
10<br />
0<br />
3 7 10 14<br />
Germination period (days)<br />
0mg/l 1mg/l<br />
10mg/l 100mg/l<br />
Cumulative %<br />
100<br />
90<br />
80<br />
70<br />
60<br />
50<br />
40<br />
30<br />
20<br />
10<br />
0<br />
3 7 10 14<br />
Germination period (days)<br />
0mg/l 3mg/l<br />
10mg/l 30mg/l<br />
Cumulative %<br />
100<br />
90<br />
80<br />
70<br />
60<br />
50<br />
40<br />
30<br />
20<br />
10<br />
0<br />
3 7 10 14<br />
Germination period (days)<br />
0mg/l 0.2mg/l<br />
0.3mg/l 0.5mg/l<br />
4
Table 3 Germination response (%) <strong>of</strong> Raphanus raphanistrum to three chemicals at four concentrations, over a period<br />
<strong>of</strong> 4 days at 20 °C.<br />
Discussion<br />
No chemical proved to be successful in stimulating the germination <strong>of</strong><br />
all species tested, but individual weed species did respond to specific<br />
concentrations <strong>of</strong> the chemicals tested. This corresponds with earlier<br />
findings by Murdoch & Carmona (1993), who investigated ways to deplete<br />
seed banks by stimulating seeds to germinate.<br />
Germination values <strong>of</strong> below 40% for A. calendula for all treatments<br />
tested after the 4 day incubation period, indicated that seeds <strong>of</strong> this<br />
species were in a dormant state and that this dormancy was most<br />
probably not due to the shortage <strong>of</strong> growth stimulators such as gibberellic<br />
acid, kinetin or hydroxylamine. These results support earlier findings by<br />
Mayer & Poljak<strong>of</strong>f-Mayber ( 982). Ellery & Chapman (2000) showed that<br />
light may reduce dormancy in A. calendula seeds, while Chaharsoghi &<br />
Jacobs ( 998) found that germination <strong>of</strong> this species can be enhanced<br />
5<br />
Periods<br />
Weed species Chemical Concentration 0-3<br />
days<br />
Raphanus<br />
raphanistrum<br />
Mean 8.4 a<br />
Mean 2.0 b<br />
Mean 9.0 a<br />
Gibberellic acid 0 mg l -<br />
mg l -<br />
0 mg l -<br />
00 mg l -<br />
Hydroxylamine 0 mg l -<br />
3 mg l-<br />
0 mg l -<br />
30 mg l -<br />
Kinetin 0 mg l -<br />
0.2 mg l -<br />
0.3 mg l -<br />
0.5 mg l -<br />
7.5 fgh<br />
2.5 h<br />
2.5 efgh<br />
2.5 h<br />
7.5 fgh<br />
2.5 h<br />
0 h<br />
5 gh<br />
2.6 h<br />
2.6 h<br />
0 h<br />
0 h<br />
4-7<br />
days<br />
0 h<br />
0 h<br />
7.5 fgh<br />
22.5 cdefg<br />
0 h<br />
0 h<br />
5 gh<br />
7.5 fgh<br />
2.6 h<br />
5.3 gh<br />
0 h<br />
0 h<br />
0 h<br />
0 h<br />
5 gh<br />
40 bc<br />
0 h<br />
0 h<br />
2.5 h<br />
0 h<br />
8-10<br />
days<br />
0.5 efgh<br />
5.8 efgh<br />
6.7 efgh<br />
25 cdef<br />
Mean 3.8 b 4.2 b 10.0 a 8.3 a<br />
LSD ‘t’ Main effect chemical (P ≤ 0.05) = 2.4 *<br />
LSD ‘t’ Main effect concentration (P ≤ 0.05) = 2.8 *<br />
LSD ‘t’ Main effect periods (P ≤ 0.05) = 3.1 *<br />
LSD ‘t’ chemical x concentration (P ≤ 0.05) = 4.9 N.S.<br />
LSD ‘t’ chemical x periods (P ≤ 0.05) = 5.3 *<br />
LSD ‘t’ concentration x periods (P ≤ 0.05) = 6.2 N.S<br />
LSD ‘t’ chemical x concentration x periods (P ≤ 0.05) = 10.7 *<br />
* P ≤ 0.05 = Significant, N.S. = Not Significant<br />
Cumulative %<br />
100<br />
90<br />
80<br />
70<br />
60<br />
50<br />
40<br />
30<br />
20<br />
10<br />
0<br />
3 7 10 14<br />
Germination period (days)<br />
0mg/l 1mg/l<br />
10mg/l 100mg/l<br />
Cumulative %<br />
100<br />
90<br />
80<br />
70<br />
60<br />
50<br />
40<br />
30<br />
20<br />
10<br />
0<br />
3 7 10 14<br />
Germination period (days)<br />
0mg/l 3mg/l<br />
10mg/l 30mg/l<br />
11-14 days Mean<br />
0 h<br />
0 h<br />
0 efgh<br />
25 cdef<br />
0 h<br />
0 h<br />
2.5 h<br />
0 h<br />
3.2 efgh<br />
3.2 efgh<br />
9.4 cdefg<br />
6.7 efgh<br />
.9 e<br />
0.6 e<br />
8.8 d<br />
22.5 ab<br />
.9 e<br />
0.6 e<br />
2.5 e<br />
3. e<br />
7.2 d<br />
9.2 d<br />
9.0 d<br />
0.4 d<br />
by scarification.<br />
Although low germination percentages for the control treatments <strong>of</strong><br />
R. raphanistrum indicated that seeds <strong>of</strong> this species were also dormant,<br />
germination <strong>of</strong> this species was significantly (p ≤ 0.05) improved (or<br />
inhibited) by specific concentrations <strong>of</strong> one or more <strong>of</strong> the chemicals<br />
tested. Dormancy in this species, as also found by Harradine ( 986),<br />
were therefore most probably the result <strong>of</strong> some chemical obstruction.<br />
In contrast to this, high cumulative germination values <strong>of</strong> the control<br />
treatments <strong>of</strong> E. australis clearly indicated that seeds <strong>of</strong> this species<br />
used in the experiment were not dormant. Germination <strong>of</strong> E. australis<br />
seed were increased to nearly 00% after 4 days <strong>of</strong> incubation by<br />
high concentrations <strong>of</strong> hydroxylamine as well as low and medium<br />
concentrations <strong>of</strong> kinetin.<br />
Figure 3 Cumulative germination <strong>of</strong> R. raphanistrum due to (a) gibberellic acid, (b) hydroxylamine and (c) kinetin treatments.<br />
Cumulative %<br />
100<br />
90<br />
80<br />
70<br />
60<br />
50<br />
40<br />
30<br />
20<br />
10<br />
0<br />
3 7 10 14<br />
Germination period (days)<br />
0mg/l 0.2mg/l<br />
0.3mg/l 0.5mg/l<br />
ELSENBURG JOURNAL<br />
2006 (4)
Conclusions<br />
This study showed that different chemical concentrations might have<br />
an effect on breaking dormancy <strong>of</strong> different weed seeds. This is due to<br />
differing weed seeds that differ according to the state and longevity <strong>of</strong><br />
dormancy as well as the physiological basis <strong>of</strong> dormancy.<br />
References<br />
. BEWLEY, J. D. & BLACK, M., 982. Physiology and biochemistry <strong>of</strong> seeds<br />
in relation to germination – Viability, dormancy and environmental control.<br />
Springer-Verlag. New York.<br />
2. CHAHARSOGHI, A. T. & JACOBS., B., 998. Manipulating dormancy <strong>of</strong><br />
capeweed (Arctotheca calendula L.) seed. Seed Science Research 8, 39<br />
– 46.<br />
3. CORNS, W.M. G., 959. Effects <strong>of</strong> gibberellin treatments on germination <strong>of</strong><br />
various species <strong>of</strong> weed seeds. Canadian Journal <strong>of</strong> Plant Science 40, 47<br />
– 5 .<br />
4. DUKE, O. S., 985. Weed physiology: Production and Ecophysiology. Volume<br />
. CRC Press, Inc. Florida.<br />
5. ELLERY, A. J. & CHAPMAN, R., 2000. Embryo and seed coat factors produce<br />
seed dormancy in capeweed (Arctotheca calendula). Australian Journal <strong>of</strong><br />
Agricultural Research 5 , 849 – 854.<br />
6. ESASHI, Y., OHHARA, Y., OKAZAKI, M. & HISHINUMA, K., 979. Control<br />
<strong>of</strong> cocklebur seed germination by nitrogenous compounds: Nitrite, nitrate,<br />
hydroxylamine, thiourea, azide and cyanide. Plant and Cell Physiology 20 (2),<br />
349 – 36 .<br />
7. GARDNER, F. P., PEARCE, R.B. & MITCHELL, R.L. (eds.), 985. Physiology<br />
Questioning current milk<br />
pricing structures in<br />
ELSENBURG JOERNAAL<br />
2006 (4)<br />
<strong>of</strong> crop plants. Iowa State University Press, Ames, USA.<br />
8. HARRADINE, A. R., 986. Seed longevity and seedling establishment <strong>of</strong><br />
Bromus diandrus Roth. Weed Research 26, 73 – 80.<br />
9. HURTT, W. & TAYLORSON, R. B., 986. Chemical manipulation <strong>of</strong> weed<br />
emergence. Weed Research 26, 259 – 267.<br />
0. IGBINNOSA, I. & OKONKWO, S. N. C., 992. Stimulation <strong>of</strong> germination <strong>of</strong><br />
seeds <strong>of</strong> cowpea witchweed (Striga gesnerioides) by Sodium Hypochlorite and<br />
some growth regulators. Weed Science 40, 25 – 28.<br />
. MANOTO, M.M., FERREIRA, M.I. & AGENBAG, G. A., 2004. The effect <strong>of</strong><br />
temperature on the germination <strong>of</strong> six selected weed species. South African<br />
Journal <strong>of</strong> Plant and Soil 2 (4), 2 4 –2 9.<br />
2. MAYER, A. M. & POLJAKOFF-MAYBER, A. 982. The germination <strong>of</strong> seeds.<br />
Third edition. Pergamon Press Ltd. New York.<br />
3. METZGER, J. D., 983. Promotion <strong>of</strong> germination <strong>of</strong> dormant weed seeds by<br />
substituted phthalimides and gibberellic acid. Weed Science 3 , 285 –289.<br />
4. MOORE, R., CLARK, W.D. & VODOPICH, D.S., 998. Botany. Second edition.<br />
McGraw-Hill. Boston.<br />
5. MURDOCH, A.J. & CARMONA, R., 993. The implications <strong>of</strong> the annual<br />
dormancy cycle <strong>of</strong> buried weed seeds for novel methods <strong>of</strong> weed control.<br />
Brighton crop protection conference - Weeds, 329 – 334.<br />
6. POVILAITIS, B., 956. Dormancy studies with seed <strong>of</strong> various weed species.<br />
Proceedings <strong>of</strong> the International Seed Testing Association 2 , 99 – 0 .<br />
7. [SAS] Statistical Analysis Systems. 987. SAS/STAT Guide for personal<br />
Computers. Version 6. Cary, NC: Statistical Analysis Systems Institute.<br />
8. WOOD, B.L., McDaniel, K. C. & CLASON, D., 997. Broom snake weed (Gutierrezia<br />
sarothrae) dispersal, viability and germination. Weed Science 45, 77 – 84.<br />
the dairy industry in South Africa<br />
C.J.C. MuLLER & N.R. RoBERTSoN<br />
Introduction<br />
The milk pricing system for dairy farmers in South Africa was previously controlled by the Dairy Board. Basically<br />
two pricing systems were used, i.e. one for fresh or liquid milk consumtion and another for industrial or processed<br />
milk. A higher price was usually paid for fresh milk. In 983, the Dairy Board adopted the slogan “Milk is Milk” in an<br />
effort to pay all farmers a uniform price for their milk. Currently, milk prices are determined by the milk processors<br />
themselves resulting in various milk pricing structures. Payment for fresh milk is based on volume (liters) containing<br />
minimum levels <strong>of</strong> fat and protein percentages. The payment for milk for processing is based on the amount (kg) <strong>of</strong><br />
fat and protein produced. The payment for fat and protein usually varies with a higher price for protein. Sometimes<br />
an additional premium is paid for protein to stimulate a higher protein production. Most milk processors also provide<br />
fresh milk to the market. Notwithstanding all the efforts to change, there are still real price disparities between fresh<br />
and industrial milk. Farmers still compare milk prices directly regardless <strong>of</strong> payment system. Individual milk prices<br />
will always differ because <strong>of</strong> different fat and protein percentages in milk and the amount <strong>of</strong> milk produced.<br />
Fat and protein yield<br />
Most dairy processors have found that the fat and protein percentage <strong>of</strong><br />
the milk that is collected from farmers on a daily basis is lower than what<br />
it was 5 to 20 years ago. Various factors may have contributed to this,<br />
but it is probably because <strong>of</strong> the antagonistic relationship between milk<br />
volume and fat and protein percentages. This reduction in fat and protein<br />
percentages presents a problem for dairy processors as the production<br />
cost <strong>of</strong> most milk products is increased because <strong>of</strong> the lower contents.<br />
The increase in production costs is related to the higher transport and<br />
handling costs <strong>of</strong> milk with lower fat and protein percentages as more<br />
liters <strong>of</strong> milk are required to produce specific amounts <strong>of</strong> the same<br />
product. Fat and protein yields are determined by both the volume <strong>of</strong> milk<br />
produced and the percentage <strong>of</strong> fat and protein (Table ).<br />
Fat or protein yields are increased by either increasing the volume<br />
<strong>of</strong> milk produced or the fat and protein percentage in the milk or by<br />
changing both the amount and contents <strong>of</strong> milk. Because the payment<br />
for milk is based on the amount <strong>of</strong> fat and protein produced, the same<br />
basic price is being paid for milk regardless whether the milk has a high<br />
or low fat and protein percentage. This causes contrasting interests for<br />
farmers and dairy processors. Dairy farmers tend to increase the volume<br />
<strong>of</strong> milk while dairy processors on the other hand, need milk containing<br />
higher fat and protein percentages to reduce the production cost <strong>of</strong> dairy<br />
products. Farmers increase the volume <strong>of</strong> milk through better feeding<br />
and genetics by increasing the average milk yield <strong>of</strong> cows in the herd<br />
Table 1. The effect <strong>of</strong> the volume <strong>of</strong> milk and the fat or protein<br />
percentages on fat or protein yield (kg fat/protein per cow per day)<br />
Fat/<br />
Protein%<br />
Milk yield (liters/cow/day)<br />
12.1 14.6 17.7 21.4 25.9 31.4 38.0<br />
3.0 0.36 0.44 0.53 0.64 0.77 0.94 . 4<br />
3.6 0.44 0.53 0.64 0.77 0.93 . 3 .37<br />
4.4 0.53 0.64 0.77 0.94 . 3 .37 .67<br />
5.3 0.64 0.77 0.94 . 3 .37 .66 2.0<br />
6.4 0.77 0.93 . 3 .37 .66 2.0 2.43<br />
or by milking a larger number <strong>of</strong> cows. The problem for processors is<br />
that less cheese is made per batch from milk containing less solids per<br />
volume. The size <strong>of</strong> milk vats in dairy plants is fixed and the amount <strong>of</strong><br />
cheese that is produced from each vat depends mainly on the fat and<br />
protein percentage in the milk. The predicted Cheddar cheese production<br />
from a 00 kg <strong>of</strong> milk decreases from 3.7 to 9.5 kg when the fat and<br />
protein percentage <strong>of</strong> milk decreases from 5.50 and 4.20% to 3.50 and<br />
3.00%, respectively. Because <strong>of</strong> the lower fat percentage, some 0.35 kg<br />
extra fat that would have been produced for butter, is lost. Prices for milk<br />
to be used for processing should encourage farmers to supply milk that<br />
contains high fat and protein percentages. The volume <strong>of</strong> milk should<br />
also be considered as that affects transport cost. The volume could be<br />
6
increased by milking more cows in a herd. Dairy farmers will only adopt<br />
a different approach to milk components and yield if there is a financial<br />
incentive to provide the type <strong>of</strong> milk that processors require.<br />
Penalising volume<br />
Some countries have a milk pricing system based on prices paid per<br />
kg fat and protein with a penalty (a negative value) on the volume <strong>of</strong><br />
milk produced. This is done presumably in an effort to encourage the<br />
production <strong>of</strong> milk containing more milk solids. It is, however, doubtful<br />
whether this practice will produce the desired results. In Table 2 the effect<br />
<strong>of</strong> a penalty on milk volume on the income <strong>of</strong> Holstein cows per lactation<br />
is shown.<br />
Table 2: The effect <strong>of</strong> a negative price on the volume <strong>of</strong> milk produced<br />
on the income per lactation <strong>of</strong> cows in a Holstein herd<br />
Production year Change<br />
Parameters Price 1983/84 1997/98 (%)<br />
Milk (kg) -5c/liter 5 2 8360 +64<br />
Fat (kg) R5/kg 89 293 +55<br />
Prot (kg) R 2/kg 72 269 +56<br />
Income (R) 2753 4275 +55<br />
Ways to increase the milk price<br />
Milk pricing structures vary between different milk processors. The current<br />
milk pricing structure at <strong>Elsenburg</strong> is based on the amount <strong>of</strong> fat and<br />
protein produced with a bonus system to stimulate protein production.<br />
Deductions are made for transport cost based on the distance between<br />
the farm and the processing plant (starting at 30 km) and also milk quality<br />
based on somatic cell count and total plate count. According to this milk<br />
pricing structure, various options could be considered to increase the<br />
price <strong>of</strong> milk above a standard price (Table 3). This includes options<br />
such as milking more cows (Option ), increasing the milk yield per cow<br />
(Option 2), increasing the protein percentage <strong>of</strong> the milk (Option 3) or<br />
milking an even larger number <strong>of</strong> cows (Option 4).<br />
Table 3: The effect <strong>of</strong> different options on the milk price realised for<br />
a Jersey herd<br />
Parameters options<br />
Standard 1 2 3 4<br />
Number <strong>of</strong> cows 0 82 82 82 460<br />
Daily milk yield (kg) 5 5 9.5 5.0 5<br />
Protein (%) 3.80 3.80 3.80 4.94 3.80<br />
Protein volume premium (c/liter) 0 5 7 7 30<br />
Milk price (c/liter) 200 2 5 2 7 2 7 230<br />
By milking 0 cows, the price <strong>of</strong> milk for this herd is 200 c/liter. By<br />
increasing the number <strong>of</strong> cows in the herd to 82, the price <strong>of</strong> milk increases<br />
by 5 c/liter. It is increased by another 2 c/liter when the average milk<br />
yield in the herd increases from 5 to 9.5 liters/cow/day. The same<br />
response is obtained when the protein content <strong>of</strong> the milk increases from<br />
3.80 to 4.94%. Increasing the average milk yield or protein percentage<br />
<strong>of</strong> the milk in a herd to such an extent over a short period <strong>of</strong> time, would<br />
imply a herd <strong>of</strong> high genetic merit that was previously grossly underfed.<br />
As the standard production level used in the example is typical for Jersey<br />
cows; both options 2 and 3 would only be achieved over a substantial<br />
period <strong>of</strong> time through improved genetic and management means. The<br />
results are also small, only a 2 c/liter increase on the current milk price.<br />
Increasing the number <strong>of</strong> cows in the herd to 460 resulted in another 5<br />
c/liter increase in the protein bonus. Based on this milk pricing structure,<br />
the best way to improve the milk price would be to increase the volume <strong>of</strong><br />
milk produced by milking more cows. For different milk pricing structures<br />
different options need to be considered. This makes recommendations<br />
regarding sire selection and the correct feeding and management<br />
programme to receive the best milk price very difficult.<br />
Increasing the volume <strong>of</strong> milk<br />
The variation in milk yield between cows is large and high milk yield<br />
levels are possible. Increasing the milk yield <strong>of</strong> cows is usually easy<br />
because it mainly involves feeding more and higher quality feeds. The<br />
amount <strong>of</strong> milk dairy cows produce is dependant on their total energy<br />
intake. The amount and quality <strong>of</strong> the forages (pasture, hay or silage) and<br />
supplementary concentrates determine the total energy intake <strong>of</strong> cows.<br />
The condition <strong>of</strong> the cows at calving also affects the amount <strong>of</strong> milk cows<br />
produce.<br />
7<br />
Increasing the milk composition <strong>of</strong> milk<br />
It is difficult to increase the fat and protein percentages <strong>of</strong> milk by feeding<br />
as it involves contrasting feeding regimes. To increase the protein<br />
percentage in the milk, more energy in the diet is needed. This is usually<br />
supplied by feeding more or a higher quality concentrate mixture. By<br />
increasing the amount <strong>of</strong> concentrates in the diet, cows may start to<br />
ruminate less because <strong>of</strong> a shortage <strong>of</strong> fibre. This reduces the saliva<br />
production <strong>of</strong> cows resulting in a more acidic rumen. This reduces the<br />
number <strong>of</strong> acetic acid producing bacteria in the rumen and that results in<br />
milk having a lower fat percentage. Artificial buffers must then be included<br />
in the diet to protect the rumen against high acidity levels and a drop in<br />
fat percentage.<br />
The total diet <strong>of</strong> dairy cows should always contain a minimum<br />
roughage level. For higher fat percentages more roughages or artificial<br />
buffers must be included in the diet to keep the acidity level in the rumen<br />
low. This effectively puts a limit on the maximum amount <strong>of</strong> concentrates<br />
in the diet. For cows on pasture, additional roughages like hay or straw<br />
are sometimes fed in an effort to increase rumination and to maintain or<br />
improve the fat percentage in the milk. This, however, could lead to a<br />
lower total feed and energy intake with a reduction in the milk yield and<br />
protein percentage. This could ultimately result in a reduced milk price<br />
and therefore milk income. According to the milk production results in<br />
a study where straw was fed additionally to cows on pasture, the net<br />
improvement in the milk price was small (less than c/litre) without<br />
regarding the extra cost <strong>of</strong> feeding the straw.<br />
Sire selection<br />
Based on heritability estimates, the genetic effect on milk production<br />
and milk composition in dairy herds is medium to high. The genetic<br />
relationship between milk volume and fat or protein yields is high and<br />
positive, while the relationships between volume and percentages are<br />
negative. Emphazing the volume <strong>of</strong> milk could result in milk containing<br />
less solids. This is to the disadvantage <strong>of</strong> dairy processors. With a high<br />
emphasis on fat and protein percentages, the volume <strong>of</strong> milk could be<br />
reduced to the disadvantage <strong>of</strong> farm income. A payment system based<br />
on prices paid per kg fat and protein provides little financial incentive to<br />
produce high solids milk. Sires are <strong>of</strong>ten labelled as high volume or high<br />
component bulls. Ranking sires according to their genetic income (based<br />
on a payment system for kg fat and protein), it is <strong>of</strong>ten found that bulls<br />
with high components rank lower than high volume bulls. This is because<br />
<strong>of</strong> lower fat and protein yields. Changing the genetic status <strong>of</strong> dairy cows<br />
in terms <strong>of</strong> milk volume and components is possible although difficult.<br />
This is dependant on a long term strategy and different sire selection<br />
criteria are needed both on farm and by AI companies.<br />
Conclusions<br />
The milk pricing structure <strong>of</strong> dairy processors affects the feeding and<br />
breeding programmes in dairy herds. A milk pricing structure based on<br />
fat and protein yields results in an increase in the volume <strong>of</strong> milk. This is<br />
in contrast to the requirement <strong>of</strong> dairy processors who need milk <strong>of</strong> high<br />
fat and protein percentages. A penalty on milk volume does not provide<br />
enough financial incentive to increase the fat and protein percentages<br />
in milk. The financial implications <strong>of</strong> feeding supplementary roughages<br />
or concentrates to change the fat or protein percentage in milk should<br />
be considered holistically. There is little incentive to feed straw to cows<br />
on pasture to improve the fat percentage in the milk if that results in less<br />
milk and a lower protein percentage and a reduction in the milk income.<br />
Milk pricing structures <strong>of</strong> dairy processors should include the volume <strong>of</strong><br />
milk produced and the percentages <strong>of</strong> fat and protein in the milk. A sliding<br />
scale should be used emphazing higher fat and protein percentages.<br />
This will provide the financial incentive to farmers to adopt appropriate<br />
feeding, breeding and management strategies to supply a product that<br />
accords with the requirements <strong>of</strong> dairy processors.<br />
ELSENBURG JOURNAL<br />
2006 (4)
Possible effects <strong>of</strong> the<br />
co-operative principles and co-<br />
operative action approach: a case <strong>of</strong><br />
wine co-operatives<br />
Data sources and research methodology<br />
The target population <strong>of</strong> 50 wine cooperatives in the <strong>Western</strong> Cape<br />
were sent questioners by e-mail and personally and telephonically<br />
interviewed during May 2006, to obtain information about ( ) beliefs on<br />
cooperative principles and (2) belief on collective action approach. Out<br />
<strong>of</strong> 50 cooperatives 28 cooperatives returned usable questionnaire. Each<br />
cooperative was represented by one respondent and attributed <strong>of</strong> different<br />
levels <strong>of</strong> believes. These believe were tested using an index from their<br />
scores on Likert type scales that show how they agree or disagree with<br />
the following statements:<br />
( ) Wine cooperatives should accept any farmer who wants to join<br />
(2) Wine cooperatives should practice one person, one vote<br />
(3) The voting system <strong>of</strong> the cooperatives should be based on the<br />
member’s shares<br />
(4) Cooperative members should receive their returns based on their<br />
turnover in cooperative principle<br />
(5) Wine cooperatives should support education in cooperative principle<br />
for members and the public<br />
(6) Members receive benefits from doing business the cooperative way<br />
(7) Farmers must stick together in order to get things done even if they<br />
have to give up some <strong>of</strong> their individual freedom<br />
(8) An individual farmer can usually make better marketing decisions<br />
than a group <strong>of</strong> farmers<br />
(9) Members <strong>of</strong> wine cooperatives have a competitive advantage in the<br />
market place (see table ).<br />
To promote accuracy <strong>of</strong> opinions, respondents were given neutral and no<br />
opinions responses. In measuring the believes the following Likert type<br />
scales were used;<br />
1= strongly agree; 2 = agree; 3 = neutral; 4 = strongly disagree; 5 =<br />
disagree; and 6 = no opinion. To interpret the results the author relied<br />
on the literature, using various interpretations as justified by the New<br />
Institutional Economics theories.<br />
Results and discussion<br />
Many Cooperative scholars understand principles as iron-clad<br />
commandments that must be followed (Amin et al, 996; Hanel, A,<br />
992; Nilsson, J 200 etc.). It is believed that these principles provide<br />
standards <strong>of</strong> measurement that restrict and even prohibit certain actions<br />
while encouraging others. Prakash (2003) asserts that principles that<br />
forms the heart <strong>of</strong> cooperatives are not independent <strong>of</strong> one another and<br />
that they are subtly linked and eventually diminish when one <strong>of</strong> them<br />
is ignored. The rationale <strong>of</strong> these principles is to provide guidelines by<br />
ELSENBURG JOERNAAL<br />
2006 (4)<br />
PHuMLANI S. MENTANI<br />
Iintroduction and background<br />
Since its creation in 1895, the International Cooperative Alliance has been the final authority for defining cooperatives<br />
(Prakash, 2003) and for elaborating the principles upon which cooperatives should be based. Previously the Alliance<br />
had made two formal declarations on cooperative principles, the first in 1937 and the second in 1996 (Prakash,<br />
2003). These two earlier versions, like the 995 reformulation, were attempts to explain how cooperative principles<br />
should be interpreted in the contemporary world.<br />
Throughout its history, the cooperative movement has constantly changed and there still a great potential for it<br />
to do so even in the future. Beneath the changes, however lies a fundamental respect for all beings and a belief in<br />
their capacity to improve themselves economically and social through mutual self-help.<br />
However, this paper focuses on few cooperative principles that are believed to be influential pillars on how<br />
cooperative governance executes its practices. It was postulated in this paper that the benefits <strong>of</strong> the cooperative<br />
members may be subject to the efficient coordination <strong>of</strong> the influence <strong>of</strong> cooperative principles. The paper also<br />
tested how respondents perceive the collective action approach. The aim was to determine whether the sentiments<br />
on collective action still exist in well-established commercial cooperatives.<br />
which cooperatives put their values into practice and thereby, developing<br />
members in order to effectively contribute to the development <strong>of</strong> their<br />
business.<br />
Evidently, the nature in which cooperative members contribute<br />
to their business is through collective action approach that primarily<br />
encourages the members to identify themselves and take personal<br />
interest in cooperative. One major reason for this approach is to benefit<br />
from the economies <strong>of</strong> scale practises. This argument incentives the<br />
organized functioning <strong>of</strong> a group <strong>of</strong> farmers into a single entity to realize<br />
their common interest.<br />
However, Amin, N et al ( 996) asserts that the collective action<br />
approach is likely to face high level <strong>of</strong> inefficiencies if the accomplishment<br />
<strong>of</strong> member’s goals is not connected to organisational principles and<br />
moreover if cooperative principles diminishes the incentives for members<br />
to assume an ownership interest in the cooperative.<br />
This implies that the benefits <strong>of</strong> the cooperative members may<br />
be subject to the efficient coordination <strong>of</strong> the influence <strong>of</strong> cooperative<br />
principles. Several statements were tested to solicit a general<br />
perspective <strong>of</strong> cooperative participants on cooperative principles as well<br />
as collective action approach. Irrespective <strong>of</strong> the current status <strong>of</strong> the<br />
wine cooperatives, evidence from the cooperative managers, directors<br />
and general managers on cooperative principles and collective action<br />
approach is indicated in the tables below.<br />
Member beliefs in cooperative principles were assessed by using<br />
the first six principles stated in table 1. These beliefs suggest that<br />
respondents strongly support most cooperative principles. With the<br />
exception <strong>of</strong> the “open membership” principle, at least 77 percent <strong>of</strong> the<br />
respondents disagreed and/or strongly disagreed with it and also the one<br />
men one vote principle was clearly not supported by the respondents with<br />
8 percent. Some other cooperative principles that involve acquisition <strong>of</strong><br />
returns and shares, education and cooperative way <strong>of</strong> doing business<br />
were somewhat over contested with the majority <strong>of</strong> the respondents<br />
agreeing while a reasonable percentage became unsure and few had no<br />
opinions. The clearly contested principles with 77 and 8 percent suggest<br />
to a certain extent a potential to invoke challenges on governance should<br />
they strictly applied in wine cooperatives.<br />
However, the importance <strong>of</strong> the benefit from the collective action<br />
approach was also shown by the above assessment. Evidently, in spite<br />
<strong>of</strong> the few respondents who were neutral and had no opinion, the majority<br />
<strong>of</strong> the participants supported the collective action approach. Out <strong>of</strong> three<br />
beliefs, namely, ) Farmers must stick together in order to get things<br />
done even if they have to give up some <strong>of</strong> their individual freedom, 2)<br />
An individual farmer can usually make better marketing decisions than a<br />
group <strong>of</strong> farmers,<br />
8
Table 1. Total Number <strong>of</strong> respondents on cooperative principles and collective action approach<br />
3) Members <strong>of</strong> wine cooperatives have a competitive advantage in the<br />
market place. About 77 percent agreed and strongly agreed that farmers<br />
must stick together even if they have to give up some <strong>of</strong> their individual<br />
freedom. 45% rejected or disagreed that an individual farmer can make<br />
better marketing decisions than a group <strong>of</strong> farmers. The beliefs on the<br />
competitive advantage <strong>of</strong> the wine cooperative members in the market<br />
place have shown much ambivalence with 4 percent disagreed and<br />
strongly disagreed. 36 percent <strong>of</strong> the respondents were neutral showing<br />
mixed feelings about the dominance <strong>of</strong> the cooperative members in the<br />
market place. By implication the collective action practices in the wine<br />
cooperative is still well supported and perceived as a vehicle to access<br />
the market.<br />
9<br />
Strongly<br />
Agree<br />
Agree Neutral Strongly<br />
Disagree<br />
Disagree No<br />
Opinion<br />
.Wine cooperatives should accept any farmer who wants to join. 0 4 8 9 0 22<br />
2. Wine cooperatives should practice one person, one vote 3 0 8 0 0 22<br />
3. The voting system <strong>of</strong> the cooperatives should be based on the member’s<br />
shares.<br />
3 5 2 0 22<br />
4. Cooperative members should receive their returns based on their<br />
turnover in cooperative principles<br />
5 2 2 22<br />
5. Wine cooperatives should support education in cooperative principle for<br />
members and the public<br />
3 2 4 22<br />
6. Members receive benefits from doing business the cooperative way 5 6 3 5 3 22<br />
7. Farmers must stick together in order to get things done even if they have<br />
to give up some <strong>of</strong> their individual freedom.<br />
6 3 0 22<br />
8. An individual farmer can usually make better marketing decisions than a<br />
group <strong>of</strong> farmers<br />
8 2 8 2 2<br />
9. Members <strong>of</strong> wine cooperatives have a competitive advantage in the<br />
market place<br />
4 8 7 2 0 22<br />
Table 2 Percentage <strong>of</strong> respondents on cooperative principles and<br />
collective action approach<br />
0% 8% 5% 36% 4 % 0% 00%<br />
5% 4% 0% 36% 45% 0% 00%<br />
59% 23% 9% 5% 5% 0% 00%<br />
23% 50% 9% 9% 5% 5% 00%<br />
4% 55% 5% 4% 5% 5% 00%<br />
23% 27% 4% 23% 4% 5% 00%<br />
27% 50% 5% 4% 0% 5% 00%<br />
5% 36% 9% 36% 9% 00%<br />
5% 8% 36% 32% 9% 0% 00%<br />
Total<br />
Concluding remarks<br />
The cooperative principles are argued to be the lifeblood <strong>of</strong> the<br />
cooperative movement, derived from the values that have infused the<br />
movement from its beginnings. It is also believed that these principles<br />
shape the structures and determine the attitudes that provide the<br />
collective movement’s distinct perspectives.<br />
The cooperative movement is a movement <strong>of</strong> perpetual promise,<br />
a movement <strong>of</strong> becoming, not <strong>of</strong> ending. It never achieves a state <strong>of</strong><br />
perfection nor it never rests satisfied with what it has accomplished. It is<br />
a movement that is always torn between what its philosophy suggests<br />
and the contemporary world requires. It is a movement that fails unless<br />
committed, pragmatic cooperators continuously consider the choices<br />
their cooperatives must make in responding to members’ needs, in<br />
achieving proper goals, and in adhering to cooperative principles in their<br />
daily activities. They are choices that are never finally made. There are<br />
no decisions that are completely perfect.<br />
References<br />
. AMIN, N & BERNSTEIN, H. ( 996). The role <strong>of</strong> Agricultural Co-operatives in<br />
Agricultural and Rural Development. Land and <strong>Agriculture</strong> Policy Center. Policy<br />
Paper.<br />
2. HANEL, A. ( 992). Basic Aspects <strong>of</strong> Cooperative Organisations and Cooperative<br />
Self- Help Promotion in Developing Countries: Theory and Practice <strong>of</strong> Self-<br />
Help Promotion. Marburg Consult for Self-Help Promotion. Series A-3.<br />
3. NILSSON, J. (200 ). Organisational Principle for co-operative Firms.<br />
Scandinavian Journal <strong>of</strong> Management. Pergamon. 7: 336-33<br />
4. PRAKASH, D. (2003). The Principles <strong>of</strong> Co-operation. A Look at the ICA<br />
Cooperative Identity Statement<br />
ELSENBURG JOURNAL<br />
2006 (4)
Die invloed van verpilling<br />
van diete op die produksie<br />
van slagvoëls<br />
Inleiding<br />
Minson ( 963) en Calet ( 965) skryf die verbetering in diereproduksie<br />
met die voer van verpilde diëte teenoor meel diëte ho<strong>of</strong>saaklik toe aan<br />
verhoogde innames by onderskeidelik herkouers en pluimvee. Wainman<br />
et al ( 972) is van mening dat met herkouers nie net verhoogde innames<br />
nie, maar ook chemiese verandering verbeterde produksie tot gevolg het.<br />
Vermindering in die vermorsing van voer met die voer van verpilde diete<br />
speel ook ’n baie groot rol in die verbetering in benutting van verpilde<br />
diete teenoor meel diete.<br />
Teenstrydige resultate is verkry deur die hermaal van verpilde diëte<br />
vir pluimvee. Allred et al ( 957) het bevind dat groei steeds verbeter<br />
is, maar Arscott et al ( 957) het nie groei verskille tusen hergemaalde<br />
en onverpildediëte ondervind nie. Die voordeel in produksie wat met<br />
verpilde diëte met varke verkry word kan volgens Lawrence( 978)<br />
aan verminderde vermorsing, maar ook aan fisiese (vooraf maal en<br />
saampersing) en chemiese verandering van die diëet toegeskryf word.<br />
Daar is ook menings verskille <strong>of</strong> veranderinge wat diëte met verpilling<br />
ondergaan behoue bly met hermaal van verpilde diëte. Van die<br />
veranderinge wat ondervind word, is verminderde ruveselinhoud (Baird,<br />
973; Lawrence, 97 ), verbeterde droëmateriaal en energie vertering<br />
(Gorrill et al, 960)en verhoogde aminosuur beskikbaarheid (Yen et al,<br />
97 ).<br />
Minson ( 963), Calet ( 965) en Vanschoubroek et al ( 97 ) maak<br />
almal melding van die verminderde vermorsing, minder st<strong>of</strong>, makliker<br />
hantering en beter vermening van grondstowwe wat met verpilde<br />
rantsoene verkry word.<br />
Met enkelmaagdiere is bevind dat die verbeterde produksie as gevolg<br />
van verpilling afneem met ’n verhoging in die netto energie waarde van<br />
die diëte (Vanschoubroek et al, 97 ). Greenhalgh en Wainman( 972)<br />
ELSENBURG JOERNAAL<br />
2006 (4)<br />
B.B.AuCAMP & T.S. BRAND<br />
Inleiding<br />
In oorsigte van navorsingsresultate oor die invloed van verpilde diëte op die produksie van enkelmaagdiere het<br />
resultate met varke (Vanschoubroek et al, 97 ; Braude, 972) sowel as pluimvee ( Calet, 965) in die meerderheid<br />
studies getoon dat groeitempo verhoog en voeromset doeltreffender is met verpilde diëte in vergelyking met meel<br />
diëte. Enkelmaag diere het in die algemeen ’n voorkeur vir verpilde diëte waar ’n keuse gebied word. Minson<br />
( 963) het in ’n oorsig oor die invloed van verpilde diëte vir herkouers bevind dat verpilling groeitempo en inname<br />
verhoog het. Alhoewel verteerbaarheid van voere effens afneem as gevolg van die vinniger deurvloei deur<br />
spysverteringskanaal, lei hoër innames tot beter voeromset doeltreffendheid.<br />
Tabel 1: Groeidiëte vir slagvolstruise met onderskeidelik ’n normale<br />
en lae energiewaarde<br />
Bestandele (kg/ton)<br />
Lusern<br />
Gars<br />
Sojaboon oliekoek<br />
Mellassestroop<br />
Monokalsiumfosfaat<br />
Voerkalk<br />
Plantolie<br />
Fynsout<br />
Mineraal en Vitamien Premix<br />
Sintetiese metionien<br />
Normale<br />
energiewaarde<br />
4 4<br />
440<br />
96<br />
25<br />
8.5<br />
6<br />
2.5<br />
4<br />
2.5<br />
.5<br />
Berekende samestelling (natuurlike vogbasis)<br />
Diëte<br />
Laer<br />
energiewaarde<br />
677<br />
200<br />
66<br />
25<br />
4<br />
0<br />
0<br />
4<br />
2.5<br />
.5<br />
en Minson( 963) het met herkouers bevind dat die effek van verhoogde<br />
groeitempo en inname wat deur verpilling van diëte met hoë ruveselinhoud<br />
verkry word, verhoog namate die kwaliteit van die ruvoer verswak.<br />
Die laer spysverteringskanaal van volstruise is baie langer as die<br />
van ander enkelmaag diere (Bezuidenhout en Van Aswegen, 990).<br />
Volstruise is daarom in staat om op laer kwaliteit voere met hoër<br />
veselinhoud (sellulose en hemisellulose) (Swart et al., 993; Brand,2003)<br />
te oorleef. Die vermoë van volstruise om hoë veselinhoud diëte te benut<br />
en die moontlikheid dat verpilling die benutting van hoë ruvesel diëte<br />
kan verbeter, het dus ’n ondersoek na die invloed van verpilde diëte op<br />
volstruisproduksie geregverdig.<br />
Metode<br />
Eenhonderd agt-en-sestig slagvoëls is op die ouderdom van 20 weke<br />
ewekansig volgens liggaamsmassa in agt groepe van 2 elk met ’n<br />
gemiddelde liggaamsmassa van 42.2 kg ingedeel. Vier groepe elk het<br />
diëte met energiewaardes van onderskeidelik 0.0 en .5 MJ ME per kg<br />
voer tydens die groeifase ontvang (2 groepe as meel en 2 groepe verpil).<br />
(Sien Tabel ). Vanaf 30 weke ouderdom het vier groepe elk diëte met<br />
energiewaardes van 8.8 en 0.0 MJ ME per kg voer onderskeidelik in<br />
die afrondingsfase ontvang (2 groepe as meel en 2 groepe verpil). (Sien<br />
Tabel 2). Liggaamsmassas is maandeliks geneem en voer inname per<br />
groep is bepaal. Groeitempo en voeromset per groep is bereken.<br />
Tabel 2: Afronddiëte vir slagvolstruise met onderskeidelik ’n normale<br />
en lae energiewaarde<br />
Bestandele (kg/ton)<br />
Lusern<br />
Gars<br />
Sojaboon oliekoek<br />
Mellassestroop<br />
Monokalsiumfosfaat<br />
Voerkalk<br />
Fynsout<br />
Mineraal en Vitamien Premix<br />
Sintetiese metionien<br />
Normale<br />
energiewaarde<br />
7 8<br />
209<br />
30<br />
25<br />
0.5<br />
0<br />
4<br />
2.5<br />
.0<br />
Berekende samestelling (natuurlike vogbasis)<br />
Diëte<br />
Lae<br />
energiewaarde<br />
938<br />
0<br />
0<br />
25<br />
2.5<br />
7<br />
4<br />
2.5<br />
.0<br />
0
Resultate<br />
Die produksie resultate van die volstruise word in Tabel 3 weergegee.<br />
Tydens die groeifase van die voëls is geen verskille as gevolg van die<br />
verpilling van die diëte <strong>of</strong> as gevolg van die energiewaarde van die diëte<br />
waargeneem nie. Tydens die afrondfase is beide die groeitempo van die<br />
voëls en die voeromset betekenisvol beinvloed. Voëls op verpilde diëte<br />
het 6% vinniger gegroei en ’n 24% beter voeromset gehad as voëls<br />
op die meel diëte. Voëls op diëte met ’n normale energiewaarde het<br />
terselfdertyd 25% vinniger gegroei en ’n 20% beter voeromset gehad as<br />
voëls op diete met ’n laer energiewaarde, soos verwag.<br />
Tabel 3: Die invloed van verpilling op die produksie van<br />
slagvolstruise<br />
Behandeling<br />
Inname, kg/<br />
dag/voël<br />
Groeifase: invloed van behandeling<br />
Pille<br />
Meel<br />
Invloed van energie<br />
Normale energie<br />
Laer energie<br />
.99 NBV<br />
2.00 NBV<br />
.95 NBV<br />
2.04 NBV<br />
PRoDuKSIE PARAMETER<br />
Groeitempo,<br />
g/d/voël<br />
328 NBV<br />
3 6 NBV<br />
325 NBV<br />
3 9 NBV<br />
Afrondingsfase: Invloed van behandeling<br />
Pille<br />
Meel<br />
Invloed van energie<br />
Normale energie<br />
Laer energie<br />
2.82 NBV<br />
3.02 NBV<br />
3.00 NBV<br />
2.84 NBV<br />
92 a<br />
66 b<br />
99 a<br />
59 b<br />
a, b Dui betekenisvolle (p≤0.05) verskille tussen behandelings aan.<br />
Voeromset,<br />
kg voer/kg<br />
massa<br />
toename<br />
6. 9 NBV<br />
6.67 NBV<br />
6.25 NBV<br />
6.6 NBV<br />
4.0 a<br />
8.5 b<br />
4.5 a<br />
8. b<br />
Gevolgtrekking<br />
’n Verbetering van 24% in voeromset weens verpilling is waargeneem<br />
tydens die afrondfase. Groeitempo van voëls op die verpilde diëte het<br />
ooreenkomstig met 6% verbeter. Die verpilling van volstruisdiëte is ’n<br />
praktyk wat redelik algemeen deur volstruisprodusente toegepas word.<br />
Alhoewel die verpilling van voere die koste van voere verhoog moet die<br />
hoër koste tenopsigte van infrastruktuur en arbeid ook opgeweeg word<br />
teen die beter vermenging van diëte, minder bergruimte wat benodig<br />
word, minder st<strong>of</strong> en makliker vervoer en hantering van verpilde diëte.<br />
Verpillingskoste word normaalweg bereken as 0% van die koste van<br />
grondst<strong>of</strong>koste (Brand en Jordaan, 2004).<br />
Bedankings<br />
Finansiële bydraes en ondersteuning vir die studie deur die Industriële<br />
venote (Wes-Kaap Diereproduksie Navorsingstrust, Wes-Kaap Volstruis<br />
Produsente Organisasie, Suid-Afrikaanse Volstruisbesigheidskamer en<br />
Klein Karoo Koöperasie ) en die Nasionale Navorsingstigting, word met<br />
dank erken.<br />
Verwysings<br />
. Allred, J.B., Fry, R.E., Jensen, L.S. & McGinnis, J., 957. Studies with chicks<br />
on improvement in nutritive value <strong>of</strong> feed ingredients by pelleting. Poultry Sci.<br />
36: 284- 289.<br />
2. Arscott, G.H., Hulit, V.L. & Pautz, R.K., 1957. The use <strong>of</strong> barley in high-efficiency<br />
broiler rations. 3. Effect <strong>of</strong> pellets and reground pellets on growth and efficiency<br />
<strong>of</strong> feed utilization. Poultry Sci. 36: 388- 389.<br />
3. Baird, D.M., 1973. Influence <strong>of</strong> pelleting swine diets on metabolizable energy,<br />
growth and carcass characteristics. J. Anim. Sci. 36: 5 6-52 .<br />
4. Bezuidenhout, A.J. & Van Aswegen, G., 990. A microscopic and<br />
immunocytochemical study <strong>of</strong> the gastro-intestinal tract <strong>of</strong> the ostrich (Struthio<br />
Camelus L.) Onderstepoort J. vet Res. 57: 37-48.<br />
5. Brand, T.S., 2003. Ostriches can thrive on high fibre diets. Feed mix. 11.4: 22-<br />
24.<br />
6. Brand, T.S. & Jordaan, J.W., 2004. Cost implications and possible savings in<br />
ostrich nutrition. Feed Technology. 8.2: 22-25.<br />
7. Braude, R., 972. Feeding methods. In: Pig prodution. Ed. D.J.A. Cole.<br />
Butterworths, London. Pp. 279-29 .<br />
8. Calet, C., 965. The relative value <strong>of</strong> pellets versus mash and grain in poultry<br />
nutrition. World Poult. Sci. J. 2 : 23-52.<br />
9. Gorrill, A.D.L., Bell, J.M. & Williams, C.M., 960. Ingredient and processing<br />
interrelationships in swine feeds. I. Effects <strong>of</strong> antibiotics, protein source and<br />
wheat bran on the responses to pelleted feed. Can. J. Anim. Sci. 40: 83-92.<br />
0. Greenhalgh, J.F.D. & Wainman, F.W., 972. The nutritive value <strong>of</strong> processed<br />
roughages for fattening cattle and sheep. Proc. Br. Soc. Anim. Prod. 6 -72.<br />
. Lawrence, T.L.J., 97 . Cubing the diet <strong>of</strong> the growing pig: Some effects on<br />
nutritive value <strong>of</strong> temperature, pressure and physical form. J. Sci. Fd Agric. 22<br />
403-406.<br />
2. Lawrence, T.L.D., 978. Processing and preparation <strong>of</strong> cereals for pig diets.<br />
In: Recent advances in animal nutrition. Eds. W. Haresign & D. Lewis.<br />
Butterworths, London. Pp. 83-98.<br />
3. Minson, D.J., 963. The effect <strong>of</strong> pelleting and wafering on the feeding value <strong>of</strong><br />
roughage- A review. J. Brit. Grassl. Soc. 8: 39-44.<br />
4. Swart, D., Mackie, R.I. & Hayes, J.P., 993. Fermentative digestion in the<br />
ostrich (Struthio camelus var. domesticus), a large avian species that utilizes<br />
cellulose. S.Afr.J.Anim.Sci. 23: 27- 35.<br />
5. Vanschoubroek, F., Coucke, L. & Van Spaendonck, R., 97 . The quantitative<br />
effect <strong>of</strong> pelleting feed on the performance <strong>of</strong> piglets and fattening pigs. Nutr.<br />
Abstr. Rev. 4 : -9.<br />
6. Wainman, F.W., Blaxter, K.L. & Smith, J.S., 972. The utilization <strong>of</strong> the energy<br />
<strong>of</strong> artificially dried grass prepared in different ways. J. Agric. Sci. Camb. 78:<br />
44 -447.<br />
7. Yen, J.T., Baker, D.H., Harmon, B.G. & Jensen, A.H., 97 . Corn gluten feed in<br />
swine diets and effect <strong>of</strong> pelleting on tryptophan availability to pigs and rats. J.<br />
Anim. Sci. 33: 987-99 .<br />
ELSENBURG JOURNAL<br />
2006 (4)
ELSENBURG JOERNAAL<br />
2006 (4)<br />
2


