Mussie Okbamichael and Sergio A. Sañudo-Wilhelmy. Direct ... - ASLO
Mussie Okbamichael and Sergio A. Sañudo-Wilhelmy. Direct ... - ASLO
Mussie Okbamichael and Sergio A. Sañudo-Wilhelmy. Direct ... - ASLO

You also want an ePaper? Increase the reach of your titles
YUMPU automatically turns print PDFs into web optimized ePapers that Google loves.
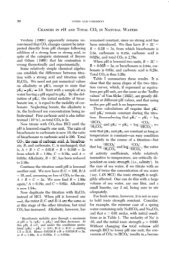
<strong>Okbamichael</strong> <strong>and</strong> <strong>Sañudo</strong>-<strong>Wilhelmy</strong> Determination of vitamin B 1 in seawater<br />
Fig. 2. Calibration curve for vitamin B 1 . Linearity was established using the<br />
least squares method in st<strong>and</strong>ard concentration ranges of 0 to 0.60 µM.<br />
The general protocol for the analysis of B 1 in seawater can<br />
be summarized as follows: collection of filtered water, pH<br />
adjustment of the water sample to be analyzed (between 6.1<br />
<strong>and</strong> 6.7), loading of the sample onto 5 mL C 18 resin at a flow<br />
rate of 1 mL min –1 , rinsing of the C 18 resin before sampleelution<br />
with 20 mL of Milli-Q water, B 1 elution with three<br />
aliquots of 5 mL methanol each, volatizing 1 mL of each 5 mL<br />
eluent to dryness with nitrogen, redissolving the B 1 extracted<br />
in 1 mL Milli-Q water, <strong>and</strong> HPLC detection at 270 nm. Determination<br />
of ambient B 1 at concentrations lower than those<br />
measured here could presumably be attained by preconcentrating<br />
higher volumes of seawater on the C 18 resin. Therefore,<br />
the preconcentration using solid phase extraction renders the<br />
method applicable to detect almost any levels of B 1 in natural<br />
waters. Additional concentration factors could also be attained<br />
by redissolving the dried methanol aliquots in less than 1 mL<br />
Milli-Q water, as only 40 µL is injected into the HPLC, or by<br />
drying more than 1 mL of the eluent. Similarly, lower sample<br />
volumes could be used in environments where vitamin levels<br />
are expected to be higher. For example, we measured 0.31 nM of<br />
B 1 in a 1-L sample collected from the Peconic River <strong>and</strong> 0.75 nM<br />
in 100 mL porewater extracted from Flax Pond, New York.<br />
Application of the method to natural waters—Concentrations<br />
of vitamin B 1 in coastal <strong>and</strong> river water samples ranged from<br />
0.23 to 0.31 nM (Table 1). The higher concentrations of B 1 were<br />
measured in samples from the Peconic River (0.31 ± 0.01 nM;<br />
mean ± 1 st<strong>and</strong>ard deviation) <strong>and</strong> seawater from Stony Brook<br />
244<br />
Table 1. Concentrations of vitamins B 1 <strong>and</strong> B 12 in surface waters<br />
collected in Stony Brook Harbor channel in January (SBHC-Jan)<br />
<strong>and</strong> April 2004 (SBHC-Apr), <strong>and</strong> in the Peconic River (PeconicR-Apr)<br />
in April 2004<br />
Sample B (nM) 1 B (nM) 12<br />
Recovery<br />
(%)<br />
SBHC-Jan 0.294 ± 0.009 0.048 ± 0.001 95-98<br />
SBHC-Jan + 100 0.579 ± 0.010 0.119 ± 0.003<br />
SBHC-Apr 0.233 ± 0.005 0.050 ± 0.002 93-98<br />
SBHC-Apr + 50 0.382 ± 0.010 0.084 ± 0.002<br />
PeconicR-Apr 0.308 ± 0.009 0.053 ± 0.001 93-97<br />
PeconicR-Apr + 25 0.367 ± 0.004 0.071 ± 0.002<br />
Frozen 0.285 ± 0.004 0.073 ± 0.001 93-97<br />
Refrigerated 0.227 ± 0.008 0.056 ± 0.002 74-78<br />
They were spiked with 0.074 (PeconicR-Apr + 25), 0.15 (SBHC-Apr + 50),<br />
<strong>and</strong> 0.30 nM (SBHC-Jan + 100). The recovery of the simultaneous analysis<br />
of vitamins B <strong>and</strong> B in the spiked samples ranged from 93% to 98%.<br />
1 12<br />
Included are concentration of vitamin B <strong>and</strong> B in seawater from Stony<br />
1 12<br />
Brook Harbor channel analyzed after being dried <strong>and</strong> stored for 60 d refrigerated<br />
<strong>and</strong> frozen. The similar levels of B <strong>and</strong> B measured before <strong>and</strong><br />
1 12<br />
after freezing (93%-97%) indicated that water samples can be preserved<br />
by drying <strong>and</strong> freezing for 2 mo without significant losses of B <strong>and</strong> B ,<br />
1 12<br />
whereas refrigeration yields lower recoveries (74%-78%).<br />
Harbor channel collected in January 2004 (0.29 ± 0.01 nM).<br />
Lower levels were detected at the tidal channel of Stony Brook<br />
Harbor during April 2004 (0.23 ± 0.01 nM). These results were<br />
consistent with the characteristics of the sampling sites <strong>and</strong> the<br />
sampling time. For example, the high concentration of B 1 in<br />
the shallow (0.5 m), stagnant Peconic River can likely be attributed<br />
to the high bacterial activity observed in that environment<br />
(Breuer et al. 1999). This is consistent with the bacterial<br />
production of vitamin B 1 (Burkholder <strong>and</strong> Burkholder 1956;<br />
Provasoli 1963). Furthermore, our sediment resuspension<br />
experiments indicated that sediments are an important source<br />
of B 1 in shallow environments (see following section).<br />
The concentration of vitamin B 1 measured at the channel<br />
of Stony Brook Harbor in January was higher than that measured<br />
in April (Table 1). This could be the result of the higher<br />
biological uptake of this vitamin by phytoplankton during the<br />
spring bloom. This temporal trend is consistent with decreasing<br />
vitamin B 1 concentrations from winter to spring reported<br />
for the Gulf of Maine (Swift 1981).<br />
Stability of vitamin B 1 in seawater—We carried out a series of<br />
laboratory incubation experiments to establish the stability of<br />
B 1 in seawater, as this vitamin is unstable at alkaline pH<br />
(Jansen 1972). In these laboratory experiments, levels of B 1<br />
were measured at the beginning of the experiment <strong>and</strong> at 6,<br />
12, 24, <strong>and</strong> 48 h in seawater of slightly alkaline pH (7.5) collected<br />
at Stony Brook Channel <strong>and</strong> incubated at room temperature<br />
(Fig. 3). Those results showed that about 70% of the<br />
initial B 1 concentration was hydrolyzed within 6 h. By 12 h,<br />
most of the vitamin (90%) was decomposed. As the incubated<br />
seawater was not filtered, biological uptake of B 1 could not be