Download Full-text PDF - ASLO
Download Full-text PDF - ASLO
Download Full-text PDF - ASLO

You also want an ePaper? Increase the reach of your titles
YUMPU automatically turns print PDFs into web optimized ePapers that Google loves.
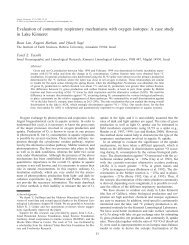
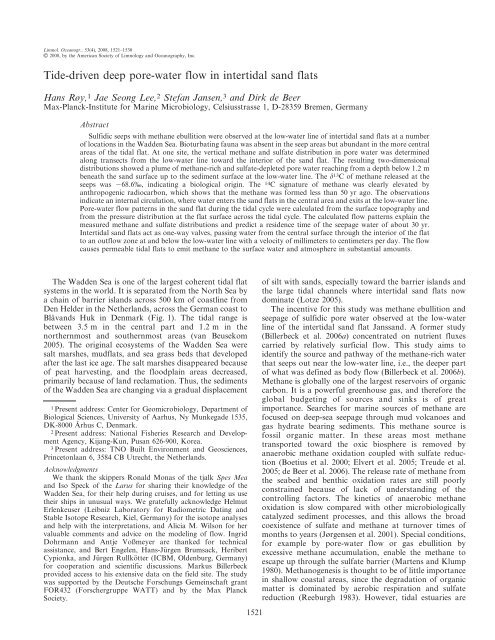
Limnol. Oceanogr., 53(4), 2008, 1521–1530<br />
Tide-driven deep pore-water flow in intertidal sand flats<br />
Hans Røy, 1 Jae Seong Lee, 2 Stefan Jansen, 3 and Dirk de Beer<br />
Max-Planck-Institute for Marine Microbiology, Celsiusstrasse 1, D-28359 Bremen, Germany<br />
Abstract<br />
Sulfidic seeps with methane ebullition were observed at the low-water line of intertidal sand flats at a number<br />
of locations in the Wadden Sea. Bioturbating fauna was absent in the seep areas but abundant in the more central<br />
areas of the tidal flat. At one site, the vertical methane and sulfate distribution in pore water was determined<br />
along transects from the low-water line toward the interior of the sand flat. The resulting two-dimensional<br />
distributions showed a plume of methane-rich and sulfate-depleted pore water reaching from a depth below 1.2 m<br />
beneath the sand surface up to the sediment surface at the low-water line. The d 13 C of methane released at the<br />
seeps was 268.6%, indicating a biological origin. The 14 C signature of methane was clearly elevated by<br />
anthropogenic radiocarbon, which shows that the methane was formed less than 50 yr ago. The observations<br />
indicate an internal circulation, where water enters the sand flats in the central area and exits at the low-water line.<br />
Pore-water flow patterns in the sand flat during the tidal cycle were calculated from the surface topography and<br />
from the pressure distribution at the flat surface across the tidal cycle. The calculated flow patterns explain the<br />
measured methane and sulfate distributions and predict a residence time of the seepage water of about 30 yr.<br />
Intertidal sand flats act as one-way valves, passing water from the central surface through the interior of the flat<br />
to an outflow zone at and below the low-water line with a velocity of millimeters to centimeters per day. The flow<br />
causes permeable tidal flats to emit methane to the surface water and atmosphere in substantial amounts.<br />
E 2008, by the American Society of Limnology and Oceanography, Inc. The Wadden Sea is one of the largest coherent tidal flat<br />
systems in the world. It is separated from the North Sea by<br />
a chain of barrier islands across 500 km of coastline from<br />
Den Helder in the Netherlands, across the German coast to<br />
Blåvands Huk in Denmark (Fig. 1). The tidal range is<br />
between 3.5 m in the central part and 1.2 m in the<br />
northernmost and southernmost areas (van Beusekom<br />
2005). The original ecosystems of the Wadden Sea were<br />
salt marshes, mudflats, and sea grass beds that developed<br />
after the last ice age. The salt marshes disappeared because<br />
of peat harvesting, and the floodplain areas decreased,<br />
primarily because of land reclamation. Thus, the sediments<br />
of the Wadden Sea are changing via a gradual displacement<br />
1 Present address: Center for Geomicrobiology, Department of<br />
Biological Sciences, University of Aarhus, Ny Munkegade 1535,<br />
DK-8000 Århus C, Denmark.<br />
2 Present address: National Fisheries Research and Development<br />
Agency, Kijang-Kun, Pusan 626-900, Korea.<br />
3 Present address: TNO Built Environment and Geosciences,<br />
Princetonlaan 6, 3584 CB Utrecht, the Netherlands.<br />
Acknowledgments<br />
We thank the skippers Ronald Monas of the tjalk Spes Mea<br />
and Iso Speck of the Larus for sharing their knowledge of the<br />
Wadden Sea, for their help during cruises, and for letting us use<br />
their ships in unusual ways. We gratefully acknowledge Helmut<br />
Erlenkeuser (Leibniz Laboratory for Radiometric Dating and<br />
Stable Isotope Research, Kiel, Germany) for the isotope analyses<br />
and help with the interpretations, and Alicia M. Wilson for her<br />
valuable comments and advice on the modeling of flow. Ingrid<br />
Dohrmann and Antje Voßmeyer are thanked for technical<br />
assistance, and Bert Engelen, Hans-Jürgen Brumsack, Heribert<br />
Cypionka, and Jürgen Rullkötter (ICBM, Oldenburg, Germany)<br />
for cooperation and scientific discussions. Markus Billerbeck<br />
provided access to his extensive data on the field site. The study<br />
was supported by the Deutsche Forschungs Gemeinschaft grant<br />
FOR432 (Forschergruppe WATT) and by the Max Planck<br />
Society.<br />
1521<br />
of silt with sands, especially toward the barrier islands and<br />
the large tidal channels where intertidal sand flats now<br />
dominate (Lotze 2005).<br />
The incentive for this study was methane ebullition and<br />
seepage of sulfidic pore water observed at the low-water<br />
line of the intertidal sand flat Janssand. A former study<br />
(Billerbeck et al. 2006a) concentrated on nutrient fluxes<br />
carried by relatively surficial flow. This study aims to<br />
identify the source and pathway of the methane-rich water<br />
that seeps out near the low-water line, i.e., the deeper part<br />
of what was defined as body flow (Billerbeck et al. 2006b).<br />
Methane is globally one of the largest reservoirs of organic<br />
carbon. It is a powerful greenhouse gas, and therefore the<br />
global budgeting of sources and sinks is of great<br />
importance. Searches for marine sources of methane are<br />
focused on deep-sea seepage through mud volcanoes and<br />
gas hydrate bearing sediments. This methane source is<br />
fossil organic matter. In these areas most methane<br />
transported toward the oxic biosphere is removed by<br />
anaerobic methane oxidation coupled with sulfate reduction<br />
(Boetius et al. 2000; Elvert et al. 2005; Treude et al.<br />
2005; de Beer et al. 2006). The release rate of methane from<br />
the seabed and benthic oxidation rates are still poorly<br />
constrained because of lack of understanding of the<br />
controlling factors. The kinetics of anaerobic methane<br />
oxidation is slow compared with other microbiologically<br />
catalyzed sediment processes, and this allows the broad<br />
coexistence of sulfate and methane at turnover times of<br />
months to years (Jørgensen et al. 2001). Special conditions,<br />
for example by pore-water flow or gas ebullition by<br />
excessive methane accumulation, enable the methane to<br />
escape up through the sulfate barrier (Martens and Klump<br />
1980). Methanogenesis is thought to be of little importance<br />
in shallow coastal areas, since the degradation of organic<br />
matter is dominated by aerobic respiration and sulfate<br />
reduction (Reeburgh 1983). However, tidal estuaries are
1522 Røy et al.<br />
exposed during low tide. The entire flat is inundated for 6–<br />
7 h during each semidiurnal tidal cycle. The permeability<br />
ranges between 7.2 3 10 212 m 2 at the upper flat and 5.2 3<br />
10 213 m 2 at the low-water line (Billerbeck et al. 2006a).<br />
Seeps can be observed along the entire exposed eastern edge<br />
of the flat.<br />
Fig. 1. Map of sampling locations. Sites with methane<br />
ebullition are marked with stars. From west to east the sites are<br />
Engelsmanplaat, Simonszand, Zuid-Oost Lauwers, Horsbornzand,<br />
Kopersand, Hohes Riff, and Janssand. Ruteplate, where<br />
no methane ebullition was observed, is marked with a circle. The<br />
insert shows the entire Wadden Sea from Den Helder in the<br />
Netherlands, across the German coast to Blåvands Huk<br />
in Denmark.<br />
known to liberate methane (Middelburg et al. 2002). The<br />
observed methane ebullition at Janssand indicates the<br />
presence of special factors in intertidal sand flats that lead<br />
to methane formation and to its escape from the seafloor.<br />
Our main questions were: What is the mechanism behind<br />
methane release from intertidal sand flats? and Is it a<br />
common phenomenon? We therefore investigated the<br />
pathway that carries the methane-rich water to the edge<br />
of the tidal flat. Also we determined the origin and the age<br />
of the escaping methane. We investigated one main study<br />
site in detail, where the two-dimensional structure of the<br />
seep was determined, and the pore-water flow distribution<br />
was modeled. A less detailed survey was performed during<br />
a 2-week cruise across the western Wadden Sea from<br />
Ameland in the Netherlands to Spiekeroog in Germany<br />
(Fig. 1) to assess whether methane- and sulfide-rich seeps<br />
are common.<br />
Methods and study sites<br />
Primary field site—The main study site on Janssand near<br />
Neuharlingersiel in the German Wadden Sea was visited<br />
repeatedly from 2004 to 2006. The study site (53u44.119N,<br />
7u41.959E) is situated on the western edge of the flat facing<br />
the 17-m deep tidal channel that separates the barrier<br />
islands Spiekeroog and Langeroog. The flat consists of<br />
well-sorted silica sand with discontinuous mud lenses below<br />
the surface. The tidal range is about 2.7 m (measured at a<br />
tidal gauge 2 km away), and 1.9 m of sediment column is<br />
Secondary field sites—Seven additional intertidal flats<br />
between Janssand and the island Ameland in the Netherlands<br />
were visited in October 2006 with the tjalk Spes Mea,<br />
a flat-bottom ship that can fall dry during low tide. The<br />
ship was grounded at the edges of the flats during falling<br />
tide, and areas of ca. 2-km distance from the ship could be<br />
safely explored during low tide. Seeps were identified by<br />
strong sulfide smell, blackened sediment, milky suspensions<br />
of elemental sulfur, and bubbles released from the<br />
sediment. The topographies of the visited sites were<br />
measured and pore water was analyzed for methane,<br />
chloride, and sulfate (see below).<br />
The locations visited are marked on Fig. 1 and were the<br />
Engelsmanplaat (53u26.29N, 06u04.49E), the Simonszand<br />
(53u30.39N, 06u25.39E), the Zuid-Oost Lauwers (53u27.59N,<br />
06u32.89E), the Horsbornzand (53u29.179N, 6u39.469E), the<br />
Kopersand (53u349N, 07u019E), the Hohes Riff (53u41.59N,<br />
07u12.79E), the Ruteplate (53u42.249N, 7u32.459E to<br />
53u42.269N, 7u33.109E), and Janssand (53u44.119N, 7u41.959E).<br />
Surface topography measurement—The surface topography<br />
was measured using a 50-m long transparent polyvinyl<br />
chloride (PVC) hose (5 mm inner diameter) filled with<br />
water. One end of the PVC tube was aligned with a 2-m<br />
long pole marked with ruler tape and placed at a fixed<br />
point of reference. One person then moved in steps of 2–<br />
10 m along transects of interest and carefully aligned the<br />
meniscus at a fixed height above the sediment at each point.<br />
A second person measured the height of the meniscus at the<br />
reference pole. Finally, all values were referenced to the<br />
low-water line. This method has an accuracy of ca. 0.5 cm.<br />
Pore-water analysis—Oxygen and H 2 S microprofiles<br />
were measured during full tidal cycles to maximally 10-<br />
cm depth with Clark-type microsensors using an autonomous<br />
profiling unit as described previously (de Beer et al.<br />
2004).<br />
Subsurface samples for methane and sulfate were<br />
acquired by driving a stainless steel pipe (inner diameter<br />
35 mm) to defined depths in the sediment with a hammer.<br />
The upper end of the pipe was corked and the pipe partly<br />
dug free to avoid losing sediment core or pore water during<br />
retrieval. Duplicate 2-mL samples were then taken with cut<br />
syringes from the lower opening of the pipe and transferred<br />
to 12-mL Exetainers preloaded with 1 mL 2.5% NaOH or<br />
1mL20% Zn acetate. Samples preserved with Zn acetate<br />
were later analyzed for Cl 2 and SO 2{<br />
4<br />
in the supernatant<br />
by ion chromatography. Samples preserved with NaOH<br />
were analyzed for methane in the headspace by gas<br />
chromatography on a 1.83 m Poropack Q column with a<br />
flame-ionization detector.<br />
Methane and sulfate distributions in the pore water were<br />
measured along transects from the low-water line up to
Deep circulation in intertidal sands 1523<br />
120 m from the low-water line toward the central flat.<br />
Typical vertical and horizontal resolutions were 0.4 and<br />
6 m, respectively. The data were interpolated on a 1- by 5-<br />
cm grid by triangulation with linear interpolation. Finally<br />
the gridded data were smoothed with a 10-cm matrix (11 3<br />
3 grid points) and areas outside the boundary of the<br />
measurements blanked. The use of a smoothing matrix<br />
much smaller than the resolution of the raw data ensures<br />
minimal manipulation of the measured points, but produces<br />
continuous isolines.<br />
Analysis of escaping gas—To avoid contamination with<br />
14C, all sample materials were new and carefully rinsed with<br />
ambient seawater. Methane for isotope analysis was<br />
collected in 1.5-liter polypropylene bottles from ebullition<br />
below the low-water line. The bottles were prefilled with<br />
ambient seawater and inverted under water, and a funnel<br />
was inserted in the opening by which emerging bubbles<br />
were caught. The gas was transferred to new crimp-sealed<br />
glass bottles supplied by the Leibniz Laboratory for<br />
Radiometric Dating and Stable Isotope Research, and<br />
mailed from the field site directly to the same laboratory for<br />
analysis. Here the composition of the raw samples was<br />
measured by accelerator mass spectroscopy (AMS). CO 2<br />
and CH 4 were separated by sweeping through a cold trap at<br />
2196uC with the escaping CH 4 fed into a combustion line<br />
at 870uC together with excess O 2 , and the resulting CO 2<br />
was trapped cryogenically. In a second step the original<br />
CO 2 fraction left in the first cold trap was swept through<br />
the oven and collected. Aliquots of both CO 2 fractions were<br />
reduced with H 2 over Fe powder. The resulting carbon<br />
: iron mixtures were pressed into pellets and measured on<br />
a Tandetron 4130 AMS. The 14 C concentration was<br />
measured by comparing the simultaneously collected 14 C,<br />
13C, and 12 C beams of the sample together with oxalic acid<br />
standard CO 2 and coal background material. The 14 C<br />
concentration was corrected according to Stuiver and<br />
Polach (1977) based on the 13 C: 12 C ratio from the same<br />
AMS run.<br />
Calculations of pore-water flow—The pore-water flow in<br />
Janssand was calculated in the Earth-Science module of<br />
Comsol Multiphysics (www.comsol.com). The software can<br />
calculate, for example, pore-water flow in an arbitrary<br />
geometry by dividing into finite elements. The software is<br />
often used for geophysical or hydrological modeling (e.g.,<br />
Cardenas and Wilson 2006). The body flow was simulated<br />
according to Darcy’s law:<br />
water flux~{k=m|+P<br />
ð1Þ<br />
where k is the permeability, m is the dynamic viscosity, and<br />
=P is the pressure gradient vector. To achieve the velocity<br />
in the pore space, the flux must be divided by porosity to<br />
account for the fact that the flow is constrained to this<br />
fraction of the bed volume.<br />
The geometry of the model was based directly on a<br />
measured surface profile from 20 m seaward from the lowwater<br />
line and 120 m onto the exposed sand flat. The<br />
measured geometry was extrapolated another 80 m seaward<br />
based on sea charts, and 480 m to the center of the<br />
sand flat assuming no further change in topography. The<br />
shape of the sand flat is well approximated by a circular<br />
disc and therefore modeled as radial symmetric. The<br />
calculation grid consisted of 50,771 triangular elements<br />
with a 20 3 10 cm (horizontal 3 vertical) resolution at the<br />
sediment–water interface.<br />
Permeability and porosity was available for the surface<br />
layers of the 6-m thick sandy deposit that forms Janssand<br />
and from the muddy inclusions found at the low-water<br />
line (Billerbeck et al. 2006b). To constrain the influence of<br />
unknown permeability inside the bed three calculations<br />
were performed under different assumed permeability<br />
regimes: (1) Isotropic permeability of 7.2 3 10 212 m 2 .(2)<br />
Isotropic permeability of 5.2 3 10 213 m 2 . (3) Anisotropic<br />
permeability with 7.2 3 10 212 m 2 horizontal permeability<br />
and 5.2 3 10 213 m 2 vertically. The clay layer, found<br />
below 6-m depth (Bert Engelen pers. comm.), was<br />
assigned a permeability of 10 215 m 2 in all cases. The<br />
viscosity of the pore water was assumed to be constant<br />
(1.3 3 10 23 Pa s).<br />
As boundary conditions we imposed no flow across the<br />
bottom of the modeled domain, the vertical center<br />
boundary, and the vertical seaward boundary. Note that<br />
these boundaries are far remote from the seep sites. The<br />
pressure at the sediment surface, i.e., the upper boundary<br />
condition, is the driving force behind the pore-water flow.<br />
The exposed surface was assigned with atmospheric<br />
pressure, and inundated parts were assigned with atmospheric<br />
plus hydrostatic pressure. The dynamic tidal height<br />
was acquired from a gauge 2,000 m from the station.<br />
Near the edge we observed that the water table in<br />
shallow wells was up to 20 cm below the exposed surface,<br />
though the sediment remained water saturated. Thus, this<br />
area is covered by a zone with a pore-water pressure lower<br />
than air pressure, caused by capillary force. This volume,<br />
which was carefully mapped, is not modeled since it falls<br />
outside the defined boundary.<br />
A complete tidal cycle from one high water to the next<br />
was calculated with 2-min temporal resolution of the<br />
output. At the starting point the entire sand flat was<br />
inundated and the hydrostatic pressure therefore uniform.<br />
This was reflected by setting the initial condition to zero<br />
velocity. After the full cycle was calculated the flow was<br />
averaged across the tidal cycle to allow calculation of pore<br />
paths and water residence time.<br />
To verify the numerical method, selected scenarios were<br />
calculated with the calculation domain extended in depth<br />
and radius and with denser grid. The numerical solution<br />
was independent of boundaries and grid density. Internal<br />
temporal resolution was managed automatically by Comsol<br />
Multiphysics, and no numerical oscillations occurred.<br />
Results<br />
General description of Janssand seep areas—The Janssand<br />
has a surface area at low tide of ca. 3 km 2 . The central<br />
area is almost flat and is ca. 1.9 m elevated above the lowwater<br />
level. At its periphery the intertidal sand flat slopes<br />
down to the low-water line over a distance of ca. 50 m. The
1524 Røy et al.<br />
by a strong sulfidic smell. Bubbles are often visible and<br />
audible near the low-water line but more obvious on the<br />
subtidal sediments. Typical seeps cover 10 to 100 m along<br />
the low-water line.<br />
From June to October the seep areas are characterized<br />
by patches of bright green flagellates that migrate up to the<br />
surface ca. 1 h after regression of the tide. Diatoms are also<br />
abundant, but separate from the flagellates, forming a<br />
colorful mosaic that follow the microtopography of ripples<br />
and gullies.<br />
Fig. 2. (A–H) Topographic profiles of the tidal flats measured<br />
perpendicular to the waterline.<br />
transition from the sand flat is rather sharp, and the slope is<br />
distinct (Fig. 2).<br />
Seeps are found both on the eastern edge of Janssand<br />
and along tidal channels that cut into the sand flat. The<br />
seep areas are, on superficial inspection, not different from<br />
inactive sites. They consist of sandy sediment with the same<br />
grain size as that of surrounding nonseeping sediments<br />
(,176 mm mean). However, the sediment is often unconsolidated<br />
at the seep area, and the observer can sink in<br />
unexpectedly. The seep areas are remarkably devoid of<br />
benthic macrofauna. The lower half of the slope has a wet<br />
seepage face during low tide. Correspondingly, the area<br />
near transition from the flat interior to the slope is devoid<br />
of surface water and appears dry relative to the interior of<br />
the flat and to the seepage face (Fig. 2). However, air does<br />
not enter the pore space. Black spots appear within ca.<br />
30 min after exposure where sulfidic pore water seeps out.<br />
In stagnant pools the seawater turns milky by precipitation<br />
of elemental sulfur, probably because of iron-catalyzed<br />
sulfide oxidation. The area can be recognized from distance<br />
Pore-water chemistry—Close to the low-water line<br />
sulfide reaches the surface during low tide (Fig. 3A).<br />
Shortly after inundation the sulfide is depleted in the upper<br />
5 mm and the profile remains stable for the rest of the<br />
inundation period. Oxygen did not penetrate the sediments<br />
during low tide, but it penetrated 5-mm deep during high<br />
tide (Fig. 3B). In the central area, no sulfide could be<br />
detected in the upper 10 cm. Oxygen penetration was 2–<br />
5 mm during low tide and 10–15 mm during high tide (data<br />
not shown).<br />
Methane and sulfate distributions in the pore water were<br />
measured along transects from the low-water line up to<br />
120 m from the low-water line toward the central area in<br />
March, June, and October 2005 and April 2006. The<br />
concentration measurements were complicated by an<br />
uncertain porosity of the retrieved sample and by<br />
compaction during the coring. Coring each depth separately<br />
assured that the sediment sampled in the end of the<br />
core could be ascribed to the correct depth regardless of<br />
compaction of the core during penetration. Although the<br />
individual concentration measurements were not very<br />
accurate, in combination they yielded consistent spatial<br />
patterns. Two-dimensional reconstruction showed a plume<br />
of methane-saturated pore water with less than 1 mmol<br />
L 21 sulfate, reaching upward from below 120 cm near the<br />
low-water line (Figs. 4, 5). One transect was made parallel<br />
to the waterline, 42 m from the low-water line, crossing a<br />
temporary tidal channel. Clearly, a plume of sulfatedepleted<br />
and methane-rich pore water was reaching upward<br />
to the bed of the small channel (Fig. 6). This indicates<br />
pressure driven flow, following the path of lowest<br />
resistance. The depression eroded by the tidal channel<br />
forms a path with less resistance, which becomes a<br />
preferred flow path upward. The main seep area was<br />
observed at 53u44.119N, 7u41.959E. In 2004 a large seep<br />
developed ca. 500 m farther north in a newly developed<br />
tidal channel. The seeps generally have slow dynamics<br />
independent from season and focus in lower points of the<br />
topography. The Cl 2 concentrations could not be distinguished<br />
from seawater anywhere in the sediment.<br />
Isotopic composition of the escaping gas—The gas<br />
collected at the subtidal zone consisted of CH 4 and CO 2<br />
in a roughly 5 : 1 ratio, a minor fraction of O 2 and N 2 in<br />
atmospheric ratio, and traces of H 2 S. The d 13 C value of the<br />
methane was 269 6 0.14%, typical for methane of<br />
biological origin. The value for the CO 2 was 216 6<br />
0.86%, similar to CO 2 from biomass oxidation and clearly<br />
below dissolved organic carbon of seawater (around 0)
Deep circulation in intertidal sands 1525<br />
Fig. 3. (A) H 2 S distribution in seeping sediment measured repeatedly across the transition<br />
from ebb to flood. Zero depth represents the sediment–water interface. Numbers at individual<br />
profiles indicate the time that the sediment had been inundated when the profile was started. (B)<br />
O 2 distribution in seeping sediment measured every repeatedly across the transition from ebb to<br />
flood. During low tide the O 2 penetrated less than the 1-mm step size used and the line<br />
representing this is therefore conceptual. The profile with the deepest penetration represents the<br />
average of five consecutive profiles (6SD) with no trend in time.<br />
(Peterson and Fry 1987). The 14 C content of the CH 4 was<br />
125.97 6 0.35 percent modern (1950) carbon (pMC), and<br />
the CO 2 was 123.16 6 0.43 pMC, both corresponding to<br />
the atmospheric level of around 1984. Classic radiocarbon<br />
age determination is not possible from material with 14 C<br />
content above 100 pMC, but the age can still be<br />
constrained in a narrow window. The source of the excess<br />
14C is the hydrogen bomb tests in the early 1960s, which<br />
Fig. 4. Distribution of (A) methane and (B) sulfate in a cross section of the edge of Janssand<br />
measured in July 2005. The circles indicate points sampled for methane and sulfate. The hatched<br />
area was outside the boundary of the measurements. The origin of the coordinate system is the<br />
waterline at low tide.
1526 Røy et al.<br />
Fig. 6. Distribution of (A) methane and (B) sulfate across a<br />
temporal tidal creek. The transect is perpendicular to the profile in<br />
Fig. 4, crossing this 42 m from the low-water line. The distance on<br />
the x axis is relative to the profile in Fig. 4. The hatched area was<br />
outside the boundary of the measurements. The origin of the<br />
coordinate system is the waterline at low tide<br />
Fig. 5. Distribution of (A) methane and (B) sulfate in a cross<br />
section of the edge of Janssand measured in March 2005. The<br />
hatched area was outside the boundary of the measurements. The<br />
origin of the coordinate system is the waterline at low tide.<br />
on the lowest assumed permeability (Fig. 7). The slowmoving<br />
deeper waterbodies coincide with the observed<br />
sulfate-depleted and methane-rich plume. Outflow of pore<br />
water continues below the low-water line, but the velocity<br />
contributed a strong pulse of 14 C to the atmosphere. The<br />
14C levels were clearly above those from before 1950; thus<br />
the methane and dissolved inorganic carbon (DIC)<br />
originates from degrading biomass, fixed by photosynthesis<br />
less than 50 yr ago.<br />
Finite element modeling—The finite element modeling<br />
predicts flow of water into the sand flat toward the central<br />
parts and flow out of the flat around the low-water line.<br />
The border between inflow and outflow is on the middle of<br />
the slope (Fig. 7). This corresponds with the observed<br />
border between the area devoid of surface water and the<br />
permanent wet part of the slope. The area near the inflow–<br />
outflow transition, between 20 and 30 m from the lowwater<br />
line, is characterized by a fast-moving shallow flow.<br />
The shallow flow paths in this area are highly influenced by<br />
ephemeral topography and thus will vary strongly in time.<br />
The most accurate statement is that the surface sediment in<br />
this area is intensively flushed and the calculated flow path<br />
is not shown in Fig. 7. These fast-moving waterbodies close<br />
to the edge are neither sulfate depleted nor enriched in<br />
methane (Figs. 4, 5). Water that seeps out of the lower<br />
,15 m of the slope followed a longer and deeper path that<br />
originates within 75 m from the low-water line. The<br />
predicted residence time was between 3 and 30 yr, based<br />
Fig. 7. Calculated pathway of the body flow. The numbers<br />
on the flow lines indicate the number of years it takes for a water<br />
parcel to travel along the line from the surface, through the<br />
sediment, to the seep. Note that the different scales on the x and y<br />
axis make the flow paths look much more curved than they are.<br />
The grayscale overlay is identical to the methane data presented in<br />
Fig. 4.
Deep circulation in intertidal sands 1527<br />
decays about 50% for every 2 m. Consequently, the pore<br />
water seeping out of the tidal flat in the subtidal zone had a<br />
very long residence time (see Web Appendix, www.aslo.org/<br />
lo/toc/vol_53/issue_4/1521al.mpg, for an animation of the<br />
flow through the tidal cycle).<br />
The calculated water flux and pore-water age of the<br />
methane-rich water depends linearly on the assumed<br />
permeability of the sand flat. Using the minimum<br />
permeability as above, the water flux out of the lower<br />
10 m of the slope is 0.5 L m 22 d 21 . This flux is integrated<br />
over the tidal cycle and includes the time of stagnation<br />
while the entire flat is submerged. The permeability of the<br />
central area of the Janssand is 14 times higher than near the<br />
low-water line (Billerbeck et al. 2006b). Consequently, the<br />
water flux could be up to 14 times higher, i.e., 7 L m 22 d 21 .<br />
The water fluxes correspond to a pore-water displacement<br />
in the order of 1 mm to 1 cm d 21 in the methane-saturated<br />
plume.<br />
Seepage at flats in other locations of the western<br />
Wadden Sea—To assess whether the observations made<br />
on Janssand are of a general nature we visited seven<br />
additional locations between Ameland (the Netherlands)<br />
and Spiekeroog (Germany) during October 2006. The<br />
assessment of seep activity was made by observing<br />
ebullition and black spots and sampling of sediments for<br />
sulfide, methane, sulfate, and grain size determination.<br />
Furthermore, topography measurements were made of the<br />
inspected sites.<br />
Seeping of methane-saturated pore water (,1.3 mmol<br />
L 21 ) was observed at all sand flats visited (Engelsmanplaat,<br />
Simonszand, Zuid-Oost Lauwers, Horsbornzand, and<br />
Hohes Riff). All seeping flats had similar topography as<br />
Janssand, and the same patterns of wet seepage zones on<br />
the slopes were apparent (see Fig. 2A–E for profiles of<br />
seeping flats). Hohes Riff, though, only had seepage<br />
below the low-water line. All surfaces of seeps were<br />
devoid of macrofauna, whereas nonseeping areas of the<br />
same flats were inhabited by polychaetes and bivalves.<br />
Euglenoid flagellates were often observed as green stains<br />
near, but not on, seepage areas. Sand flats had seepage<br />
along 10–50% of the low-water line, with each seepage<br />
site being 10 to several hundreds meters wide. The<br />
consistent features of seeping intertidal plates was a wellsorted<br />
sand body and a distinct profile with a large flat<br />
interior area and a distinct slope down to a tidal channel.<br />
Seeps can easily be found near the low-water line of<br />
permeable sand flats, smell sulfidic, show black spots in<br />
between the ripples, are devoid of macrofauna, and are<br />
often quicksand.<br />
The sites without seepage were always associated with<br />
fine-grained sediments. Simonzand, for example, did not<br />
have seepage along the western edge where an apparently<br />
continuous 10-cm thick clay layer was found ,50 cm below<br />
the surface of the sediment (Fig. 6F). The eastern edge of<br />
Simonzand was not capped by clay and had seepage.<br />
Kopersand and Ruteplate both consisted of mud-mixed<br />
sand and had no seepage (Fig 2G–H). Horsbornzand and<br />
Zuid-Oost Lauwers had both muddy and sandy areas, and<br />
seepage was confined to the sand.<br />
Discussion<br />
Advection has long been recognized as the main<br />
transport mechanism for solutes near the surface of<br />
permeable sands, as well as for exchange between sediment<br />
and water column (Riedl et al. 1972; Rutgers van der Loeff<br />
1980). Transport in the upper few centimeters of submerged<br />
sediments (skin flow) is controlled by the boundary-layer<br />
flow over surface topography (Thibodeaux and Boyle 1987;<br />
Precht and Huettel 2003) and drives concentration dynamics<br />
on the time scale of seconds to minutes (de Beer et al.<br />
2004; Werner 2005). Owing to skin flow, degradation<br />
products do not accumulate and electron acceptors do not<br />
deplete in the upper few centimeters of sandy beds (e.g.,<br />
Rutgers van der Loeff 1980), although aerobic and<br />
anaerobic mineralization processes occur with high areal<br />
rates. Skin flow is characteristic of all permeable sediments<br />
in shallow waters.<br />
It was recognized recently that the biogeochemistry of<br />
the Janssand is under control of a second transport<br />
phenomenon (Billerbeck et al. 2006a), referred to as body<br />
flow. The sand flats stay water saturated during low tide<br />
because the drainage through the sediment is slow and<br />
because the pore water is replenished by water caught in<br />
small depressions in the otherwise level surface. The body<br />
flow is driven by the pressure head caused by elevation of<br />
the pore water relative to the sea surface at low tide. On the<br />
Janssand, the low-water line is 1.9 m below the top of the<br />
sand flat; thus a pressure head of 1.9 m drives pore-water<br />
flow through the sediment from the center of the flat to the<br />
low-water line where it seeps out. Flooding eliminates the<br />
pressure head and stops the flow during high tide, but the<br />
pressure gradient is not reversed. Thus, the pore-water flow<br />
is one way from the top of the intertidal flat to the waterline<br />
with one displacement pulse each low tide (see also Jahnke<br />
et al. 2003; Billerbeck et al. 2006b; Gardner and Wilson<br />
2006). The process is similar to the percolation of beaches<br />
caused by wave swash (Riedl et al. 1972) and tidal pumping<br />
(Webster et al. 1994). But in the case of intertidal flats in<br />
the Wadden Sea the infiltration zone comprises the entire<br />
sand flat. As these flats are hydraulically separated from<br />
the islands and mainland by tidal channels, the lack of a<br />
freshwater aquifer makes the system fully marine (compare<br />
with Nielsen 1990).<br />
The pore water in seeps along the low-water line of<br />
Janssand contains high concentrations of nutrients, which<br />
vary in time independent of seasons (Billerbeck et al.<br />
2006a). High seepage activity was observed in December<br />
2001, December 2002, June 2003, and March 2004, while<br />
the seeping activity was low between March and September<br />
2002. Methane seeping activity can appear in one area,<br />
remain active over several months, and decrease and<br />
appear in other locations with no apparent seasonal<br />
pattern. This can be explained by the slow dynamics of<br />
the flow and by the influence of the sand flat topography,<br />
which is irregularly eroded and redeposited. Erosion will<br />
form an area with less resistance and thereby focus the<br />
seepage. This is illustrated by the observed upward plume<br />
of methane-rich and sulfate-depleted pore water under the<br />
shallow channel cut into the main flat of the Janssand
1528 Røy et al.<br />
(Fig. 6). If the flat is extended by 1 m due to redeposition<br />
of sand during a storm, it will take between 100 and 1,000 d<br />
before the methane-rich sulfidic pore-water flow will reach<br />
the surface again, since it flows 1–10 mm d 21 . Erosion and<br />
redeposition leading to horizontal changes in the waterline<br />
of several meters per year are observed at Janssand, and<br />
this must cause temporal variability with the time scales<br />
observed.<br />
Leakage of sulfidic pore water and ebullition of methane<br />
was found at all sand flats inspected during this study. The<br />
presence of methane in tidal estuaries of large rivers has<br />
been reported at various locations in Germany, the<br />
Netherlands, Belgium, England, France, Spain, and Portugal.<br />
A part of the methane was identified to originate with<br />
large likelihood from tidal flats and creeks; however, the<br />
nature of the source was not resolved (Middelburg et al.<br />
2002). Very likely the methane sources were permeable<br />
intertidal flats that delivered methane into the tidal creeks.<br />
The fluctuating nature of the flow explains why elevated<br />
methane concentrations were measured in tidal estuaries<br />
during low tide (Middelburg et al. 1996).<br />
The methane released from the Janssand could be from<br />
fossil sources, from remaining peat layers, or from recently<br />
fixed biomass. If it originates from fossil sources, the<br />
biomass would be formed millions of years ago and have<br />
lost its 14 C signal. If it originates from buried peat layers,<br />
the biomass would have formed before the peats were<br />
buried during the postglacial sea-level rise 5,000 to<br />
20,000 yr ago. If the methane is formed from recent<br />
biomass it could carry the so-called bomb signal. Indeed,<br />
the 14 C content of the CH 4 escaping at the low-water line<br />
was 25% above the natural level prior to the detonations of<br />
the hydrogen bombs in the atmosphere in the early 1960s.<br />
The time when the carbon was originally fixed can be<br />
constrained by the time window where the 14 C ratio in<br />
atmospheric CO 2 was at least as high as in the CH 4 flowing<br />
out of Janssand, namely, between 1955 and 1987 (Manning<br />
et al. 1990; Levin et al. 2003). Thus carbon in the methane<br />
that escapes from Janssand is fixed from DIC obtained<br />
from the atmosphere only 20 to 50 yr ago.<br />
The dissolved inorganic carbon in the seeping fluids is<br />
dominated by CO 2 from organic matter oxidized in the<br />
sand flat, since its DIC concentration of 20 mmol L 21 is<br />
about 10 times above that of seawater. The origin as<br />
degradation product from marine organic matter, and not<br />
from methane, is confirmed by the d 13 Cof216. Peat and<br />
other fossil organics can be excluded as the source for both<br />
the methane and the DIC based on their 14 C content. The<br />
14C signature of the CO 2 was identical to the methane; thus<br />
both carbon pools stem from the degradation of the same<br />
organic carbon. The time window where 14 C predicts the<br />
methane carbon to be fixed overlaps with the 3–40 yr<br />
residence time of pore water calculated from the hydrological<br />
model. The best agreement is achieved when the<br />
lowest measured permeability is assumed, probably because<br />
the high permeability is only associated with the very<br />
surface.<br />
The flow calculated from the lowest measured permeability<br />
can be considered the minimum estimate of flow in<br />
the flat. This calculated discharge rate near the low-water<br />
line (,0.5 L m 22 d 21 ) is at the lower range of the discharge<br />
rates of 1–25 L m 22 d 21 measured previously (Billerbeck et<br />
al. 2006a). The former study integrated flow over the entire<br />
slope including rapid shallow flow, whereas we only<br />
consider the methane-rich water that travels slower and<br />
deeper below the flat. Half a liter of methane-saturated<br />
water per square meter per day delivers 0.65 mmol methane<br />
to the estuary per square meter per day. On Janssand the<br />
seeps comprise on the order of 2% of the surface area, so<br />
the seeps only leek about 0.013 mmol C m 22 d 21 averaged<br />
over the entire sand flat. This is at least three orders of<br />
magnitude below the estimated rates of primary production<br />
and mineralization in the Wadden Sea (Asmus et al. 1998;<br />
van Beusekom et al. 1999; Philippart et al. 2007). This<br />
rough calculation suggests that methane seepage is of<br />
limited importance for the carbon cycle in intertidal flats.<br />
But it is probably very important for the coastal methane<br />
budget. The flux of methane from the estuary waters to the<br />
atmosphere of 0.13 mmol m 22 d 21 (Middelburg et al.<br />
2002) can be explained by seepage from flats in areas with<br />
1 m of seeping waterline per 50–500 m 2 of water surface.<br />
This is a plausible ratio; thus it is likely that seeping<br />
intertidal sands are the source driving the methane efflux<br />
from tidal European estuaries calculated by Middelburg et<br />
al. (2002). It was estimated that estuaries contribute 9% of<br />
the total marine methane flux to the atmosphere (Middelburg<br />
et al. 2000). This estimate did not include the export of<br />
methane from estuaries to the open sea and transport to the<br />
atmosphere by ebullition; thus methane efflux from tidal<br />
estuaries with permeable sands might be higher than<br />
previously thought.<br />
The source of organic material that fuels methanogenesis<br />
in the sand flats of the Wadden Sea is not obvious. In<br />
muddy coastal sediments methane is formed by slow<br />
degradation of a large pool of refractory organic matter<br />
that is continuously being buried by sedimentation. The<br />
methane is formed over often hundreds of meters of<br />
sediment column and diffuses toward the surface. A similar<br />
deep source cannot explain the methane in the seeps<br />
because of the low accumulation rate of sediment in the<br />
Wadden Sea, the low content of organic carbon, and the<br />
presence of bomb-derived 14 C in the methane. Thus<br />
relatively young material must undergo methanogenesis<br />
somewhere along the pore-water flow paths shown in<br />
Fig. 7. Seawater contains stoichiometrically less electron<br />
donor (C organic) than oxygen. The source therefore<br />
cannot be the water column directly without a preconcentration<br />
of organic matter in the top sediment, for example,<br />
by filtration due to the skin flow (Huettel and Rusch 2000;<br />
Rusch and Huettel 2000). However, benthic photosynthesis<br />
is increasingly recognized as an important source of organic<br />
carbon for intertidal and subtidal sand flats (MacIntyre et<br />
al. 1996; Middelburg et al. 2000; Cook and Røy 2006), and<br />
the 14 C content of the DIC and the methane from the seeps<br />
points to benthic photosynthesis as the carbon source. The<br />
14C content of DIC and methane in the seeps is higher than<br />
the North Sea concentration ever was (Erlenkeuser 1976;<br />
Nydal et al. 1980, 1984). This suggests that the atmosphere<br />
must have been an important source of carbon for the<br />
primary production eventually filling the methane pool.
Deep circulation in intertidal sands 1529<br />
Thus, most photosynthesis must have occurred during low<br />
tide by benthic algae, probably cyanobacteria and diatoms.<br />
Whatever the source of the 14 C in the methane was, the<br />
organic material for its production was certainly fixed at<br />
the surface after 1955.<br />
The upper 120 cm of the central sand flat is methane free<br />
and contains seawater concentrations of sulfate; thus<br />
methane formation occurs deeper in the flats. The<br />
stoichiometry of organic carbon oxidation by sulfate<br />
reduction is 2 C : 1 SO 2{<br />
4<br />
(2CH 2 O + SO 2{<br />
4<br />
R 2CO 2 +<br />
S 22 + 2H 2 O). Since seawater contains ca. 28 mmol L 21<br />
sulfate, at least 56 mmol L 21 of organic carbon is needed to<br />
deplete sulfate. The dissolved organic carbon in the pore<br />
water is less than 0.06 mmol C L 21 ; thus the organic<br />
carbon for sulfate depletion in the anoxic sediments must<br />
be supplied from hydrolysis of organic particulates. The<br />
organic carbon content of the intertidal sands in the<br />
Wadden Sea is on the order of 1 g C organic per kilogram<br />
of dry sediment, or ca. 500 mmol C organic per liter pore<br />
water. Burial of this amount of electron donor is more than<br />
sufficient for sulfate depletion and considerable methanogenesis<br />
if it is biodegradable within a few decennia. The<br />
question is how the organic material is transported from<br />
the sediment surface deep into the seabed in less than 40 yr.<br />
One possibility is continuous transport with the deep porewater<br />
flow, in the form of colloids, viruses, or small<br />
bacteria. An alternative explanation is batch-wise burial of<br />
organic rich surface sediment. A batch of surface sediment<br />
could be deposited in a meter-thick layer during a strong<br />
storm and form a reservoir of methane for a seep. Also,<br />
other mechanisms could be plausible, and the topic should<br />
be studied further, for example, by determining the 14 C<br />
distribution of methane and DIC in the sand flat.<br />
The seeps on the slopes of Janssand are sulfidic, depleted<br />
in sulfate, and saturated with methane. The emerging<br />
concept for biogeochemistry of intertidal flats is that<br />
organics are entrained deep in the sand flats. A deep<br />
unidirectional pore-water flow follows a curved path toward<br />
the low-water line. As a result the biogeochemical conditions<br />
become highly structured in two dimensions, forming a<br />
habitat for a much wider diversity of microbial processes<br />
than previously thought. Organic matter that enters the flat<br />
is subjected along this trajectory to degradation, first<br />
aerobically, then by sulfate reduction, and finally by<br />
methanogenesis. At the end, when all microbial degradation<br />
processes have run their course, microbial activity is reduced<br />
to low levels, possibly resembling the deep biosphere (Wilms<br />
et al. 2006). Owing to the warped geometry, the oldest parts<br />
is at the surface near the low-water line.<br />
Whereas it was recently reported that permeable sands are<br />
efficient bioreactors for aerobic degradation of organic<br />
matter (D’Andrea et al. 2002; de Beer et al. 2004), the deep<br />
body circulation can locally lead to intense anaerobic<br />
microbial processes in tidal flats and an outflow of reduced<br />
substances. Normally in sediments, products of anaerobic<br />
degradation, such as sulfide or methane, are reoxidized in the<br />
sediments with eventually oxygen as electron acceptor. At the<br />
seepage site, the outflow of pore water prevents diffusive<br />
penetration of electron acceptors such as oxygen and sulfate<br />
that can oxidize the reduced products of anaerobic degradation<br />
(de Beer et al. 2006). The tidal flats therefore emit<br />
methane to the surface water and atmosphere in substantial<br />
amounts. The stability and structured transport phenomena,<br />
as well as their contribution to the methane budget, make<br />
permeable intertidal sand flats highly interesting for biogeochemical<br />
and for microbial diversity studies.<br />
References<br />
ASMUS, R., M. H. JENSEN, D.MURPHY, AND R. DOERFFER. 1998.<br />
Primary production of micro- phytobenthos, phytoplankton,<br />
and annual biomass yield of macro-phytobenthos in the<br />
Sylt-Rømø Wadden Sea, p. 367–392. In C. Gätje and K. Reise<br />
[eds.], Ecosystem Wadden Sea: Exchange, transport, and<br />
turnover. Springer Verlag. [In German.]<br />
BILLERBECK, M., U. WERNER, K.BOSSELMAN, E.WALPERSDORF,<br />
AND M. HUETTEL. 2006a. Nutrient release from an exposed<br />
intertidal sand flat. Mar. Ecol. Prog. Ser. 316: 35–51.<br />
———, ———, L. POLERECKY, E.WALPERSDORF, D.DE BEER, AND<br />
M. HUETTEL. 2006b. Surficial and deep porewater circulation<br />
governs spatial and temporal scales of nutrient recycling in<br />
intertidal sand flat sediments. Mar. Ecol. Prog. Ser. 326:<br />
61–76.<br />
BOETIUS, A., AND oTHERS. 2000. A marine microbial consortium<br />
apparently mediating anaerobic oxidation of methane. Nature<br />
407: 623–626.<br />
CARDENAS, M. B., AND J. L. WILSON. 2006. The influence of<br />
ambient groundwater discharge on exchange zones induced<br />
by current-bedform interactions. J. Hydrol. (1–2): 103–109.<br />
COOK, P. L. M., AND H. RØY. 2006. Advective relief of CO 2<br />
limitation in microphytobenthos in highly productive sandy<br />
sediments. Limnol. Oceanogr. 51: 1594–1601.<br />
D’ANDREA, A. F., R. C. ALLER, AND G. R. LOPEZ. 2002. Organic<br />
matter flux and reactivity on a South Carolina sandflat: The<br />
impacts of porewater advection and macrobiological structures.<br />
Limnol. Oceanogr. 47: 1056–1070.<br />
DE BEER, D., AND oTHERS. 2004. Transport and mineralization<br />
rates in North Sea sandy intertidal sediments (Sylt-Rømø<br />
Basin, Waddensea). Limnol. Oceanogr. 50: 113–127.<br />
———, AND oTHERS. 2006. In situ fluxes and zonation of microbial<br />
activity in surface sediments of the Håkon Mosby Mud<br />
Volcano. Limnol. Oceanogr. 51: 1315–1331.<br />
ELVERT, M., E. C. HOPMANS, T. TREUDE, A. BOETIUS, AND E.<br />
SUESS. 2005. Spatial variations of methanotrophic consortia at<br />
cold methane seeps: Implications from a high-resolution<br />
molecular and isotopic approach. Geobiology 3: 195–209.<br />
ERLENKEUSER, H. 1976. 14C and 13 C isotope concentration in<br />
modern marine mussels from sedimentary habitats. Naturwissenschaften<br />
63: 338.<br />
GARDNER, L. R., AND A. M. WILSON. 2006. Comparison of four<br />
numerical models for simulating seepage from salt marsh<br />
sediments. Estuar. Coast. Shelf. Sci. 69: 427–437.<br />
HUETTEL, M., AND A. RUSCH. 2000. Transport and degradation of<br />
phytoplankton in permeable sediments. Limnol. Oceanogr.<br />
45: 534–549.<br />
JAHNKE, R. A., C. R. ALEXANDER, AND J. E. KOSTKA. 2003.<br />
Advective pore water input of nutrients to the Satilla River<br />
Estuary, Georgia, USA. Estuar. Coast. Shelf Sci. 56: 641–653.<br />
JØRGENSEN, B. B., A. WEBER, AND J. ZOPFI. 2001. Sulfate reduction<br />
and anaerobic methane oxidation in Black Sea sediments.<br />
Deep-Sea Res. I 48: 2097–2120.<br />
LEVIN, I., B. KROMER, M.SCHMIDT, AND H. SARTORIUS. 2003. A<br />
novel approach for independent budgeting of fossil fuel CO 2<br />
over Europe by 14 CO 2 observations. Geophys. Res. Lett. 30:<br />
2194.
1530 Røy et al.<br />
LOTZE, H. K. 2005. Radical changes in the Wadden Sea fauna and<br />
flora over the last 2000 years. Helgol. Mar. Res. 59: 71–83.<br />
MACINTYRE, H. L., R. J. GEIDER, AND D. C. MILLER. 1996.<br />
Microphytobenthos: The ecological role of the secret garden of<br />
unvegetated, shallow-water marine habitats. 1. Distribution,<br />
abundance and primary production. Estuaries 19: 186–201.<br />
MANNING, M. R., D. C. LOWE, W.H.MELHUISH, R.J.SPARKS, G.<br />
WALLACE, C. A. M. BRENNINKMEIJER, AND R. C. MCGILL.<br />
1990. The use of radiocarbon measurements in atmospheric<br />
studies. Radiocarbon 32: 37–58.<br />
MARTENS, C. S., AND J. V. KLUMP. 1980. Biogeochemical cycling in<br />
an organic-rich coastal marine basin. I. Methane sedimentwater<br />
exchange processes. Geochim. Cosmochim. Acta 44:<br />
471–490.<br />
MIDDELBURG, J. J., G. KLAVER,J.NIEUWENHUIZE,A.WIELEMAKER,<br />
W. DE HAAS, T.VLUG, AND J. F. W. AVAN DER NAT. 1996.<br />
Organic matter mineralization in intertidal sediments along<br />
an estuarine gradient. Mar. Ecol. Prog. Ser. 132: 157–168.<br />
———, AND oTHERS. 2000. The fate of intertidal microphytobenthos<br />
carbon: An in situ 13 C labeling study. Limnol.<br />
Oceanogr. 45: 1224–1234.<br />
———, AND oTHERS. 2002. Methane distribution in European<br />
tidal estuaries. Biogeochemistry 59: 95–119.<br />
NIELSEN, P. 1990. Tidal dynamics of the water table in beaches.<br />
Water Resour. Res. 26: 2127–2134.<br />
NYDAL, R., S. GULLIKSEN, K.LOVSETH, AND F. H. SKOGSETH. 1984.<br />
Bomb 14 C in the ocean surface 1966–1981. Radiocarbon 26:<br />
7–45.<br />
———, K. LOVSETH, AND F. H. SKOGSETH. 1980. Transfer of bomb<br />
14C to the ocean surface. Radiocarbon 22: 626–635.<br />
PETERSON, B. J., AND B. FRY. 1987. Stable isotopes in ecosystem<br />
studies. Annu. Rev. Ecol. Syst. 18: 293–320.<br />
PHILIPPART, C. J. M., AND oTHERS. 2007. Impacts of nutrient<br />
reduction on coastal communities. Ecosystems 10: 95–118.<br />
PRECHT, E., AND M. HUETTEL. 2003. Advective pore water<br />
exchange driven by surface gravity waves and its ecological<br />
implications. Limnol. Oceanogr. 48: 1674–1684.<br />
REEBURGH, W. S. 1983. Rates of biogeochemical processes in<br />
anoxic sediments. Annu. Rev. Earth Planet Sci. 11: 269–298.<br />
RIEDL, R. J., N. HUANG, AND R. MACHAN. 1972. The subtidal<br />
pump: A mechanism of interstitial water exchange by wave<br />
action. Mar. Biol. 13: 210–221.<br />
RUSCH, A., AND M. HUETTEL. 2000. Advective particle transport<br />
into permeable sediments—evidence from experiments in an<br />
intertidal sandflat. Limnol. Oceanogr. 45: 525–533.<br />
RUTGERS vAN DER LOEFF, M. M. 1980. Time variation in interstitial<br />
nutrient concentrations at an exposed subtidal station in the<br />
Dutch Wadden Sea. Neth. J. Sea Res. 14: 123–143.<br />
STUIVER, M., AND H. A. POLACH. 1977. Reporting of 14 C data—<br />
discussion. Radiocarbon 19: 355–363.<br />
THIBODEAUX, L. J., AND J. BOYLE D. 1987. Bedform-generated<br />
convective-transport in bottom sediment. Nature 325:<br />
341–343.<br />
TREUDE, T., M. KRÜGER, A.BOETIUS, AND B. B. JØRGENSEN. 2005.<br />
Environmental control on anaerobic oxidation of methane in<br />
the gassy sediments of Eckenfoerde Bay (German Baltic).<br />
Limnol. Oceanogr. 50: 1771–1786.<br />
VAN BEUSEKOM, J. E. E. 2005. A historic perspective on Wadden<br />
Sea eutrophication. Helgol. Mar. Res. 59: 45–54.<br />
———, U. H. BROCKMANN, K.J.HESSE, W.HICKEL, K.POREMA,<br />
AND U. TILLMANN. 1999. The importance of sediments in the<br />
transformation and turnover of nutrients and organic matter<br />
in the Waddensea and German Bight. Dtsch. Hydrogr. Z. 51:<br />
245–266.<br />
WEBSTER, I., HANCOCK, G., AND MURRAY, A. 1994. Use of radium<br />
isotopes to examine pore-water exchanges in an estuary.<br />
Limnol. Oceanogr. 39: 1917–1927.<br />
WERNER, U. 2005. Microbial activity and transport processes in<br />
near-shore, permeable sediments. Ph.D. thesis, Univ. Bremen.<br />
WILMS, R., B. KOPKE, H.SASS, T.S.CHANG, H.CYPIONKA, AND B.<br />
ENGELEN. 2006. Deep biosphere-related bacteria within the<br />
subsurface of tidal flat sediments. Environ. Microbiol. 8:<br />
709–719.<br />
Received: 24 April 2007<br />
Accepted: 10 December 2007<br />
Amended: 21 February 2008