Recipharm Annual Report 2006
Recipharm Annual Report 2006
Recipharm Annual Report 2006

Create successful ePaper yourself
Turn your PDF publications into a flip-book with our unique Google optimized e-Paper software.
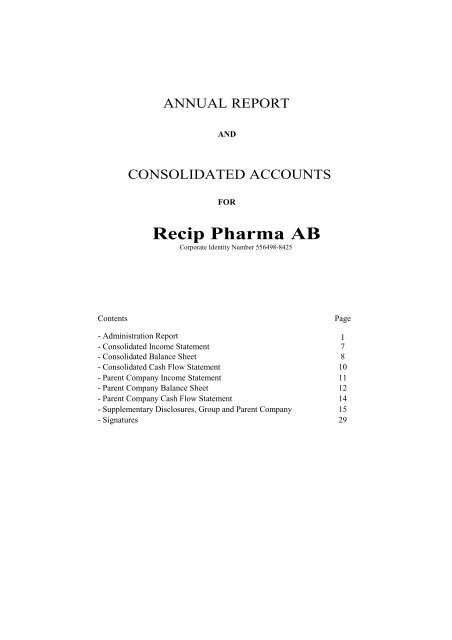
ANNUAL REPORT<br />
AND<br />
CONSOLIDATED ACCOUNTS<br />
FOR<br />
Recip Pharma AB<br />
Corporate Identity Number 556498-8425<br />
Contents Page<br />
- Administration <strong>Report</strong> 1<br />
- Consolidated Income Statement 7<br />
- Consolidated Balance Sheet 8<br />
- Consolidated Cash Flow Statement 10<br />
- Parent Company Income Statement 11<br />
- Parent Company Balance Sheet 12<br />
- Parent Company Cash Flow Statement 14<br />
- Supplementary Disclosures, Group and Parent Company 15<br />
- Signatures 29
Recip AB <strong>2006</strong><br />
Administration <strong>Report</strong><br />
The Board of Directors and Managing Director hereby submit the annual report and<br />
consolidated accounts for the financial year 1 January <strong>2006</strong> – 31 December <strong>2006</strong>.<br />
Group structure<br />
The Recip Group, with Recip Pharma AB as the Parent Company (formerly Recip AB), is a<br />
wholly-owned sub-group of Backsell-Eldered AB, Corporate Identity Number 556510-1879,<br />
with its registered offices in Stockholm. The consolidated accounts have been prepared partly<br />
by Recip Pharma AB with subsidiary, and partly by Backsell-Eldered AB for the entire<br />
Group.<br />
Market and sales<br />
The Group’s consolidated sales increased by 10% to MSEK 918.7 (MSEK 835.2). Sales in<br />
Sweden increased by 11% to MSEK 803.7 (MSEK 723.5) and comprised 87% (87%) of sales.<br />
The Group’s own products comprised 47% (44%) of sales and contract transactions accounted<br />
for the remaining portion.<br />
Own products<br />
Sales of the Group’s own products increased during the year by 20% and amounted to MSEK<br />
428.4 (MSEK 355.9). During <strong>2006</strong>, several products were acquired from Pfizer. Through<br />
these acquisitions, Recip gained the rights to trademarks, pharmaceutical registrations and<br />
other product rights, primarily related to the Swedish and Norwegian markets. The acquisition<br />
contributed to an increase in sales for the Group’s own products. Towards the end of the year,<br />
agreements were entered into for additional purchases of product rights from two different<br />
Danish companies. These acquisitions have only had a marginal impact on the Group’s results<br />
for <strong>2006</strong>.<br />
The Group’s five largest own products in <strong>2006</strong> included Kalcipos, Laktulos, Mitt Val, Triobe<br />
and Visiblin. Sales for the five largest own products comprised 53% (65%) of the total sales<br />
of own products.<br />
Contract transactions<br />
Sales related to contract transactions increased by 2% to MSEK 489.9 (MSEK 479.3). These<br />
sales do not include internal sales of own products. During the year, several products<br />
previously included in contract transactions were acquired and, thereby, are now own<br />
products. The increase in sales, excluding such acquisitions, was slightly more than 2%.<br />
During the year, work has been expended on a number of projects which are expected to lead<br />
to considerable sales. Several of these projects have involved not insignificant revenue from<br />
services in connection with preparations for ongoing production.<br />
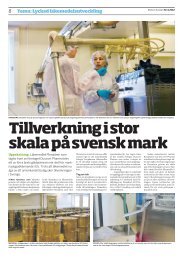
Production<br />
The Group’s production operations are organised into four separate companies which each<br />
run pharmaceutical production with a focus on different forms of preparations. Recip<br />
Stockholm AB, with facilities in Stockholm and Haninge is focused on solid preparation<br />
forms, primarily pills. Recip Höganäs AB is also focused on solid preparations, primarily in
the form of powders and granulates, including pharmaceutical products with dietary fibres as<br />
the main ingredient. Recip Strängnäs AB is entirely focused on penicillin products. Semisolid<br />
preparations, including creams, ointments and gels are produced by Recip Karlskrona<br />
AB. All of the facilities are modern and easily meet the requirements of government<br />
authorities and customers. During the year, investments have primarily been related to<br />
replacements and some minor expansions, primarily in Recip Stockholm AB.<br />
International organisation<br />
A complete marketing unit, including a local manager, product manager and product<br />
specialists, is run in Norway. This operation is run as a branch of Recip AB and has six<br />
employees. During the year, a sales unit with one employee was opened in the United<br />
Kingdom. This unit is also operated as a branch of Recip AB. The operations in the UK are<br />
primarily focused on business development and sales of contract transactions. In the United<br />
States, there is a subsidiary which sells ThyroSafe on the American market. This company has<br />
not had any employees during <strong>2006</strong>. In other countries, the Group’s products are sold through<br />
agents and distributors and, in certain cases, directly by Recip AB. During the year, measures<br />
were undertaken to open own marketing and sales companies in Denmark and Finland during<br />
2007.<br />
Net sales and results<br />
During the financial year, the Group’s net sales amounted to MSEK 918.7 (835.2), an<br />
increase of MSEK 83.5, or approximately 10%. This increase thereby corresponds with the<br />
Group’s aim of a growth rate of 10%.<br />
The operating margin in the Group during the financial year amounted to 9.7% (8.4), which is<br />
somewhat lower than the long-term goal for the Group of 10%.<br />
Profit/loss after financial items for the Group amounted to MSEK 84.7 (65.7), an<br />
improvement of MSEK 19.0, or approximately 29%.<br />
Profitability, calculated as the return on capital employed, amounted to 24% (29) for the<br />
Group, which exceeds the long-term goal of a return of 20% on capital employed.<br />
Operating profit/loss for the Group was distributed over the various units as follows:<br />
<strong>2006</strong> 2005 2004 2003<br />
Recip Pharma AB, Sweden -110.0 -22.9 68.2 44.6<br />
Recip Läkemedel AB 116.9 63.9<br />
Recip Karlskrona AB 22.2 12.1 -4.6<br />
Recip Stockholm AB 44.1 22.9<br />
Recip Strängnäs AB 2.8 3.8<br />
Recip Höganäs AB 2.1 -2.6<br />
Recip NUF, Norway 3.4 -3.9 -4.3 -4.5<br />
Recip Inc., USA 0.5 0.1 0.6 -0.6<br />
Other subsidiaries and eliminations 7.5 -3.6 0.4 -0.5<br />
Consolidated operating profit/loss 89.5 69.8 60.3 39.0
Liquidity and cash flow<br />
The Group’s unappropriated cash and cash equivalents, including the unutilised portion of the<br />
granted bank overdraft facilities, amounted to MSEK 152.9 (91.9) as per 31 December <strong>2006</strong>.<br />
Apart from equity of MSEK 227.1 (174.9), the Group’s operations are partly financed by<br />
long-term borrowings of MSEK 149.6 (63.6), and partly by a granted bank overdraft facility<br />
of MSEK 75.0 (75.0).<br />
Cash flow for the Group has been impaired and amounted to MSEK 19.4 (67.5) for the<br />
financial year. This amount includes MSEK 42.2 (167.9) from operating activities, MSEK -<br />
63.6 (-99.0) from investing activities and MSEK 40.7 (-1.4) from financing activities.<br />
At the end of the financial year, the Group’s equity/assets ratio amounted to 28% (30), which<br />
is lower than the Group’s long-term goal of 40%. The debt/equity ratio for the group<br />
amounted to 0.5 (0.3), which is less than the long-term goal of 0.6.<br />
Investments<br />
The Group’s gross investments in tangible fixed assets amounted to MSEK 14.2 (19.8) for the<br />
financial year. Of these investments, MSEK 10.9 (17.1) referred to investments in machinery<br />
and equipment, MSEK 2.8 (2.4) to constructions in progress and MSEK 0.5 (0.4) to costs of<br />
improvements in property not owned by the Group. The Group’s gross investments in product<br />
rights amounted to MSEK 183.9 (76.7) for the financial year.<br />
Summary covering several years<br />
<strong>2006</strong> 2005 2004<br />
Net sales, MSEK 918.7 835.2 602.9<br />
Operating profit/loss, MSEK 89.5 69.8 60.3<br />
Profit/loss after financial items, MSEK 84.7 65.7 58.6<br />
Profit for the year, MSEK 71.2 49.2 43.4<br />
Fixed assets, MSEK 302.9 173.5 105.2<br />
Current assets, MSEK 495.3 404.9 285.2<br />
Equity, MSEK 227.1 174.9 142.5<br />
Provisions 30.3 20.1 14.5<br />
Long-term liabilities, MSEK 169.8 71.7 52.2<br />
Short-term liabilities, MSEK 371.0 311.7 181.3<br />
Balance sheet total, MSEK 798.2 578.4 390.4<br />
Operating margin, % 9.7 8.4 10.0<br />
Return on capital employed, % 24 29 33<br />
Equity/assets ratio, % 28 30 36<br />
Debt/equity ratio 0.5 0.3 0.4<br />
Number of employees 570 572 435<br />
Refer to the section on accounting principles and the notes below for definitions of terms.
Research and development<br />
Recip’s development activities are focused on the pharmaceutical and clinical development of<br />
new products, as well as the further development of existing products and processes for<br />
greater customer benefit and efficiency. Product development and the development of<br />
production processes are expensed on an ongoing basis. R&D costs amounted to MSEK 23.9<br />
(MSEK 25.1).<br />
Environment<br />
Our vision is for Recip to set an example from an environmental perspective. Environmental<br />
work is important for Recip and forms an integrated part of daily work.<br />
To support this work with environmental improvement, Recip has an environmental<br />
management system covering both the working environment and the external environment.<br />
This system is certified in accordance with ISO14001, OHSAS18001 and the Swedish Work<br />
Environment Authority’s Statute Book (AFS) 2001:1.<br />
The impact of the Recip Group on the external environment is assessed as primarily<br />
attributable to carbon dioxide emissions from transport, the consumption of natural gas and<br />
the production of steam; the discharge of waste from production and laboratory operations;<br />
the discharge of solvents into the air, as well as the indirect environmental impact of hired<br />
suppliers.<br />
Recip’s production facilities, except for the one in Haninge, are subject to regulation in<br />
accordance with the Environmental Code. The facilities in Strängnäs, Årsta and Karlskronga<br />
conduct activities requiring a permit in accordance with the Swedish Ordinance Concerning<br />
Environmentally Hazardous Activities and the Protection of Public Health (SFS 1998:899),<br />
24.42-1, “factory for manufacture of pharmaceuticals with mechanical processes only”, under<br />
Level of Authority B.<br />
The facility in Höganäs conducts activities requiring a permit in accordance with the Swedish<br />
Ordinance Concerning Environmentally Hazardous Activities and the Protection of Public<br />
Health (SFS 1998:899), 24.41-4, “factory for manufacture of pharmaceuticals or natural<br />
medicines by extraction from biological materials”, under Level of Authority B.<br />
The facility in Haninge only conducts the packaging of pharmaceuticals and, consequently, is<br />
not subject to authorisation under the Swedish Environmental Code.<br />
No injunctions of an environmental nature or similar had been received from any authority by<br />
year-end. During the year, the Company has complied with the conditions of all granted<br />
authorisations.<br />
The Company deems that no environmental liabilities requiring future decontamination have<br />
arisen.<br />
Recip’s Sustainability <strong>Report</strong> is available to interested parties. This document reviews the<br />
Company’s work and performance as regards the working environment and social issues, the<br />
environment and finances.
Personnel<br />
The average number of employees in <strong>2006</strong> amounted to 570 (572), a decrease of 0.3%.<br />
Women comprised 60% (62%) of the personnel.<br />
Recip has been certified for many years in accordance with AFS 2000:1 and OHSAS 18001<br />
regarding the work environment.<br />
For additional personnel-related information, please refer to Note 4.<br />
Work of the Board of Directors<br />
At the <strong>Annual</strong> General Meeting for <strong>2006</strong>, all five members of the Board were re-elected. All<br />
members of the Board of Directors are men. The Board of Directors has held five regular<br />
meetings during the year.<br />
Significant events during the financial year or after the end of the financial year<br />
After the end of the accounting period, Recip Pharma AB changed its name from Recip AB.<br />
In conjunction with this, all marketing and sales operations were transferred to a new<br />
subsidiary in the Group. This company, hereafter, changed its name to Recip AB. The new<br />
Recip AB has overall responsibility for all marketing and sales activities in all countries and is<br />
also the Parent Company of the marketing companies in the Nordic region.<br />
Prospects for 2007 and risk analysis<br />
In addition to organic growth in the existing business, a number of ongoing projects regarding<br />
contract transactions, the full-year effect of implemented acquisitions of product rights and<br />
the establishment of Company-owned sales organisations in Denmark and Finland, taken as a<br />
whole, are expected to entail continued solid increases in sales during the financial year 2007.<br />
The Group is not deemed to be exposed to any particular risks that may impact operations in a<br />
decisive manner, apart from purely cyclical or business-related risks. However, it can be<br />
stated that the impact of changed regulations regarding such matters as the pricing of<br />
pharmaceuticals may be of decisive significance. As the Swedish portion of sales is dominant,<br />
the impact of amended regulations in Sweden is particularly large. However, such changes<br />
may entail both risks and opportunities for the Group. Sales to the most significant customers<br />
constitute a highly significant portion of contract transactions. However, sales are divided into<br />
a number of separate agreements with various commitment periods.<br />
Parent Company<br />
Operations<br />
The Company pursues the environmentally-aware development, manufacture and sales of<br />
pharmaceuticals, naturopathic preparations, dietary supplements, medical aids and associated<br />
operations.<br />
Ownership<br />
The Company is a wholly-owned subsidiary of Backsell-Eldered AB, Corporate Identity<br />
Number 556510-1879, with its registered offices in Stockholm, which prepares the<br />
consolidated accounts for the largest group.
Investments<br />
Gross investments for the year amounted to MSEK 163.2 (96.9). Of these, an amount of<br />
MSEK 159.3 (76.7) refers to investments in product rights and MSEK 3.9 (9.3) refers to<br />
investments in machinery and equipment.<br />
Significant events during the financial year or after its end<br />
During the financial year, product rights of a book value of MSEK 127.6 have been<br />
transferred to one of the Group's subsidiaries.<br />
Following year-end, the name of the Parent Company, Recip AB, was changed to Recip Pharma<br />
AB. In conjunction with this, the entire marketing and sales operation was transferred to a newlystarted<br />
subsidiary of the Group. This company subsequently changed its name to Recip AB. The new<br />
Recip AB bears overall responsibility for all marketing and sales activities in all countries and is also<br />
Parent Company of the marketing company in the Nordic region.<br />
Net sales and financial result<br />
Net sales for the financial year amounted to MSEK 135.5 (254.4), a decrease of MSEK 118.9 or<br />
approximately 46.7%. Profit/loss after financial items amounted to MSEK -146.6 (545.7) for the year.<br />
The figures for the comparative year should be considered in the light of the fact that major portions<br />
of Recip AB’s operations were transferred to several different Group subsidiaries during the period<br />
January – May 2005. Furthermore, profit/loss after financial items for the comparative year included<br />
a capital gain from the inter-company sale of subsidiaries in an amount of MSEK 574.9.<br />
Liquidity and financing<br />
The Company's cash and cash equivalents amounted to MSEK 48.3 (16.5) per 31 December <strong>2006</strong>.<br />
The possibility of utilisation of the Group's approved bank overdraft facility, of an amount of MSEK<br />
75.0 (75.0), can be added to this.<br />
Cash flow<br />
Total cash flow amounted to MSEK 32.8 (5.3). Cash flow from operating activities amounted to<br />
MSEK -59.5 (85.2) for the financial year. Of this amount, MSEK -29.4 (90.6) referred to investing<br />
activities and MSEK 121.7 (10.6) to financing activities.<br />
Appropriation of profits<br />
The following profits in the Parent Company are at the disposal of the <strong>Annual</strong> General Meeting.<br />
Profit brought forward 740,372,716<br />
Loss for the year - 118,029,797<br />
Total 622,342,919<br />
The Board of Directors proposes that the profits brought<br />
forward be distributed as follows:<br />
as a dividend to the shareholders, SEK 3 per share 30,000, 000<br />
to be carried forward 592,342,919<br />
Total 622,342,919<br />
Group<br />
According to the consolidated balance sheet, non-restricted equity amounts to SEK 137,148,185.<br />
Regarding the Group's result of operations, no provisions to restricted reserves are proposed.
CONSOLIDATED<br />
INCOME STATEMENTS<br />
Note<br />
1 Jan <strong>2006</strong><br />
31 Dec <strong>2006</strong><br />
1 Jan 2005<br />
31 Dec 2005<br />
Operating income, etc.<br />
Net sales 918,686,689 835,234,323<br />
Other operating income 7,137,124, 3,930,183<br />
925,823,813 839,164,506<br />
Operating expenses<br />
Raw materials and consumables -285,892,766 -254,673,736<br />
Other external expenses 2, 3 -199,275,853 -189,375,973<br />
Personnel costs 4 -299,748,784 -291,940,840<br />
Depreciation of tangible and amortisation of<br />
Intangible non-current assets 7,8,9,10,11 -44,909,787 -30,391,178<br />
Loss on disposal of tangible and intangible<br />
fixed assets -563,758 -<br />
Other operating expenses 5 -5,919,619 -3,025,299<br />
-836,310,567 -769,407,026<br />
Operating profit/loss 89,513,246 69,757,480<br />
Result from financial items<br />
Other interest income and similar profit/loss items 1,206,933 465,039<br />
Interest expenses and similar profit/loss items -5,986,890 -4,530,600<br />
-4,779,957 -4,065,561<br />
Profit/loss after financial items 84,733,289 65,691,919<br />
Tax on profit for the year 6 -13,491,248 -16,517,343<br />
Net profit/loss for the year 71,242,041 49,174,576
CONSOLIDATED<br />
BALANCE SHEETS<br />
ASSETS Note 31 Dec <strong>2006</strong> 31 Dec 2005<br />
Fixed assets<br />
Intangible fixed assets<br />
Product rights 7 232,014,452 83,713,758<br />
Other intangible fixed assets 8 5,593,633 7,872,950<br />
237,608,085 91,586,708<br />
Intangible fixed assets<br />
Land and buildings 9 1,379,605 1,435,200<br />
Improvement expenses for other parties’ property 10 3,146,944 4,325,261<br />
Machinery and equipment 11 56,923,146 65,311,608<br />
Constructions in progress 12 2,791,254 2,403,136<br />
64,240,949 73,475,205<br />
Financial fixed assets<br />
Other investments held as fixed assets 154,710 92,980<br />
Other long-term receivables 15 0 6,321,115<br />
Deferred tax assets 16 893,696 2,065,002<br />
1,048,406 8,479,097<br />
Total fixed assets 302,897,440 173,541,010<br />
Current assets<br />
Inventories<br />
Raw materials and consumables 69,854,144 64,269,289<br />
Products in process 24,878,802 26,056,904<br />
Finished products and goods for resale 74,087,756 67,475,079<br />
168,820,702 157,801,272<br />
Current receivables<br />
Accounts receivable - trade 137,883,843 98,996,957<br />
Income taxes recoverable 66,732,950 24,527,345<br />
Other receivables 6,424,656 29,361,753<br />
Prepaid expenses and accrued income 17 16,212,027 13,308,522<br />
227,253,476 166,194,577<br />
Cash and bank balances 18 99,180,124 80,869,580<br />
Total current assets 495,254,302 404,865,429<br />
TOTAL ASSETS 798,151 742 578,406,439
CONSOLIDATED<br />
BALANCE SHEETS<br />
EQUITY AND LIABILITIES<br />
Equity<br />
Note 31 Dec <strong>2006</strong> 31 Dec 2005<br />
19<br />
Restricted equity<br />
Share capital (10,000,000 shares) 10,000,000 10,000,000<br />
Restricted reserves 79,903,072 53,645,786<br />
89,903,072 63,645,786<br />
Non-restricted equity<br />
Non-restricted reserves 65,906,144 62,047,040<br />
Net profit/loss for the year 71,242,041 49,174,576<br />
137,148,185 111,221,616<br />
Total equity 227,051,257 174,867,402<br />
Provisions<br />
Deferred income tax liabilities<br />
30,287,862 20,076,695<br />
Total provisions 30,287,862 20,076,695<br />
Long-term liabilities<br />
21<br />
Liabilities to credit institutions 149,552,234 63,566,666<br />
Other long-term liabilities 20,227,304 8,157,796<br />
Total long-term liabilities 169,779,538 71,724,462<br />
Current liabilities<br />
Overdraft facility (credit limit 75 MSEK (75<br />
MSEK))<br />
18 21,227,759 62,958,329<br />
Accounts payable - trade 184,269,597 119,901,412<br />
Liabilities with Parent Company 0 23,333,332<br />
Income tax liabilities 134,177 0<br />
Other current liabilities 118,677,715 23,503,194<br />
Accrued expenses and deferred income 22 46,723,837 82,041,613<br />
Total current liabilities 371,033,085 311,737,880<br />
TOTAL EQUITY AND LIABILITIES 798,151,742 578,406,439<br />
Pledged assets 24 117,400,000 117,400,000<br />
Contingent liabilities None None
CONSOLIDATED<br />
CASH FLOW STATEMENTS 1 Jan <strong>2006</strong> 1 Jan 2005<br />
Note 31 Dec <strong>2006</strong> 31 Dec 2005<br />
Operating activities<br />
Profit/loss after financial items 84,733,289 65,691,919<br />
Adjustment for items not included in the cash flow 23 50,069,689 29,060,847<br />
Income tax paid -46,634,102 -28,071,449<br />
Net cash from operating activities<br />
before changes in working capital<br />
88,168,876 66,681,317<br />
Changes in working capital<br />
Decrease(+)/increase(-) in inventories -14,319,990 -27,134,821<br />
Decrease(+)/increase(-) in receivables -13,565,638 -931,213<br />
Decrease(-)/increase(+) in current liabilities -18,033,443 129,289,180<br />
Cash flow from operating activities 42,249 805 167,904,463<br />
Investing activities<br />
Acquisition of tangible fixed assets 10,11,12 -16,967,377 -19,779,422<br />
Acquisition of intangible fixed assets 7 -66,501,404 -79,440,100<br />
Acquisition of financial fixed assets -4,568 -1,761,708<br />
Disposals of fixed assets 7.11 19,909,318 1,970,759<br />
Cash flow from investing activities<br />
-63,564,031 -99 010,471<br />
Financing activities<br />
Long-term borrowings 75,597,369 19,561,289<br />
Dividends paid -16,000,000 -6,000,000<br />
Group contribution paid -18,888,889 -14,965,000<br />
Cash flow from financing activities 40,708,480 -1,403,711<br />
Change in cash and cash equivalents 19,394,254 67,490,281<br />
Cash and cash equivalents at beginning of year 80,869,580 12,813,593<br />
Exchange rate differences in cash and cash<br />
equivalents -1,083,710 565,706<br />
Cash and cash equivalents at end of year 99 180,124 80,869,580
PARENT COMPANY<br />
INCOME STATEMENTS<br />
Note<br />
1 Jan <strong>2006</strong><br />
31 Dec <strong>2006</strong><br />
1 Jan 2005<br />
31 Dec 2005<br />
Operating income, etc.<br />
Net sales 1 135,506,635 254,422,035<br />
Other operating income 6,000,270 3,724,343<br />
141,506,905 258,146,378<br />
Operating expenses 1<br />
Raw materials and consumables -66,614,327 -72,932,611<br />
Other external expenses 2, 3 -73,989,849 -92,640,276<br />
Personnel costs 4 -78,733,178 -106,173,966<br />
Depreciation of tangible and amortisation of<br />
Intangible non-current assets 7,8,9,10,11 -23,192,909 -11,610,278<br />
Loss on disposal of tangible<br />
fixed assets -456,316 0<br />
Other operating expenses 5 -5,130,194 -1,636,867<br />
-248,116,773 -284,993,998<br />
Operating profit/loss -106,609,868 -26,847,620<br />
Result from financial items<br />
Result from participations in Group companies -38,000,000 574,900,000<br />
Other interest income and similar profit/loss items 758,535 195,087<br />
Other interest income from Group companies 2,034,956 826,432<br />
Interest expenses and similar profit/loss items -4,817,410 -2,752,915<br />
Interest expenses to Group companies 0 -612,669<br />
-40,023,919 572,555,935<br />
Profit/loss after financial items -146,633,787 545,708,315<br />
Appropriations<br />
Transfer to tax allocation reserve 0 -7,900,000<br />
Reversal from tax allocation reserve 2,804,299 4,651,946<br />
Change of accelerated depreciation -4,051 , 647. -5,256,596<br />
-1,247,348 -8,504,650<br />
Profit/loss before taxes -147,881,135 537,203,665<br />
Tax on profit for the year 6 29,851,338 9,554,257<br />
Net profit/loss for the year -118,029,797 546,757,922
PARENT COMPANY<br />
BALANCE SHEETS<br />
ASSETS<br />
Fixed assets<br />
Note 31 Dec <strong>2006</strong> 31 Dec 2005<br />
Intangible fixed assets<br />
Product rights 7 71,722,884 71,713,758<br />
Other intangible fixed assets 8 5,593,633 7,872,950<br />
77,316,517 79,586,708<br />
Tangible fixed assets<br />
Land and buildings 9 914,507 954,046<br />
Improvement expenses for other parties’ property 10 334,998 370,844<br />
Machinery and equipment 11 8,426,277 9,306,273<br />
9,675,782 10,631,163<br />
Financial fixed assets<br />
Participations in Group companies 13 579,755,545 579,632,620<br />
Receivables from Group companies 14 223,000,000 0<br />
Other investments held as fixed assets 154,710 92,980<br />
Other long-term receivables 15 0 6,321,115<br />
802,910,255 586,046,715<br />
Total fixed assets 889,902,554 676,264,586<br />
Current assets<br />
Inventories<br />
Finished products and goods for resale 6,834,201 3,254,687<br />
6,834,201 3,254,687<br />
Current receivables<br />
Accounts receivable - trade 15,807,566 13,229,441<br />
Receivables from Group companies 157,530,476 246,671,319<br />
Income taxes recoverable 39,246,746 3,538,411<br />
Other receivables 5,654,944 20,208,076<br />
Prepaid expenses and accrued income 17 5,068,364 3,871,586<br />
223,308,096 287,518,833<br />
Cash and bank balances 18 48,289,841 16,483,250<br />
Total current assets 278,432,138 307,256,770<br />
TOTAL ASSETS 168,334,692 983,521,356
PARENT COMPANY<br />
BALANCE SHEETS<br />
EQUITY AND LIABILITIES<br />
Equity<br />
Note 31 Dec <strong>2006</strong> 31 Dec 2005<br />
19<br />
Restricted equity<br />
Share capital (10,000,000 shares) 10,000,000 10,000,000<br />
Statutory reserve 2,000,000 2,000,000<br />
12,000,000 12,000,000<br />
Non-restricted equity 740,372,716 131,658,065<br />
Profit brought forward -118,029,797 546,757,922<br />
Net profit/loss for the year 622,342,919 678,415,987<br />
Total equity<br />
634,342,919 690,415,987<br />
Untaxed reserves 20<br />
Tax allocation reserve 38,222,218 41,026,517<br />
Accumulated depreciation in excess of plan 22,893,405 18,841,758<br />
Total untaxed reserves 61,115,623 59,868,275<br />
Long-term liabilities 21<br />
Liabilities with credit institutions 114,991,329 48,566,666<br />
Liabilities with Group companies 85,650,000 0<br />
Other long-term liabilities 18,477,500 1,306,453<br />
Total long-term liabilities 219,118,829 49,873,119<br />
Current liabilities<br />
Overdraft facility (credit limit MSEK 75<br />
(MSEK 75))<br />
18 0 40,712,799<br />
Accounts payable - trade 130,076,296 56,989,526<br />
Liabilities with Group companies 11,030,007 7,060,142<br />
Liabilities with Parent Company 0 23,333,332<br />
Other current liabilities 94,086,591 3,952,698<br />
Accrued expenses and deferred income 22 18,564,427 51,315,478<br />
Total current liabilities 253,757,321 183,363,975<br />
TOTAL EQUITY AND LIABILITIES 1 168,334,692<br />
983,521,356<br />
Pledged assets 24 102,400,000 102,400,000<br />
Contingent liabilities<br />
Guarantee, Recip Karlskoga Fastighets AB, Corporate Identity Number 556657-8315.
PARENT COMPANY<br />
CASH FLOW ANALYSES<br />
Operating activities<br />
Note 1 Jan <strong>2006</strong><br />
31 Dec <strong>2006</strong><br />
1 Jan 2005<br />
31 Dec 2005<br />
Profit/loss after financial items -146,633,787 545,708,315<br />
Adjustment for items not included in the cash flow 23 56,676,589 -567,852,586<br />
Income tax paid -173,870 -6,419,270<br />
Cash flow from operating activities<br />
before changes in working capital -90,131,068 -28,563,541<br />
Changes in operating capital<br />
Decrease(+)/increase(-) in inventories -3,579,514 96,977,168<br />
Decrease(+)/increase(-) in receivables 25 33,031,816 -112,723,099<br />
decrease(-)/increase(+) in current liabilities 25 1,192,587 129,531,598<br />
Cash flow from operating activities<br />
-59,486,179 85,222,126<br />
Investing activities<br />
Acquisition of subsidiaries 13 -122,925 -575,344,070<br />
Disposals of subsidiaries 0 575,091,000<br />
Acquisition of tangible fixed assets 10.11 -6,647,061 -9,611,484<br />
Acquisition of intangible fixed assets 7 -41,928,029 -79,440,100<br />
Acquisition of financial fixed assets 0 -1,761,708<br />
Disposals of intangible and tangible<br />
fixed assets 7,11,25 19,265,838 481,254<br />
Cash flow from investing activities<br />
Financing activities<br />
-29,432,177 -90,585,108<br />
Long-term borrowings 66,424,663 31,597,413<br />
Dividend paid -16,000,000 -6,000,000<br />
Group contributions received/paid 71,251,111 -14,965,000<br />
Cash flow from financing activities<br />
121,675,774 10,632,413<br />
Change in cash and cash equivalents 32,757 418 5,269,431<br />
Cash and cash equivalents at beginning of year 16,483,250 10,745,088<br />
Exchange rate difference in cash and cash<br />
equivalents -950,827 468,731<br />
Cash and cash equivalents at end of year 48 289,841 16,483,250
SUPPLEMENTARY DISCLOSURES<br />
GENERAL DISCLOSURES<br />
Accounting principles<br />
The accounting principles applied are in accordance with the Swedish <strong>Annual</strong> Accounts Act and the general<br />
advice and guidelines of the Swedish Accounting Standards Board. Any deviations are specified in the notes<br />
below. The accounting principles remain unchanged compared with the previous year.<br />
Valuation principles, etc<br />
Assets, provisions and liabilities are valued at acquisition cost, unless otherwise stated below.<br />
Receivables<br />
Receivables are reported in the amounts that they are estimated to be received. Foreign receivables and<br />
liabilities have been recorded at the closing rate of exchange.<br />
Inventories<br />
Inventories are valued at the average acquisition or manufacturing cost for the year, although not at a rate<br />
higher than the market value.<br />
Revenue recognition<br />
Revenue recognition takes place when the material risks and benefits associated with the company’s<br />
goods are transferred to the purchaser.<br />
Tax<br />
The Company applies the Swedish Financial Accounting Standards Council's recommendation RR9, Income Tax. Total<br />
tax consists of current tax and deferred tax. Taxes are reported in the income statement except when the underlying<br />
transaction is reported directly against equity, in which case accompanying tax effects are reported in equity. Current<br />
tax (previously Income Tax Paid) is tax to be paid or received for the current year, including adjustments of current<br />
taxes attributable to previous periods. Deferred tax is calculated in accordance with the balance sheet method, taking,<br />
as its basis, temporary differences between the carrying amounts and fiscal values of assets and liabilities. These<br />
amounts are calculated on the basis of the manner in which the temporary differences are expected to be settled and by<br />
using tax rates and tax rules adopted or announced on balance sheet date. Deferred tax assets attributable to deductible<br />
temporary differences and loss carry-forwards are recognised only to the extent it is likely that they will result in<br />
lower tax payments in the future.<br />
Group contributions<br />
Group contributions are reported in accordance with the statements of the Financial Accounting Standards<br />
Council’s Emerging Issues Task Force (URA 7). Group contributions are reported according to their economic<br />
significance, namely by minimising the Group's total tax. As Group contributions do not, therefore, constitute<br />
compensation for performance, these are reported directly against profit brought forward after deduction of<br />
their tax effects.<br />
Leasing<br />
Financial lease agreements, which substantially transfer to the Company all the risks and benefits of the leased asset<br />
associated with ownership, are reported as assets in the consolidated balance sheet statement from the date on which<br />
the agreement is entered. The assets are then valued at the fair value of the leased object or at the present value of the<br />
minimum leasing fees for the period of the lease, if this is lower. The payment of leasing fees is divided into financial<br />
expenses and reduction (repayment of borrowings) of the financial liability, so that a constant interest rate is achieved<br />
on the accounted liability. These financial expenses are charged to profit/loss.<br />
Assets under financial leasing agreements are depreciated over the shorter period of estimated useful life or the<br />
duration of the leasing agreement.<br />
Leasing agreements substantially transferring all risks and benefits associated with ownership to the lessor are classified<br />
as operational leasing agreements. Leasing fees from operational leasing agreements are reported as expenses in the<br />
income statement and are allocated on a straight-line basis over the duration of the agreement.<br />
In the Parent Company, all leasing agreements are classified as operational leasing agreements.
Depreciation/amortisation principles for fixed assets<br />
Fixed assets are reported at acquisition value, less accumulated depreciation/amortisation.<br />
Depreciation/amortisation is performed systematically over the asset's expected useful life, according to the<br />
schedule below:<br />
Fixed assets Useful life<br />
Product rights 9 - 10 years<br />
Other intangible fixed assets 5 years<br />
Machinery and equipment 3- 8 years<br />
Buildings 25 years<br />
Improvement expense for other parties’ property 8 - 1 0 years<br />
Consolidated accounts<br />
The consolidated accounts have been prepared according to the Swedish Financial Accounting Standards Council's<br />
recommendation RR 1:00, using the purchase method. The Group's equity comprises the Parent Company's equity<br />
and that portion of the subsidiaries’ equity arising after these companies have been acquired. In addition to the<br />
Parent Company, the consolidated accounts include all companies in which the Parent Company, directly or<br />
indirectly, owns more than 50 percent of the votes or, in any other manner, has control in accordance with Swedish<br />
<strong>Annual</strong> Accounts Act, 1:4.<br />
Translation of foreign subsidiaries<br />
The annual accounts of foreign subsidiaries are translated into SEK in accordance with the current method. The current<br />
method implies that all assets, provisions and other liabilities are translated to the exchange rate prevailing at balance<br />
sheet date and that all items in the income statement are translated at the average exchange rate for the year. Accrued<br />
translation differences are reported directly against equity.<br />
Definitions<br />
Operating margin Operating profit/loss in relation to net sales<br />
Capital employed Total balance sheet total less non-interest-bearing liabilities and provisions<br />
Return on capital employed Operating income plus interest income in relation to average capital employed<br />
Equity/assets ratio Equity in relation to balance sheet total.<br />
Debt/equity ratio Interest-bearing liabilities less cash and cash equivalents in relation to equity
DISCLOSURES FOR INDIVIDUAL ITEMS<br />
Note 1 Purchases and sales within the Group and related party transactions<br />
PARENT COMPANY <strong>2006</strong> 2005<br />
Sales to Group companies 26,656,663 32,673,078<br />
Purchases from Group<br />
companies<br />
91,262,325 36,523,341<br />
The Group rents factory and office premises in Haninge from KB Titania, which is an associated company.<br />
The annual fee for <strong>2006</strong> amounts to MSEK 11.<br />
Note 2 Operating leases<br />
GROUP <strong>2006</strong> 2005<br />
Leasing charges for the<br />
financial year<br />
956,181 0<br />
Estimated fees, 2007 346,00 0<br />
Estimated fees, 2008 0 0<br />
Estimated fees, 2009 0 0<br />
Estimated fees, 2010 0 0<br />
Estimated fees, 2011 0 0<br />
Operating leases<br />
PARENT COMPANY<br />
<strong>2006</strong> 2005<br />
Leasing charges for the<br />
financial year<br />
6,320,834 0<br />
Estimated fees, 2007 5,316,660 5,286,660<br />
Estimated fees, 2008 0 1,762,220<br />
Estimated fees, 2009 0 0<br />
Estimated fees, 2010 0 0<br />
Estimated fees, 2011 0 0<br />
Financial leases<br />
GROUP <strong>2006</strong> 2005<br />
Leasing charges for the<br />
financial year<br />
2,242,601 0<br />
Estimated fees, 2007 2,017,994 1,842,887<br />
Estimated fees, 2008 1,842,887 1,831,668<br />
Estimated fees, 2009 1,831,668 1,831,668<br />
Estimated fees, 2010 1,831,668 1,831,668<br />
Estimated fees, 2011 1,831,668 0
Note 3 Fees and remuneration for audit<br />
GROUP <strong>2006</strong> 2005<br />
Ernst & Young AB<br />
1,420,092 562,460<br />
Audit assignment 90,000 118,000<br />
Other assignments 1,510,092 680,460<br />
PARENT COMPANY <strong>2006</strong> 2005<br />
Ersnt & Young AB<br />
1,430,092 300,000<br />
Audit assignment 90,000 118,000<br />
Other assignments 1,520,092 418,000<br />
Note 4 Personnel<br />
Average number of employees<br />
The average number of employees is based on attendance hours, paid by the Company, in relation to standard<br />
working hours.<br />
GROUP <strong>2006</strong> 2005<br />
Average number of employees 570 572<br />
of whom women 342 354<br />
PARENT COMPANY <strong>2006</strong> 2005<br />
Average number of employees 85 82<br />
of whom women 52 49<br />
Absence due to illness<br />
Absence due to illness as a percentage of standard working hours<br />
GROUP<br />
Number of employees Absence due to illness, % Of which >60 days, %<br />
Year, Age Men Women Men Women Men Women<br />
<strong>2006</strong>, < 29 30 17 4.8 10.9 14.1 50.1<br />
2005, < 29 29 30 5.7 15.5 17.5 77.4<br />
<strong>2006</strong>, 30-49 128 205 3.7 7.2 35.2 48.1<br />
2005, 30-49 121 190 3.7 21.6 42.2<br />
<strong>2006</strong>, > 50 70 120 4.8 8.4 55.5 68.3<br />
2005, > 50 68 134 5.4 92.5 82.2<br />
Total, <strong>2006</strong> 228 342 4.2 7.8 39.2 55.7<br />
Total, 2005 218 354 4.5 8.6 46.7 64.0
PARENT COMPANY <strong>2006</strong> 2005<br />
Absence due to illness for all employees 2.32% 4.37%<br />
Proportion of absence due to illness referring to longterm<br />
absences<br />
27.59% 58.40%<br />
Absence due to illness for women 3.34% 5.25%<br />
Absence due to illness for men 0.73% 3.32%<br />
Absence due to illness for personnel 29 years and<br />
younger<br />
0.00%<br />
8.17%<br />
Absence due to illness for personnel 30-49 years 3.45% 2.94%<br />
Absence due to illness for personnel 50 years and older 0.89% 5.40%<br />
Salaries, other remuneration and social security contributions<br />
Salaries, remuneration, social security contributions and pension<br />
costs have been paid in the following amounts:<br />
GROUP <strong>2006</strong> 2005<br />
Board of Directors, Managing<br />
Director and Vice Managing<br />
Director<br />
Other employees:<br />
Salaries and remuneration 5,981,305 6,140,649<br />
Pension costs 1,545,863 1,072,554<br />
7,527,168 7,213,203<br />
Salaries and remuneration 190,633,736 187,578,757<br />
Pension costs 15,515,101 14,349,733<br />
206,145,837 201,928,490<br />
Social security contributions 68,024,327 66,961,516<br />
- -<br />
Total, Board and others 281,697,332 276,103,209<br />
PARENT COMPANY <strong>2006</strong> 2005<br />
Board of directors, Managing<br />
Director and Vice Managing<br />
Director 2,798,321 3,601,180<br />
Salaries and remuneration 627,240 634,462<br />
Pension costs 3,425,561 4,235,642<br />
Other employees: 44,042,627 59,107,421<br />
Salaries and remuneration 5,765,731 8,011,697 ,<br />
Pension costs 49,808,358 67,119,118<br />
Social security contributions 16,420,310 22,726,374<br />
- -<br />
Total, Board and others 69,654,229 94,081,134
The Norwegian branch stands for SEK 2,926,511 (5,225,614) of total salaries and other<br />
remuneration.<br />
Pension commitments to the Board of Directors,<br />
Managing Director and vice Managing Director 0 0<br />
Senior management<br />
GROUP <strong>2006</strong> 2005<br />
Number of Board Members, incl. Managing<br />
Director<br />
46 43<br />
of whom women 10 10<br />
Number of other members of senior management 27 30<br />
of whom women 10 10<br />
PARENT COMPANY <strong>2006</strong> 2005<br />
Number of Board Members, incl. Managing<br />
Director<br />
7 7<br />
of whom women 0 0<br />
Number of other members of senior management 5 6<br />
of whom women 1 1<br />
Note 5 Other operating expenses<br />
GROUP<br />
Exchange losses on receivables/liabilities<br />
<strong>2006</strong> 2005<br />
relating to operations -5,919,619 -3,025,299<br />
PARENT COMPANY <strong>2006</strong> 2005<br />
Exchange losses on receivables/liabilities<br />
relating to operations -5,130,194 -1,636,867<br />
Note 6 Tax on profit for the year<br />
GROUP<br />
<strong>2006</strong> 2005<br />
Current tax -708,775 -7,528,269<br />
Deferred tax referring to temporary differences -1,171,306 501,735<br />
Deferred tax, untaxed reserves -10,211,167 -5,601,920<br />
Tax on Group contributions -1,400,000 -3,888,889<br />
-13,491 248 -16,517,343<br />
Difference between tax according to current tax rates and actual tax
Tax according to Parent Company's current tax<br />
rate, 28%<br />
<strong>Report</strong>ed profit before taxes<br />
84,733,290 65,691,919<br />
Tax revenue/ tax expense -23,725,321 -18,393,745<br />
Tax effect of non-deductible expenses -1,008,967 -2,067,601<br />
Tax effect of non-taxable income 10,904,093 4,591,915<br />
Tax revenue -418,727 0<br />
Corrections from previous assessment period -94,662 0<br />
Change in temporary differences 852,336 -647,922<br />
Current tax expense (28%) -13,491,248 -16,517,353<br />
PARENT COMPANY <strong>2006</strong> 2005<br />
Current tax -94,662 -6,659,987<br />
Deferred tax referring to temporary differences 0 -1,563,267<br />
Tax on Group contributions 29,946,000 17,777,511<br />
29,851,338 9,554 257<br />
Difference between tax according to current tax rates and actual tax<br />
<strong>Report</strong>ed profit/loss before taxes<br />
Tax according to Parent Company's current tax<br />
rate, 28%<br />
Tax revenue / Tax expense<br />
-147,881,135<br />
537,203,665<br />
41,406,718 -150,417,026<br />
Tax effect of non-deductible expenses -11,301,861 -1,115,242<br />
Tax effect of non-taxable income 65,142 162,649,793<br />
Tax revenue -223,999 0<br />
Corrections from previous assessment period -94,662 0<br />
Change in temporary differences 0 -1,563,268<br />
Current tax expense (28%) 29,851,338 9,554,257<br />
Note 7 Product rights<br />
GROUP<br />
31 Dec <strong>2006</strong><br />
31 Dec 2005<br />
Opening acquisition cost 113,022,100 36,282,000<br />
Purchases 183,854,125 76,740,100<br />
Sales/disposals -14,583,126 0<br />
Closing accumulated acquisition cost 282,293,099 13,022,100<br />
Opening amortisation -29,308,342 -22,782,000<br />
Sales/disposals 0 0<br />
Amortisation for the year -20,970,305 , 6,526,342<br />
Closing accumulated amortisation -50,278,647 -29,308,342<br />
Book value 232,014,452 83,713,758<br />
Amortisation according to plan is estimated according to a useful lifetime of 9 - 10 years.
PARENT COMPANY<br />
31 Dec <strong>2006</strong><br />
31 Dec 2005<br />
Opening acquisition cost 98,022,100 36,282,000<br />
Purchases 159,280,750 76,740,100<br />
Sales/disposals -157,594,818 0<br />
Acquisition value via transfer of assets and<br />
liabilities<br />
0 -15,000,000<br />
Closing accumulated acquisition cost 99,708,032 98,022,100<br />
Opening amortisation -26,308,342 -22,782,000<br />
Sales/disposals 15,409,969 0<br />
Accumulated amortisation via transfer of assets and<br />
liabilities 0 1,500,000<br />
Amortisation for the year -17,086,775 , -5,026,342<br />
Closing accumulated amortisation -27,985,148 -26,308,342<br />
Book value 71,722,884 71,713,758<br />
Amortisation according to plan is estimated according to a useful lifetime of 9-10 years.<br />
Note 8 Other intangible fixed assets<br />
GROUP AND PARENT COMPANY<br />
31 Dec <strong>2006</strong> 31 Dec 2005<br />
Opening acquisition cost 11,396,585 8,696,585<br />
Purchases 0 2,700,000<br />
Closing accumulated acquisition values 11,396,585 11,396,585<br />
Opening amortisation -3,523,635 -1,739,317<br />
Amortisation for the year -2 27.9,317 -1,784,318<br />
Closing accumulated amortisation -5,802,952 -3,523,635<br />
Book value 5,593,633 7 872,950<br />
Amortisation according to plan is estimated according to a useful lifetime of 5 years.<br />
Note 9 Land and buildings<br />
GROUP<br />
31 Dec <strong>2006</strong> 31 Dec 2005<br />
Opening acquisition cost 1,637,193 , 1,637,193<br />
Closing accumulated acquisition cost 1,637,193 1,637,193<br />
Opening depreciation -201,993 -147,426<br />
Depreciation for the year -55,595 -54,567<br />
Closing accumulated depreciation -257,588 -201,993<br />
Book value 1,379,605 1,435,200<br />
Book value, buildings 1,132,232 1,187,827<br />
Book value, land 247,373 247,373<br />
1,379,605 1 435,200
Depreciation according plan to is estimated according to a useful lifetime of 5 years.<br />
Tax assessment value<br />
31 Dec <strong>2006</strong><br />
31 Dec 2005<br />
Tax assessment value of the Group's properties:<br />
31,702,000<br />
31,702,000<br />
attributable to buildings: 26,448,000 26,448,000<br />
PARENT COMPANY<br />
31 Dec <strong>2006</strong><br />
31 Dec 2005<br />
Opening acquisition cost 1,135,998 1,135,998<br />
Closing accumulated acquisition cost 1,135,998 1,135,998<br />
Opening depreciation<br />
-181,952<br />
-142,414<br />
Depreciation for the year -39,539 -39,538<br />
Closing accumulated depreciation -221,491 -181,952<br />
Book value 914,507 954,046<br />
Book value, buildings 766,958 806,497<br />
Book value, land 147,549 147,549<br />
914,507<br />
954,046<br />
Depreciation according to plan is estimated according to a useful lifetime of 25 years.<br />
Tax assessment value<br />
31 Dec <strong>2006</strong> 31 Dec 2005<br />
Tax assessment value of the Company's<br />
properties:<br />
15,023,000<br />
15,023,000<br />
attributable to buildings: 13,091,000 13,091,000<br />
Note 10 Improvement costs for other parties’ property<br />
GROUP<br />
31 Dec <strong>2006</strong><br />
31 Dec 2005<br />
Opening acquisition cost 21,910,102 21,555,273<br />
Purchases 489,686 354,829<br />
Closing accumulated acquisition cost 22,399 788 21,910,102<br />
Opening amortisation -17,584,841 -15,945,735<br />
Amortisation for the year -1,668,003 -1,639,106<br />
Closing accumulated amortisation -19,252,844 -17,584,841<br />
Book value 3,146,944 4,325,261<br />
PARENT COMPANY 31 Dec <strong>2006</strong> 31 Dec 2005<br />
Opening acquisition cost 9,081,963 21,555,273<br />
Purchases 0 354,829
Acquisition value via transfer of assets and<br />
liabilities<br />
0 -12,828,139<br />
Closing accumulated acquisition cost 9,081,963 9,081,963<br />
Opening amortisation -8,711,119 -15,945,735<br />
Accumulated amortisation via transfer of assets<br />
and liabilities<br />
0 7,269,008<br />
Amortisation for the year -35,846 -34,392<br />
Closing accumulated amortisation -8,746,965 -8,711,119<br />
Book value 334,998 370,844<br />
Amortisation according to plan is calculated for a useful lifetime of 8-10 years.<br />
Note 11 Machinery and equipment<br />
GROUP<br />
31 Dec <strong>2006</strong> 31 Dec 2005<br />
Opening acquisition cost 206,061,807 176,310,257<br />
Purchases 10,933,148 I7,068,959<br />
Sales/disposals -2,812,155 -1,970,759<br />
Reclassifications 2,403,136 14,653,350<br />
Closing accumulated acquisition cost 216,585,936 206,061,807<br />
Opening depreciation -140,750,199 -121,693,683<br />
Sales/disposals 1,473,755 1,330,330<br />
Depreciation for the year -20,386,346 -20,386,846<br />
Closing accumulated depreciation -159,662,790 -140,750,199<br />
Book value 56,923,146 65,311,608<br />
Depreciation according plan to is estimated according to a useful lifetime of 3-8 years.<br />
PARENT COMPANY<br />
31 Dec <strong>2006</strong> 31 Dec 2005<br />
Opening acquisition cost 91,988,231 176,118,902<br />
Purchases 3,893,708 9,302,407<br />
Sales/disposals -1,324,407 -842,587<br />
Acquisition value via transfer of assets and<br />
liabilities<br />
0 -92,590,491<br />
Closing accumulated acquisition cost 94,557,532 91,988,231<br />
Opening depreciation -82,681,958 -121,684,115<br />
Accumulated depreciation via transfer of assets<br />
and liabilities<br />
0<br />
43,026,217<br />
Sales/disposals 751,848 701,629<br />
Depreciation for the year -4,201,145 -4,725,689<br />
Closing accumulated depreciation -86,131,255 -82,681,958<br />
Book value 8,426,277 9,306,273<br />
Depreciation according to plan is estimated according to a useful lifetime of 3-8 years.<br />
Note 12 Constructions in progress and advance payments for tangible fixed assets
GROUP<br />
31 Dec <strong>2006</strong> 31 Dec 2005<br />
Opening acquisition cost 2,403,136 16,848,698<br />
Constructions in progress for the year 2,791,254 2,403,136<br />
Reclassifications -2,403,136 16,848,698<br />
-16,848,698<br />
Closing accumulated acquisition cost 2,791,254<br />
2,403,136<br />
Note 13 Participations in Group<br />
companies<br />
PARENT COMPANY<br />
Company, Corporate Identity<br />
Number<br />
Registered<br />
offices<br />
Number of<br />
participations/<br />
31 Dec <strong>2006</strong> 31 Dec 2005<br />
participation % Book value Book value<br />
Recip ApS Köpenhamn 1,000 575,296,620 575,296,620<br />
Corporate Identity Number<br />
28305443<br />
100%<br />
Recip Stockholm AB Stockholm 1,000 100,000 100,000<br />
Corporate Identity Number<br />
556666-8249<br />
100%<br />
Recip Strängnäs AB Strängnäs 1,000 100,000 100,000<br />
Corporate Identity Number<br />
556666-8231<br />
100%<br />
Recip US Inc. Delaware 1,000 927,000 927,000<br />
Corporate Identity Number<br />
74-3061963<br />
100%<br />
Recip Holding AB Stockholm 100,000 9,000 9,000<br />
Corporate Identity Number<br />
556666-2697<br />
9%<br />
Recip Karlskoga AB Karlskoga 100,000 100,000 100,000<br />
Corporate Identity Number<br />
556662-4366<br />
100%<br />
Recip Karlskoga Fastigheter<br />
AB Stockholm 100,000 100,000 100,000<br />
Corporate Identity Number<br />
556657-8315<br />
100%<br />
Recip AB Stockholm 100,000 100,000 0<br />
Corporate Identity Number<br />
556694-8849<br />
100%<br />
Recip Höganäs AB Höganäs 100,000 3,000,000 3,000,000<br />
Corporate Identity Number<br />
556666-2606<br />
100%<br />
Oy Aplifin Ab, name being<br />
changed to Recip Finland Oy Helsingfors<br />
Ab<br />
1,000 22,925 0<br />
Corporate Identity Number<br />
2073382-6<br />
100%<br />
579,755,545 579,632,620<br />
Opening acquisition cost 579,632,620 1,579,550<br />
Purchase, new shares<br />
122,925 575,344,070<br />
Sales/disposals .<br />
0 -191,000
Closing accumulated acquisition cost 579,755,545 576,732,620<br />
Shareholders' contribution 38,000,000 2,900,000<br />
Write-downs for the year -38,000,000 0<br />
Closing accumulated revaluations, net 0 2,900,000<br />
Book value 579,755,545 579,632,620<br />
Note 14 Receivables from Group companies<br />
PARENT COMPANY 31 Dec <strong>2006</strong> 31 Dec 2005<br />
Promissory note receivables to subsidiary 223,000,000 0<br />
Book value 223,000,000 0<br />
Note 15 Other long-term receivables<br />
GROUP AND PARENT COMPANY<br />
31 Dec<br />
<strong>2006</strong><br />
31 Dec<br />
2005<br />
Endowment insurance 0 6,254,789<br />
Deposits 0 66,326<br />
Book value 0 6,321.115<br />
Endowment insurance policies are classified as current receivables as per 31 December<br />
<strong>2006</strong>, as these are estimated to be paid during 2007.<br />
Note 16 Deferred tax assets<br />
GROUP<br />
31 Dec<br />
<strong>2006</strong><br />
31 Dec<br />
2005<br />
Inter-company profit in inventory 344,510 1,627,103<br />
Difference between permissible book and tax related<br />
Value, machines and equipment 549,186 437,899 ,<br />
Book value 893,696 2,065,002<br />
All changes for the year of the above balance sheet items have been reported in the<br />
income statement. The deferred income tax recoverable (temporary differences) are<br />
attributable to the items mentioned above.<br />
Note 17 Prepaid expenses and accrued income<br />
GROUP 31 Dec<br />
<strong>2006</strong><br />
31 Dec<br />
2005<br />
Prepaid rent 5,973,755 2,559,290<br />
Prepaid leasing fees 536,356 631,821<br />
Prepaid annual fees 3,915,403 1,309,975<br />
Prepaid insurance premiums 1,543,945 2,018,412<br />
Accrued interest income 0 352,613<br />
Accrued income 2,838,350 1,707,853<br />
Other items 1,404,218 4,728,558<br />
16,212,027 13,308,522<br />
PARENT COMPANY 31 Dec<br />
<strong>2006</strong><br />
31 Dec<br />
2005<br />
Prepaid rent 570,897 16,274<br />
Prepaid annual fees 2,165,060 613,230<br />
Accrued interest income 0 352,613<br />
Prepaid insurance premiums 1,095,315 1,529,832<br />
Prepaid leasing fees 536,356 196,615<br />
Other items 700,736 1,163,022
Note 18 Bank overdraft facility 31 Dec<br />
<strong>2006</strong><br />
5,068,364 3,871,586<br />
31 Dec<br />
2005<br />
The granted bank overdraft facility amounts to:<br />
Group 75,000,000 75,000,000<br />
Parent Company 75,000,000 75,000,000<br />
Note 19 Equity<br />
GROUP<br />
Share capital Restricted<br />
Non-restricted<br />
reserves<br />
equity<br />
Amount at beginning of year 10,000,000 53,645,786 111,221,616<br />
Translation difference 541,814<br />
Adjustments between restricted and<br />
non-restricted equity<br />
26,257,286 -26,257,286<br />
Group contribution paid -5,000,000<br />
Tax effect of Group contribution 1,400,000<br />
Dividends paid -16,000,000<br />
Net profit/loss for the year 71,242,041<br />
Amount at year-end 10,000,000 79,903,072 137,148,185<br />
PARENT COMPANY<br />
Share capital Restricted<br />
Non-restricted<br />
reserves<br />
equity<br />
Amount at beginning of year 10,000,000 2,000,000 678,415,986<br />
Translation difference 952,730<br />
Group contribution received/paid 106,950,000<br />
Tax effect of Group contribution -29,946,000<br />
Dividends paid -16,000,000<br />
Net profit/loss for the year -118,029,797<br />
Amount at year-end 10,000,000 2,000,000 622,342,919<br />
Note 20 Untaxed reserves<br />
PARENT COMPANY 31 Dec <strong>2006</strong> 31 Dec 2005<br />
Difference between recorded<br />
depreciation and depreciation<br />
according to plan<br />
22,893,405 18,841,758<br />
Tax allocation reserve, assessment<br />
2001<br />
0 2,804,299<br />
Tax allocation reserve, assessment<br />
2002<br />
6,204,997 6,204,997<br />
Tax allocation reserve ; assessment<br />
2003<br />
7,805,757 7,805,757<br />
Tax allocation reserve, assessment<br />
2004<br />
7,937,464 7,937,464<br />
Tax allocation reserve, assessment<br />
2005<br />
8,374,000 8,374,000<br />
Tax allocation reserve, assessment<br />
<strong>2006</strong><br />
7,900,000 7,900,000<br />
61,115,623 59,868,275<br />
Note 21 Long-term liabilities<br />
GROUP 31 Dec <strong>2006</strong> 31 Dec 2005<br />
Repayments of borrowings within 1<br />
year<br />
Repayments of borrowings within 5<br />
years<br />
0 7,874,000<br />
169,779,538 40,798,010
Repayments of borrowings within 5<br />
years<br />
0 23,052,452<br />
169,779,538 71,724,462<br />
PARENT COMPANY 31 Dec <strong>2006</strong> 31 Dec 2005<br />
Repayments of borrowings within 1<br />
year<br />
Repayments of borrowings within 5<br />
years<br />
Repayments of borrowings within 5<br />
years<br />
0 7,874,000<br />
219,118,829 33,946,667<br />
0 8,052,452<br />
219,118,829 49,873,119<br />
Note 22 Accrued expenses and deferred income<br />
GROUP 31 Dec <strong>2006</strong> 31 Dec 2005<br />
Holiday pay liabilities and decreased working hours 17,180,276 18,177,220<br />
Social security contributions 6,708,850 11,272,666<br />
Accrued expense interests 0 431,849<br />
Profit sharing and bonuses 7,811,966 4,594,766<br />
Product rights 0 29,421,600<br />
Other items 15,022,745 18,143,512<br />
46,723,837<br />
82,041,613<br />
PARENT COMPANY 31 Dec <strong>2006</strong> 31 Dec 2005<br />
Holiday pay liabilities and decreased working hours 3,684,172 3,665,703<br />
Social security contributions 2,258,264 2,947,574<br />
Profit sharing and bonus 7,165,825 4,594,766<br />
Product rights 0 29,421,600<br />
Accrued expense interest 0 343,487<br />
Other items 5,456,166 10,342,348<br />
18,564,427<br />
51,315,478<br />
Note 23 Adjustments for non-cash items 31 Dec <strong>2006</strong> 31 Dec 2005<br />
GROUP<br />
Depreciation/amortisation 44,909,787 30,391,178<br />
Gains from disposal of tangible and<br />
intangible fixed assets -2,036,062 -1,330,331<br />
Unrealised exchange gains -2,671,387 0<br />
Other items 9,867,351 0<br />
50,069,689 29,060,847<br />
PARENT COMPANY 31 Dec <strong>2006</strong> 31 Dec 2005<br />
Depreciation/amortisation 23,192,909 11,610,278<br />
Write-down shares in subsidiaries<br />
Gains from disposals of tangible and<br />
38,000,000 -575,240,296<br />
intangible fixed assets<br />
-1,844,933<br />
Other items -2,671,387 -4,222,568<br />
56,676,589 -567,852,586
Note 24 Liabilities for which assets have been pledged<br />
GROUP<br />
31 Dec<br />
<strong>2006</strong><br />
31 Dec<br />
2005<br />
Property mortgage, Strängnäs, Kemisten 3 19,400,000 19,400,000<br />
Property mortgage, Karlskoga, Bofors 1:10 15,000,000 15,000,000<br />
Floating charges 83,000,000 83,000,000<br />
117,400,00<br />
0<br />
117,400,00<br />
0<br />
PARENT COMPANY 31 Dec<br />
31 Dec<br />
Property mortgage Strängnäs, Kemisten 3 19,400,000<br />
<strong>2006</strong><br />
19,400,000<br />
2005<br />
Floating charges 83,000,000 83,000,000<br />
Note 25 Promissory note receivables with Group companies<br />
102,400,00<br />
0<br />
102,400,00<br />
0<br />
Some of the previous intra-group transactions reported last year as current receivables and liabilities have been<br />
converted into long-term intra-group promissory note receivables. This also includes sales of product rights to<br />
subsidiaries. This change has not resulted in any cash flows.
Stockholm, 22 March 2007<br />
Anders G Carlberg<br />
Chairman of the Board of Directors Lars-Göran Carlsson<br />
Olle Christenson Thomas Eldered<br />
Göran Pettersson Tony Sandell<br />
Lars Backsell<br />
Managing Director<br />
My audit report was presented on 23 March 2007<br />
Michael Forss<br />
Authorised Public Accountant
Audit report<br />
To the annual meeting of the shareholders of Recip Pharma AB<br />
Corporate Identity Number 556498-8425<br />
I have audited the annual accounts, the consolidated accounts, the accounting records and the<br />
administration of the board of directors and the managing director of Recip Pharma AB for<br />
the financial year <strong>2006</strong>. The board of directors and managing director are responsible for<br />
these accounts and the administration of the company, as well as for the application of the<br />
<strong>Annual</strong> Accounts Act when preparing the annual accounts and consolidated accounts. My<br />
responsibility is to express an opinion on the annual accounts, the consolidated accounts and<br />
the administration based on my audit.<br />
I conducted my audit in accordance with generally accepted auditing standards in Sweden.<br />
Those standards require that I plan and perform the audit to obtain reasonable assurance that<br />
the annual accounts and the consolidated accounts are free of material misstatement. An audit<br />
includes examining, on a test basis, evidence supporting the amounts and disclosures in the<br />
accounts. An audit also includes assessing the accounting principles used and their<br />
application by the board of directors and managing director, as well as evaluating the overall<br />
presentation of information in the annual accounts and the consolidated accounts. As a basis<br />
for my opinion concerning discharge from liability, I examined significant decisions, actions<br />
taken and circumstances of the company in order to be able to determine the liability, if any,<br />
to the company of any board member or the managing director. I also examined whether any<br />
board member or the managing director has, in any other way, acted in contravention of the<br />
Companies Act, the <strong>Annual</strong> Accounts Act or the Articles of Association. I believe that my<br />
audit provides a reasonable basis for my opinion set out below.<br />
The annual report and consolidated accounts have been prepared in accordance with the<br />
Swedish <strong>Annual</strong> Accounts Act and give a true and fair view of the company's and the group's<br />
results of operations and financial position in accordance with generally accepted accounting<br />
principles in Sweden. The statutory administration report is consistent with the Swedish<br />
<strong>Annual</strong> Accounts Act and the other parts of the consolidated accounts.<br />
I recommend to the annual meeting of shareholders that the income statements and the<br />
balance sheets of the parent company and group be adopted, that the profit of the parent<br />
company be dealt with in accordance with the proposal in the administration report and that<br />
the members of the board of directors and the managing director be discharged from liability<br />
for the financial year.<br />
Stockholm, 23 March 2007<br />
Michael Forss<br />
Authorised Public Accountant