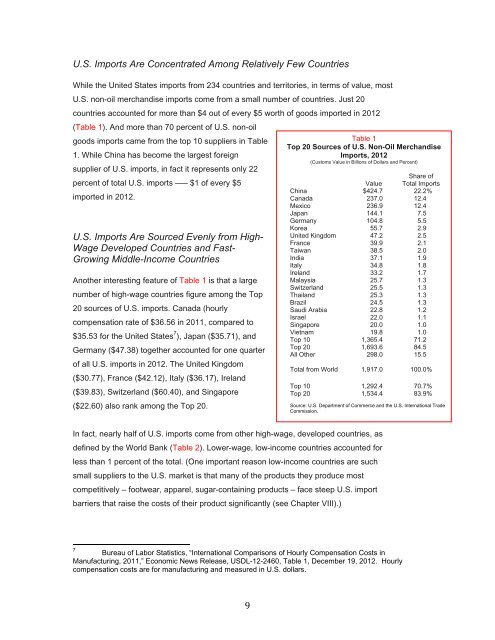
U.S. <strong>Imports</strong> Are Concentrated Among Relatively Few Countries While the United States imports from 234 countries and territories, in terms of value, most U.S. non-oil merchandise imports come from a small number of countries. Just 20 countries accounted for more than $4 out of every $5 worth of goods imported in 2012 (Table 1). And more than 70 percent of U.S. non-oil goods imports came from the top 10 suppliers in Table 1. While China has become the largest foreign supplier of U.S. imports, in fact it represents only 22 percent of total U.S. imports —– $1 of every $5 imported in 2012. TABLE 2 U.S. <strong>Imports</strong> Are Sourced Evenly from High- Wage Developed Countries and Fast- Growing Middle-Income Countries Another interesting feature of Table 1 is that a large number of high-wage countries figure among the Top 20 sources of U.S. imports. Canada (hourly compensation rate of $36.56 in 2011, compared to $35.53 for the United States 7 ), Japan ($35.71), and Germany ($47.38) together accounted for one quarter of all U.S. imports in 2012. The United Kingdom ($30.77), France ($42.12), Italy ($36.17), Ireland ($39.83), Switzerland ($60.40), and Singapore ($22.60) also rank among the Top 20. In fact, nearly half of U.S. imports come from other high-wage, developed countries, as defined by the World Bank (Table 2). Lower-wage, low-income countries accounted for less than 1 percent of the total. (One important reason low-income countries are such small suppliers to the U.S. market is that many of the products they produce most competitively – footwear, apparel, sugar-containing products – face steep U.S. import barriers that raise the costs of their product significantly (see Chapter VIII).) 7 Table 1 Top 20 Sources of U.S. Non-Oil Merchandise <strong>Imports</strong>, 2012 (Customs Value in Billions of Dollars and Percent) Share of Value Total <strong>Imports</strong> China $424.7 22.2% Canada 237.0 12.4 Mexico 236.9 12.4 Japan 144.1 7.5 Germany 104.8 5.5 Korea 55.7 2.9 United Kingdom 47.2 2.5 France 39.9 2.1 Taiwan 38.5 2.0 India 37.1 1.9 Italy 34.8 1.8 Ireland 33.2 1.7 Malaysia 25.7 1.3 Switzerland 25.5 1.3 Thailand 25.3 1.3 Brazil 24.5 1.3 Saudi Arabia 22.8 1.2 Israel 22.0 1.1 Singapore 20.0 1.0 Vietnam 19.8 1.0 Top 10 1,365.4 71.2 Top 20 1,693.6 84.5 All Other 298.0 15.5 Total from World 1,917.0 100.0% Top 10 1,292.4 70.7% Top 20 1,534.4 83.9% Source: U.S. Department of Commerce and the U.S. International Trade Commission. Bureau of Labor Statistics, “International Comparisons of Hourly Compensation Costs in Manufacturing, 2011,” Economic News Release, USDL-12-2460, Table 1, December 19, 2012. Hourly compensation costs are for manufacturing and measured in U.S. dollars.
Income High Middle Low Total * Weighted by the value of total imports from each country. ** The World Bank de $12,476 or more in 2011; “middle income” countries are those with a GNI per capita of $1,026 to $12,475, and “low income” countries are those with a GNI per capita of $1, *** 34 countries or territories could not be included in this table because World Bank GNI per capita data are not available for them. However, as a group they represent just 0.04 percent of total U.S. imports, so their exclusion from this t Sources: Trade Partnership Worldwide, LLC, from World Bank, “Gross national income per capita 2011, Atlas method and PPP,” Taiwan came from the International Monetary Fund. including computers and telephones) 49.7 growing share of U.S. exports (Chart 3 exporting and importing are linked (see Chapter II) this group drives that point home. countries percent of U.S. exports 2012 percent in 1996. this same group of countries accounted for 30 percent of U.S. imports.) U.S. imports goes hand in hand with growth in U.S. exports. 8 becoming the majority in Mexico, in a profound demographic transformation that has far implications [in Mexico] and in the United States still imagine a country of downtrodden masses dominated by a wealthy elite, the swelling ranks of the middle class are crowding the new Wal The members of this new class are not worried about getting enough to eat. They’re worried that their kids eat too much.” William Booth and Nick Miroff, “In Mexico, a Middle Majority,” 18, 2012, p. A 9 from “middle income” to “high income” in that year. Income High Middle Low Total * Weighted by the value of total imports from each country. ** The World Bank de $12,476 or more in 2011; “middle income” countries are those with a GNI per capita of $1,026 to $12,475, and “low income” countries are those with a GNI per capita of $1, *** 34 countries or territories could not be included in this table because World Bank GNI per capita data are not available for them. However, as a group they represent just 0.04 percent of total U.S. imports, so their exclusion from this t Sources: Trade Partnership Worldwide, LLC, from World Bank, “Gross national income per capita 2011, Atlas method and PPP,” Taiwan came from the International Monetary Fund. including computers and telephones) 49.7 percent. What is notable about this group of growing share of U.S. exports Chart 3 exporting and importing are linked (see Chapter II) this group drives that point home. countries percent of U.S. exports 2012, compared to just 28 percent in 1996. this same group of countries accounted for 30 percent of U.S. imports.) U.S. imports goes hand in hand with growth in U.S. exports. becoming the majority in Mexico, in a profound demographic transformation that has far implications [in Mexico] and in the United States still imagine a country of downtrodden masses dominated by a wealthy elite, the swelling ranks of the middle class are crowding the new Wal The members of this new class are not worried about getting enough to eat. They’re worried that their kids eat too much.” William Booth and Nick Miroff, “In Mexico, a Middle Majority,” 18, 2012, p. A from “middle income” to “high income” in that year. Income High-Income Countries Middle-Income Countries Low-Income Countries Total * Weighted by the value of total imports from each country. ** The World Bank de $12,476 or more in 2011; “middle income” countries are those with a GNI per capita of $1,026 to $12,475, and “low income” countries are those with a GNI per capita of $1, *** 34 countries or territories could not be included in this table because World Bank GNI per capita data are not available for them. However, as a group they represent just 0.04 percent of total U.S. imports, so their exclusion from this t Sources: Trade Partnership Worldwide, LLC, from World Bank, “Gross national income per capita 2011, Atlas method and PPP,” Taiwan came from the International Monetary Fund. including computers and telephones) percent. What is notable about this group of growing share of U.S. exports Chart 3) exporting and importing are linked (see Chapter II) this group drives that point home. Middle income countries percent of U.S. exports , compared to just 28 percent in 1996. this same group of countries accounted for 30 percent of U.S. imports.) U.S. imports goes hand in hand with growth in U.S. exports. A recent becoming the majority in Mexico, in a profound demographic transformation that has far implications [in Mexico] and in the United States still imagine a country of downtrodden masses dominated by a wealthy elite, the swelling ranks of the middle class are crowding the new Wal The members of this new class are not worried about getting enough to eat. They’re worried that their kids eat too much.” William Booth and Nick Miroff, “In Mexico, a Middle Majority,” 18, 2012, p. A The from “middle income” to “high income” in that year. U.S. Non Income Categories** Income Countries Income Countries Income Countries * Weighted by the value of total imports from each country. ** The World Bank de $12,476 or more in 2011; “middle income” countries are those with a GNI per capita of $1,026 to $12,475, and “low income” countries are those with a GNI per capita of $1, *** 34 countries or territories could not be included in this table because World Bank GNI per capita data are not available for them. However, as a group they represent just 0.04 percent of total U.S. imports, so their exclusion from this t Sources: Trade Partnership Worldwide, LLC, from World Bank, “Gross national income per capita 2011, Atlas method and PPP,” Taiwan came from the International Monetary Fund. including computers and telephones) percent. What is notable about this group of growing share of U.S. exports ). Remember that exporting and importing are linked (see Chapter II) this group drives that point Middle income countries account percent of U.S. exports , compared to just 28 percent in 1996. this same group of countries accounted for 30 percent of U.S. imports.) U.S. imports goes hand in hand with growth in U.S. exports. A recent becoming the majority in Mexico, in a profound demographic transformation that has far implications [in Mexico] and in the United States still imagine a country of downtrodden masses dominated by a wealthy elite, the swelling ranks of the middle class are crowding the new Wal The members of this new class are not worried about getting enough to eat. They’re worried that their kids eat too much.” William Booth and Nick Miroff, “In Mexico, a Middle Majority,” 18, 2012, p. A The from “middle income” to “high income” in that year. U.S. Non Categories** Income Countries Income Countries Income Countries * Weighted by the value of total imports from each country. ** The World Bank defines “high income” countries as those with gross national income (GNI) per capita of $12,476 or more in 2011; “middle income” countries are those with a GNI per capita of $1,026 to $12,475, and “low income” countries are those with a GNI per capita of $1, *** 34 countries or territories could not be included in this table because World Bank GNI per capita data are not available for them. However, as a group they represent just 0.04 percent of total U.S. imports, so their exclusion from this t Sources: Trade Partnership Worldwide, LLC, from World Bank, “Gross national income per capita 2011, Atlas method and PPP,” Taiwan came from the International Monetary Fund. including computers and telephones) percent. What is notable about this group of growing share of U.S. exports Remember that exporting and importing are linked (see Chapter II) this group drives that point Middle income account percent of U.S. exports , compared to just 28 percent in 1996. this same group of countries accounted for 30 percent of U.S. imports.) So growth in U.S. imports goes hand in hand with growth in U.S. exports. A recent becoming the majority in Mexico, in a profound demographic transformation that has far implications [in Mexico] and in the United States still imagine a country of downtrodden masses dominated by a wealthy elite, the swelling ranks of the middle class are crowding the new Wal The members of this new class are not worried about getting enough to eat. They’re worried that their kids eat too much.” William Booth and Nick Miroff, “In Mexico, a Middle Majority,” 18, 2012, p. A-1. The drop in share in 2001 for middle income countries is due large to the reclassification of Korea from “middle income” to “high income” in that year. U.S. Non-Oil Goods <strong>Imports</strong> by Income Groups, 2012 Categories** Income Countries Income Countries Income Countries * Weighted by the value of total imports from each country. fines “high income” countries as those with gross national income (GNI) per capita of $12,476 or more in 2011; “middle income” countries are those with a GNI per capita of $1,026 to $12,475, and “low income” countries are those with a GNI per capita of $1, *** 34 countries or territories could not be included in this table because World Bank GNI per capita data are not available for them. However, as a group they represent just 0.04 percent of total U.S. imports, so their exclusion from this table does not distort the results. Sources: Trade Partnership Worldwide, LLC, from World Bank, “Gross national income per capita 2011, Atlas method and PPP,” http://databank.worldbank.org/databank/download/GNIPC.pdf Taiwan came from the International Monetary Fund. including computers and telephones) percent. What is notable about this group of growing share of U.S. exports Remember that exporting and importing are linked (see Chapter II) this group drives that point Middle income accounted percent of U.S. exports , compared to just 28 percent in 1996. 9 (In 1996, this same group of countries accounted for 30 percent of So growth in U.S. imports goes hand in hand with growth in U.S. exports. A recent Washington Post becoming the majority in Mexico, in a profound demographic transformation that has far implications [in Mexico] and in the United States still imagine a country of downtrodden masses dominated by a wealthy elite, the swelling ranks of the middle class are crowding the new Wal The members of this new class are not worried about getting enough to eat. They’re worried that their kids eat too much.” William Booth and Nick Miroff, “In Mexico, a Middle Majority,” drop in share in 2001 for middle income countries is due large to the reclassification of Korea from “middle income” to “high income” in that year. Oil Goods <strong>Imports</strong> by Income Groups, 2012 Categories** Income Countries Income Countries Income Countries * Weighted by the value of total imports from each country. fines “high income” countries as those with gross national income (GNI) per capita of $12,476 or more in 2011; “middle income” countries are those with a GNI per capita of $1,026 to $12,475, and “low income” countries are those with a GNI per capita of $1, *** 34 countries or territories could not be included in this table because World Bank GNI per capita data are not available for them. However, as a group they represent just 0.04 percent of total U.S. imports, so able does not distort the results. Sources: Trade Partnership Worldwide, LLC, from World Bank, “Gross national income per capita 2011, http://databank.worldbank.org/databank/download/GNIPC.pdf Taiwan came from the International Monetary Fund. including computers and telephones) percent. What is notable about this group of growing share of U.S. exports Remember that exporting and importing are linked (see Chapter II) this group drives that point Middle income ed for 40 percent of U.S. exports , compared to just 28 (In 1996, this same group of countries accounted for 30 percent of So growth in U.S. imports goes hand in hand with growth in U.S. exports. Washington Post becoming the majority in Mexico, in a profound demographic transformation that has far implications [in Mexico] and in the United States still imagine a country of downtrodden masses dominated by a wealthy elite, the swelling ranks of the middle class are crowding the new Wal The members of this new class are not worried about getting enough to eat. They’re worried that their kids eat too much.” William Booth and Nick Miroff, “In Mexico, a Middle Majority,” drop in share in 2001 for middle income countries is due large to the reclassification of Korea from “middle income” to “high income” in that year. Oil Goods <strong>Imports</strong> by Income Groups, 2012 (Share of Total U.S. <strong>Imports</strong>) Income Countries Income Countries Income Countries * Weighted by the value of total imports from each country. fines “high income” countries as those with gross national income (GNI) per capita of $12,476 or more in 2011; “middle income” countries are those with a GNI per capita of $1,026 to $12,475, and “low income” countries are those with a GNI per capita of $1, *** 34 countries or territories could not be included in this table because World Bank GNI per capita data are not available for them. However, as a group they represent just 0.04 percent of total U.S. imports, so able does not distort the results. Sources: Trade Partnership Worldwide, LLC, from World Bank, “Gross national income per capita 2011, http://databank.worldbank.org/databank/download/GNIPC.pdf Taiwan came from the International Monetary Fund. including computers and telephones) percent. What is notable about this group of growing share of U.S. exports Remember that exporting and importing are linked (see Chapter II), and this group drives that point Middle income for 40 percent of U.S. exports in , compared to just 28 (In 1996, this same group of countries accounted for 30 percent of So growth in U.S. imports goes hand in hand with growth in U.S. exports. Washington Post becoming the majority in Mexico, in a profound demographic transformation that has far implications [in Mexico] and in the United States still imagine a country of downtrodden masses dominated by a wealthy elite, the swelling ranks of the middle class are crowding the new Wal The members of this new class are not worried about getting enough to eat. They’re worried that their kids eat too much.” William Booth and Nick Miroff, “In Mexico, a Middle Majority,” drop in share in 2001 for middle income countries is due large to the reclassification of Korea from “middle income” to “high income” in that year. Oil Goods <strong>Imports</strong> by Income Groups, 2012 (Share of Total U.S. <strong>Imports</strong>) * Weighted by the value of total imports from each country. fines “high income” countries as those with gross national income (GNI) per capita of $12,476 or more in 2011; “middle income” countries are those with a GNI per capita of $1,026 to $12,475, and “low income” countries are those with a GNI per capita of $1, *** 34 countries or territories could not be included in this table because World Bank GNI per capita data are not available for them. However, as a group they represent just 0.04 percent of total U.S. imports, so able does not distort the results. Sources: Trade Partnership Worldwide, LLC, from World Bank, “Gross national income per capita 2011, http://databank.worldbank.org/databank/download/GNIPC.pdf Taiwan came from the International Monetary Fund. including computers and telephones) percent. What is notable about this group of growing share of U.S. exports Remember that exporting and importing are and this group drives that point for 40 in , compared to just 28 (In 1996, this same group of countries accounted for 30 percent of So growth in U.S. imports goes hand in hand with growth in U.S. exports. Washington Post becoming the majority in Mexico, in a profound demographic transformation that has far implications [in Mexico] and in the United States still imagine a country of downtrodden masses dominated by a wealthy elite, the swelling ranks of the middle class are crowding the new Wal The members of this new class are not worried about getting enough to eat. They’re worried that their kids eat too much.” William Booth and Nick Miroff, “In Mexico, a Middle Majority,” drop in share in 2001 for middle income countries is due large to the reclassification of Korea from “middle income” to “high income” in that year. Table 2 Oil Goods <strong>Imports</strong> by Income Groups, 2012 (Share of Total U.S. <strong>Imports</strong>) Number Countries 56 105 37 198*** * Weighted by the value of total imports from each country. fines “high income” countries as those with gross national income (GNI) per capita of $12,476 or more in 2011; “middle income” countries are those with a GNI per capita of $1,026 to $12,475, and “low income” countries are those with a GNI per capita of $1, *** 34 countries or territories could not be included in this table because World Bank GNI per capita data are not available for them. However, as a group they represent just 0.04 percent of total U.S. imports, so able does not distort the results. Sources: Trade Partnership Worldwide, LLC, from World Bank, “Gross national income per capita 2011, http://databank.worldbank.org/databank/download/GNIPC.pdf Taiwan came from the International Monetary Fund. including computers and telephones) percent. What is notable about this group of growing share of U.S. exports exporting and importing are this same group of countries accounted for 30 percent of U.S. imports goes hand in hand with growth in U.S. exports. Washington Post becoming the majority in Mexico, in a profound demographic transformation that has far implications [in Mexico] and in the United States still imagine a country of downtrodden masses dominated by a wealthy elite, the swelling ranks of the middle class are crowding the new Wal-Marts, driving Nissan sedans and maxing out their Banamex The members of this new class are not worried about getting enough to eat. They’re worried that their kids eat too much.” William Booth and Nick Miroff, “In Mexico, a Middle Majority,” drop in share in 2001 for middle income countries is due large to the reclassification of Korea from “middle income” to “high income” in that year. Table 2 Oil Goods <strong>Imports</strong> by Income Groups, 2012 (Share of Total U.S. <strong>Imports</strong>) Number Of Countries 56 105 37 198*** * Weighted by the value of total imports from each country. fines “high income” countries as those with gross national income (GNI) per capita of $12,476 or more in 2011; “middle income” countries are those with a GNI per capita of $1,026 to $12,475, and “low income” countries are those with a GNI per capita of $1, *** 34 countries or territories could not be included in this table because World Bank GNI per capita data are not available for them. However, as a group they represent just 0.04 percent of total U.S. imports, so able does not distort the results. Sources: Trade Partnership Worldwide, LLC, from World Bank, “Gross national income per capita 2011, http://databank.worldbank.org/databank/download/GNIPC.pdf Taiwan came from the International Monetary Fund. including computers and telephones) percent. What is notable about this group of U.S. imports goes hand in hand with growth in U.S. exports. Washington Post article began as follows: “A wary but tenacious middle class is fast becoming the majority in Mexico, in a profound demographic transformation that has far implications [in Mexico] and in the United States still imagine a country of downtrodden masses dominated by a wealthy elite, the swelling ranks of the middle Marts, driving Nissan sedans and maxing out their Banamex The members of this new class are not worried about getting enough to eat. They’re worried that their kids eat too much.” William Booth and Nick Miroff, “In Mexico, a Middle Majority,” drop in share in 2001 for middle income countries is due large to the reclassification of Korea from “middle income” to “high income” in that year. Table 2 Oil Goods <strong>Imports</strong> by Income Groups, 2012 (Share of Total U.S. <strong>Imports</strong>) Number Countries 198*** * Weighted by the value of total imports from each country. fines “high income” countries as those with gross national income (GNI) per capita of $12,476 or more in 2011; “middle income” countries are those with a GNI per capita of $1,026 to $12,475, and “low income” countries are those with a GNI per capita of $1, *** 34 countries or territories could not be included in this table because World Bank GNI per capita data are not available for them. However, as a group they represent just 0.04 percent of total U.S. imports, so able does not distort the results. Sources: Trade Partnership Worldwide, LLC, from World Bank, “Gross national income per capita 2011, http://databank.worldbank.org/databank/download/GNIPC.pdf Source: Trade Partnership Worldwide, LLC from Census data. Share of Total U.S. Exports including computers and telephones) — percent. What is notable about this group of U.S. imports goes hand in hand with growth in U.S. exports. article began as follows: “A wary but tenacious middle class is fast becoming the majority in Mexico, in a profound demographic transformation that has far implications [in Mexico] and in the United States still imagine a country of downtrodden masses dominated by a wealthy elite, the swelling ranks of the middle Marts, driving Nissan sedans and maxing out their Banamex The members of this new class are not worried about getting enough to eat. They’re worried that their kids eat too much.” William Booth and Nick Miroff, “In Mexico, a Middle Majority,” drop in share in 2001 for middle income countries is due large to the reclassification of Korea from “middle income” to “high income” in that year. Oil Goods <strong>Imports</strong> by Income Groups, 2012 (Share of Total U.S. <strong>Imports</strong>) Average 2010 fines “high income” countries as those with gross national income (GNI) per capita of $12,476 or more in 2011; “middle income” countries are those with a GNI per capita of $1,026 to $12,475, and “low income” countries are those with a GNI per capita of $1,025 or less. *** 34 countries or territories could not be included in this table because World Bank GNI per capita data are not available for them. However, as a group they represent just 0.04 percent of total U.S. imports, so Sources: Trade Partnership Worldwide, LLC, from World Bank, “Gross national income per capita 2011, http://databank.worldbank.org/databank/download/GNIPC.pdf Middle Income Countries’ Shares of Total U.S. Exports Compared to Source: Trade Partnership Worldwide, LLC from Census data. 20% 30% 40% 50% 60% 70% Share of Total U.S. Exports — supplied just under half of U.S. im percent. What is notable about this group of U.S. imports goes hand in hand with growth in U.S. exports. article began as follows: “A wary but tenacious middle class is fast becoming the majority in Mexico, in a profound demographic transformation that has far implications [in Mexico] and in the United States still imagine a country of downtrodden masses dominated by a wealthy elite, the swelling ranks of the middle Marts, driving Nissan sedans and maxing out their Banamex The members of this new class are not worried about getting enough to eat. They’re worried that their kids eat too much.” William Booth and Nick Miroff, “In Mexico, a Middle Majority,” drop in share in 2001 for middle income countries is due large to the reclassification of Korea from “middle income” to “high income” in that year. Oil Goods <strong>Imports</strong> by Income Groups, 2012 (Share of Total U.S. <strong>Imports</strong>) Average 2010 Per Capita Income* $41,029 21,285 fines “high income” countries as those with gross national income (GNI) per capita of $12,476 or more in 2011; “middle income” countries are those with a GNI per capita of $1,026 to $12,475, 025 or less. *** 34 countries or territories could not be included in this table because World Bank GNI per capita data are not available for them. However, as a group they represent just 0.04 percent of total U.S. imports, so Sources: Trade Partnership Worldwide, LLC, from World Bank, “Gross national income per capita 2011, http://databank.worldbank.org/databank/download/GNIPC.pdf Middle Income Countries’ Shares of Total U.S. Exports Compared to Source: Trade Partnership Worldwide, LLC from Census data. 20% 30% 40% 50% 60% 70% supplied just under half of U.S. im percent. What is notable about this group of U.S. imports goes hand in hand with growth in U.S. exports. article began as follows: “A wary but tenacious middle class is fast becoming the majority in Mexico, in a profound demographic transformation that has far implications [in Mexico] and in the United States. Although many Mexicans and their neighbors to the north still imagine a country of downtrodden masses dominated by a wealthy elite, the swelling ranks of the middle Marts, driving Nissan sedans and maxing out their Banamex The members of this new class are not worried about getting enough to eat. They’re worried that their kids eat too much.” William Booth and Nick Miroff, “In Mexico, a Middle Majority,” drop in share in 2001 for middle income countries is due large to the reclassification of Korea from “middle income” to “high income” in that year. Oil Goods <strong>Imports</strong> by Income Groups, 2012 (Share of Total U.S. <strong>Imports</strong>) Average 2010 Per Capita Income* $41,029 4,634 760 21,285 fines “high income” countries as those with gross national income (GNI) per capita of $12,476 or more in 2011; “middle income” countries are those with a GNI per capita of $1,026 to $12,475, 025 or less. *** 34 countries or territories could not be included in this table because World Bank GNI per capita data are not available for them. However, as a group they represent just 0.04 percent of total U.S. imports, so Sources: Trade Partnership Worldwide, LLC, from World Bank, “Gross national income per capita 2011, http://databank.worldbank.org/databank/download/GNIPC.pdf Middle Income Countries’ Shares of Total U.S. Exports Compared to Source: Trade Partnership Worldwide, LLC from Census data. supplied just under half of U.S. im percent. What is notable about this group of U.S. imports goes hand in hand with growth in U.S. exports. article began as follows: “A wary but tenacious middle class is fast becoming the majority in Mexico, in a profound demographic transformation that has far . Although many Mexicans and their neighbors to the north still imagine a country of downtrodden masses dominated by a wealthy elite, the swelling ranks of the middle Marts, driving Nissan sedans and maxing out their Banamex The members of this new class are not worried about getting enough to eat. They’re worried that their kids eat too much.” William Booth and Nick Miroff, “In Mexico, a Middle Majority,” drop in share in 2001 for middle income countries is due large to the reclassification of Korea from “middle income” to “high income” in that year. Oil Goods <strong>Imports</strong> by Income Groups, 2012 Average 2010 Per Capita Income* $41,029 4,634 760 21,285 fines “high income” countries as those with gross national income (GNI) per capita of $12,476 or more in 2011; “middle income” countries are those with a GNI per capita of $1,026 to $12,475, 025 or less. *** 34 countries or territories could not be included in this table because World Bank GNI per capita data are not available for them. However, as a group they represent just 0.04 percent of total U.S. imports, so Sources: Trade Partnership Worldwide, LLC, from World Bank, “Gross national income per capita 2011, http://databank.worldbank.org/databank/download/GNIPC.pdf Middle Income Countries’ Shares of Total U.S. Exports Compared to Source: Trade Partnership Worldwide, LLC from Census data. supplied just under half of U.S. im percent. What is notable about this group of countries is that they account for U.S. imports goes hand in hand with growth in U.S. exports. article began as follows: “A wary but tenacious middle class is fast becoming the majority in Mexico, in a profound demographic transformation that has far . Although many Mexicans and their neighbors to the north still imagine a country of downtrodden masses dominated by a wealthy elite, the swelling ranks of the middle Marts, driving Nissan sedans and maxing out their Banamex The members of this new class are not worried about getting enough to eat. They’re worried that their kids eat too much.” William Booth and Nick Miroff, “In Mexico, a Middle Majority,” drop in share in 2001 for middle income countries is due large to the reclassification of Korea Oil Goods <strong>Imports</strong> by Income Groups, 2012 Average 2010 Per Capita fines “high income” countries as those with gross national income (GNI) per capita of $12,476 or more in 2011; “middle income” countries are those with a GNI per capita of $1,026 to $12,475, *** 34 countries or territories could not be included in this table because World Bank GNI per capita data are not available for them. However, as a group they represent just 0.04 percent of total U.S. imports, so Sources: Trade Partnership Worldwide, LLC, from World Bank, “Gross national income per capita 2011, http://databank.worldbank.org/databank/download/GNIPC.pdf; GNI data for Middle Income Countries’ Shares of Total U.S. Exports Compared to High Income Countries’ Shares, 1996 Source: Trade Partnership Worldwide, LLC from Census data. supplied just under half of U.S. im countries is that they account for U.S. imports goes hand in hand with growth in U.S. exports. article began as follows: “A wary but tenacious middle class is fast becoming the majority in Mexico, in a profound demographic transformation that has far . Although many Mexicans and their neighbors to the north still imagine a country of downtrodden masses dominated by a wealthy elite, the swelling ranks of the middle Marts, driving Nissan sedans and maxing out their Banamex The members of this new class are not worried about getting enough to eat. They’re worried that their kids eat too much.” William Booth and Nick Miroff, “In Mexico, a Middle Majority,” drop in share in 2001 for middle income countries is due large to the reclassification of Korea Oil Goods <strong>Imports</strong> by Income Groups, 2012 Share of fines “high income” countries as those with gross national income (GNI) per capita of $12,476 or more in 2011; “middle income” countries are those with a GNI per capita of $1,026 to $12,475, *** 34 countries or territories could not be included in this table because World Bank GNI per capita data are not available for them. However, as a group they represent just 0.04 percent of total U.S. imports, so Sources: Trade Partnership Worldwide, LLC, from World Bank, “Gross national income per capita 2011, ; GNI data for Middle Income Countries’ Shares of Total U.S. Exports Compared to High Income Countries’ Shares, 1996 Source: Trade Partnership Worldwide, LLC from Census data. supplied just under half of U.S. im countries is that they account for U.S. imports goes hand in hand with growth in U.S. exports. article began as follows: “A wary but tenacious middle class is fast becoming the majority in Mexico, in a profound demographic transformation that has far . Although many Mexicans and their neighbors to the north still imagine a country of downtrodden masses dominated by a wealthy elite, the swelling ranks of the middle Marts, driving Nissan sedans and maxing out their Banamex The members of this new class are not worried about getting enough to eat. They’re worried that their kids eat too much.” William Booth and Nick Miroff, “In Mexico, a Middle Majority,” drop in share in 2001 for middle income countries is due large to the reclassification of Korea Oil Goods <strong>Imports</strong> by Income Groups, 2012 Share of Total <strong>Imports</strong> 49.7% 49.7 100.0 fines “high income” countries as those with gross national income (GNI) per capita of $12,476 or more in 2011; “middle income” countries are those with a GNI per capita of $1,026 to $12,475, *** 34 countries or territories could not be included in this table because World Bank GNI per capita data are not available for them. However, as a group they represent just 0.04 percent of total U.S. imports, so Sources: Trade Partnership Worldwide, LLC, from World Bank, “Gross national income per capita 2011, ; GNI data for Middle Income Countries’ Shares of Total U.S. Exports Compared to High Income Countries’ Shares, 1996 Source: Trade Partnership Worldwide, LLC from Census data. supplied just under half of U.S. im countries is that they account for U.S. imports goes hand in hand with growth in U.S. exports. article began as follows: “A wary but tenacious middle class is fast becoming the majority in Mexico, in a profound demographic transformation that has far . Although many Mexicans and their neighbors to the north still imagine a country of downtrodden masses dominated by a wealthy elite, the swelling ranks of the middle Marts, driving Nissan sedans and maxing out their Banamex The members of this new class are not worried about getting enough to eat. They’re worried that their kids eat too much.” William Booth and Nick Miroff, “In Mexico, a Middle Majority,” drop in share in 2001 for middle income countries is due large to the reclassification of Korea Share of Total <strong>Imports</strong> 49.7% 49.7 0.6 100.0 fines “high income” countries as those with gross national income (GNI) per capita of $12,476 or more in 2011; “middle income” countries are those with a GNI per capita of $1,026 to $12,475, *** 34 countries or territories could not be included in this table because World Bank GNI per capita data are not available for them. However, as a group they represent just 0.04 percent of total U.S. imports, so Sources: Trade Partnership Worldwide, LLC, from World Bank, “Gross national income per capita 2011, ; GNI data for Middle Income Countries’ Shares of Total U.S. Exports Compared to High Income Countries’ Shares, 1996 Source: Trade Partnership Worldwide, LLC from Census data. supplied just under half of U.S. im countries is that they account for article began as follows: “A wary but tenacious middle class is fast becoming the majority in Mexico, in a profound demographic transformation that has far . Although many Mexicans and their neighbors to the north still imagine a country of downtrodden masses dominated by a wealthy elite, the swelling ranks of the middle Marts, driving Nissan sedans and maxing out their Banamex The members of this new class are not worried about getting enough to eat. They’re worried that their kids eat too much.” William Booth and Nick Miroff, “In Mexico, a Middle Majority,” drop in share in 2001 for middle income countries is due large to the reclassification of Korea Share of <strong>Imports</strong> 49.7% 49.7 0.6 100.0 fines “high income” countries as those with gross national income (GNI) per capita of $12,476 or more in 2011; “middle income” countries are those with a GNI per capita of $1,026 to $12,475, *** 34 countries or territories could not be included in this table because World Bank GNI per capita data are not available for them. However, as a group they represent just 0.04 percent of total U.S. imports, so Sources: Trade Partnership Worldwide, LLC, from World Bank, “Gross national income per capita 2011, Middle Income Countries’ Shares of Total U.S. Exports Compared to High Income Countries’ Shares, 1996 Source: Trade Partnership Worldwide, LLC from Census data. High Income Countries Middle supplied just under half of U.S. im countries is that they account for article began as follows: “A wary but tenacious middle class is fast becoming the majority in Mexico, in a profound demographic transformation that has far . Although many Mexicans and their neighbors to the north still imagine a country of downtrodden masses dominated by a wealthy elite, the swelling ranks of the middle Marts, driving Nissan sedans and maxing out their Banamex The members of this new class are not worried about getting enough to eat. They’re worried that their kids eat too much.” William Booth and Nick Miroff, “In Mexico, a Middle Majority,” drop in share in 2001 for middle income countries is due large to the reclassification of Korea Chart 3 Middle Income Countries’ Shares of Total U.S. Exports Compared to High Income Countries’ Shares, 1996 Source: Trade Partnership Worldwide, LLC from Census data. High Income Countries Middle Income Countries Middle countries are also important suppliers of goods to the U.S. market group Mexico machinery and equipment, including computers and monitors) and China (electrical machinery and equipment, supplied just under half of U.S. im countries is that they account for article began as follows: “A wary but tenacious middle class is fast becoming the majority in Mexico, in a profound demographic transformation that has far . Although many Mexicans and their neighbors to the north still imagine a country of downtrodden masses dominated by a wealthy elite, the swelling ranks of the middle Marts, driving Nissan sedans and maxing out their Banamex The members of this new class are not worried about getting enough to eat. They’re worried that their kids eat too much.” William Booth and Nick Miroff, “In Mexico, a Middle Majority,” The Washington Post drop in share in 2001 for middle income countries is due large to the reclassification of Korea Chart 3 Middle Income Countries’ Shares of Total U.S. Exports Compared to High Income Countries’ Shares, 1996 Source: Trade Partnership Worldwide, LLC from Census data. High Income Countries Income Countries Middle countries are also important suppliers of goods to the U.S. market group Mexico machinery and equipment, including computers and monitors) and China (electrical machinery and equipment, supplied just under half of U.S. im countries is that they account for article began as follows: “A wary but tenacious middle class is fast becoming the majority in Mexico, in a profound demographic transformation that has far . Although many Mexicans and their neighbors to the north still imagine a country of downtrodden masses dominated by a wealthy elite, the swelling ranks of the middle Marts, driving Nissan sedans and maxing out their Banamex The members of this new class are not worried about getting enough to eat. They’re worried that their kids The Washington Post drop in share in 2001 for middle income countries is due large to the reclassification of Korea Chart 3 Middle Income Countries’ Shares of Total U.S. Exports Compared to High Income Countries’ Shares, 1996 Source: Trade Partnership Worldwide, LLC from Census data. High Income Countries Income Countries Middle-income countries are also important suppliers of goods to the U.S. market (Table 2 group — Mexico 8 (electrical machinery and equipment, including computers and monitors) and China (electrical machinery and equipment, supplied just under half of U.S. imports in 2012 countries is that they account for article began as follows: “A wary but tenacious middle class is fast becoming the majority in Mexico, in a profound demographic transformation that has far . Although many Mexicans and their neighbors to the north still imagine a country of downtrodden masses dominated by a wealthy elite, the swelling ranks of the middle Marts, driving Nissan sedans and maxing out their Banamex The members of this new class are not worried about getting enough to eat. They’re worried that their kids The Washington Post drop in share in 2001 for middle income countries is due large to the reclassification of Korea Middle Income Countries’ Shares of Total U.S. Exports Compared to High Income Countries’ Shares, 1996 High Income Countries Income Countries income countries are also important suppliers of goods to the U.S. Table 2 primarily (electrical machinery and equipment, including computers and monitors) and China (electrical machinery and equipment, ports in 2012 countries is that they account for article began as follows: “A wary but tenacious middle class is fast becoming the majority in Mexico, in a profound demographic transformation that has far-reaching . Although many Mexicans and their neighbors to the north still imagine a country of downtrodden masses dominated by a wealthy elite, the swelling ranks of the middle Marts, driving Nissan sedans and maxing out their Banamex The members of this new class are not worried about getting enough to eat. They’re worried that their kids The Washington Post drop in share in 2001 for middle income countries is due large to the reclassification of Korea Middle Income Countries’ Shares of Total U.S. Exports Compared to High Income Countries’ Shares, 1996 High Income Countries Income Countries income countries are also important suppliers of goods to the U.S. Table 2 primarily (electrical machinery and equipment, including computers and monitors) and China (electrical machinery and equipment, ports in 2012 countries is that they account for a article began as follows: “A wary but tenacious middle class is fast reaching . Although many Mexicans and their neighbors to the north still imagine a country of downtrodden masses dominated by a wealthy elite, the swelling ranks of the middle Marts, driving Nissan sedans and maxing out their Banamex The members of this new class are not worried about getting enough to eat. They’re worried that their kids The Washington Post drop in share in 2001 for middle income countries is due large to the reclassification of Korea Middle Income Countries’ Shares of Total U.S. Exports Compared to High Income Countries’ Shares, 1996 High Income Countries Income Countries countries are also important suppliers of goods to the U.S. Table 2). This primarily (electrical equipment, including monitors) and China (electrical machinery and equipment, ports in 2012 a article began as follows: “A wary but tenacious middle class is fast reaching . Although many Mexicans and their neighbors to the north still imagine a country of downtrodden masses dominated by a wealthy elite, the swelling ranks of the middle Marts, driving Nissan sedans and maxing out their Banamex credit cards. The members of this new class are not worried about getting enough to eat. They’re worried that their kids The Washington Post drop in share in 2001 for middle income countries is due large to the reclassification of Korea Middle Income Countries’ Shares of Total U.S. Exports Compared to High Income Countries’ Shares, 1996-201 important suppliers of . This (electrical equipment, including monitors) and China (electrical machinery ports in 2012, article began as follows: “A wary but tenacious middle class is fast reaching . Although many Mexicans and their neighbors to the north still imagine a country of downtrodden masses dominated by a wealthy elite, the swelling ranks of the middle credit cards. The members of this new class are not worried about getting enough to eat. They’re worried that their kids The Washington Post, March drop in share in 2001 for middle income countries is due large to the reclassification of Korea Middle Income Countries’ Shares of Total U.S. Exports Compared to 2012 important suppliers of . This article began as follows: “A wary but tenacious middle class is fast . Although many Mexicans and their neighbors to the north still imagine a country of downtrodden masses dominated by a wealthy elite, the swelling ranks of the middle credit cards. The members of this new class are not worried about getting enough to eat. They’re worried that their kids , March drop in share in 2001 for middle income countries is due large to the reclassification of Korea Middle Income Countries’ Shares of Total U.S. Exports Compared to 2 article began as follows: “A wary but tenacious middle class is fast . Although many Mexicans and their neighbors to the north still imagine a country of downtrodden masses dominated by a wealthy elite, the swelling ranks of the middle credit cards. The members of this new class are not worried about getting enough to eat. They’re worried that their kids , March drop in share in 2001 for middle income countries is due large to the reclassification of Korea Middle Income Countries’ Shares of Total U.S. Exports Compared to . Although many Mexicans and their neighbors to the north still imagine a country of downtrodden masses dominated by a wealthy elite, the swelling ranks of the middle credit cards. The members of this new class are not worried about getting enough to eat. They’re worried that their kids , March drop in share in 2001 for middle income countries is due large to the reclassification of Korea Middle Income Countries’ Shares of Total U.S. Exports Compared to Middle Income Countries’ Shares of Total U.S. Exports Compared to Middle Income Countries’ Shares of Total U.S. Exports Compared to