Classification and fingerprinting of kiwi and ... - bashanfoundation
Classification and fingerprinting of kiwi and ... - bashanfoundation
Classification and fingerprinting of kiwi and ... - bashanfoundation

You also want an ePaper? Increase the reach of your titles
YUMPU automatically turns print PDFs into web optimized ePapers that Google loves.
Analytical Methods<br />
<strong>Classification</strong> <strong>and</strong> <strong>fingerprinting</strong> <strong>of</strong> <strong>kiwi</strong> <strong>and</strong> pomelo fruits by multivariate<br />
analysis <strong>of</strong> chromatographic <strong>and</strong> spectroscopic data<br />
Costel Sârbu a,⇑ , Rodica Domnica Nasßcu-Briciu a , Agata Kot-Wasik b , Shela Gorinstein c , Andrzej Wasik b ,<br />
Jacek Namies´nik b<br />
a Babesß-Bolyai University, Faculty <strong>of</strong> Chemistry <strong>and</strong> Chemical Engineering, Arany Janos Str. No. 11, RO-400028 Cluj-Napoca, Romania<br />
b Gdańsk University <strong>of</strong> Technology, Chemical Faculty, Narutowicza Str. No. 11/12, 80-952 Gdańsk, Pol<strong>and</strong><br />
c The Hebrew University, School <strong>of</strong> Pharmacy, P.O. Box 12065, Jerusalem 91120, Israel<br />
article info<br />
Article history:<br />
Received 1 September 2010<br />
Received in revised form 5 May 2011<br />
Accepted 31 July 2011<br />
Available online 5 August 2011<br />
Keywords:<br />
Fingerprinting<br />
HPLC<br />
UV–Vis spectroscopy<br />
CA<br />
PCA<br />
Discriminant analysis<br />
1. Introduction<br />
abstract<br />
Nowadays, the main world wide tendency is the consumption<br />
<strong>of</strong> natural occurring products, such as vegetables <strong>and</strong> fruits. Some<br />
<strong>of</strong> the most consumed fruits are <strong>kiwi</strong>fruit <strong>and</strong> pomelo, known also<br />
as Chinese grapefruit. None <strong>of</strong> these fruits have been intensively<br />
analysed to elucidate their chemical composition. The most known<br />
<strong>kiwi</strong>fruits belong to Actinidia deliciosa species, from the Actinidia<br />
genus, Actinidiaceae family. The fruit flash colours are usually<br />
green, but there are known some red, purple, yellow <strong>and</strong> orange<br />
species (Ferguson, 1990). It has been shown that <strong>kiwi</strong>fruit is not<br />
only tasty but it is also rich in vitamin C, catechins <strong>and</strong> polyphenolic<br />
acids (Imeh & Khokhar, 2002; Mattila, Hellström, & Törrönen,<br />
2006). Recently studies have reported the identification <strong>and</strong> characterisation<br />
<strong>of</strong> a new tocopherol analogue (tocomonoenol) in the<br />
<strong>kiwi</strong>fruit. Data about this compound antioxidant capacity allows<br />
to evaluate its involvement in the total antioxidant activity generally<br />
attributed to <strong>kiwi</strong>fruits (Fiorentino, Mastellone et al., 2009). On<br />
the other side pomelo (Citrus maxima <strong>of</strong> Citrus gr<strong>and</strong>is; Citrus genus,<br />
Rutaceae family) is a Southeast Asia fruit with white, pink or red<br />
flash. Pomelo fruit is characterised by significant amount <strong>of</strong> vitamin<br />
C <strong>and</strong> flavonoids, especially naringine <strong>and</strong> neohesperidin<br />
⇑ Corresponding author. Tel.: +40 264 593833; fax: +40 264 590818.<br />
E-mail address: csarbu@chem.ubbcluj.ro (C. Sârbu).<br />
0308-8146/$ - see front matter Ó 2011 Elsevier Ltd. All rights reserved.<br />
doi:10.1016/j.foodchem.2011.07.120<br />
Food Chemistry 130 (2012) 994–1002<br />
Contents lists available at SciVerse ScienceDirect<br />
Food Chemistry<br />
journal homepage: www.elsevier.com/locate/foodchem<br />
The <strong>fingerprinting</strong> capacity <strong>of</strong> two analytical techniques, HPLC <strong>and</strong> UV–Vis spectroscopy in the case <strong>of</strong><br />
fruits samples (<strong>kiwi</strong> <strong>and</strong> pomelo) has been investigated. The multivariate exploratory techniques were<br />
used for sample discrimination according to the fruit species <strong>and</strong> subspecies. The combination <strong>of</strong> principal<br />
component analysis with linear discriminant analysis is opening new directions in the <strong>fingerprinting</strong><br />
analysis. The classifications obtained were independent by the analytical techniques, which signalise that<br />
both <strong>of</strong> them may be successfully employed in the <strong>fingerprinting</strong> methodologies if they are combined<br />
with appropriate chemometric methods. One <strong>of</strong> the biggest advantages <strong>of</strong> the proposed chemometric<br />
method is the ability to discriminate different types <strong>and</strong> species <strong>and</strong> subspecies <strong>of</strong> fruits in just one analysis,<br />
which indicates that it is one <strong>of</strong> the simplest <strong>and</strong> less time consuming methods. It is strongly<br />
sustained by the good results obtained in the case <strong>of</strong> <strong>kiwi</strong> <strong>and</strong> pomelo fruit samples that were simultaneously<br />
analysed.<br />
Ó 2011 Elsevier Ltd. All rights reserved.<br />
(Franke, Custer, Arakaki, & Murphy, 2004). The polyphenols <strong>and</strong><br />
vitamin C, presented in both fruits, are well known for their benefic<br />
biological activity, mainly in the decrease risk <strong>of</strong> cancer <strong>and</strong> cardiovascular<br />
diseases (Fiorentino, D’Abrosca et al., 2009; Granado-Serrano<br />
et al., 2007). The level <strong>of</strong> chemicals <strong>and</strong> indirectly the resulted<br />
properties depends <strong>and</strong> varies in function <strong>of</strong> many important<br />
factors. The main differences appear between the different fruit<br />
species. However, the concentration <strong>of</strong> the chemical constituents<br />
can vary significantly depending on the growing conditions <strong>of</strong><br />
the plant (region, soil, temperature, humidity, meteorological conditions).<br />
Other significant influences are the geographical origins,<br />
cultivation <strong>and</strong> harvesting methods, post harvesting processing<br />
<strong>and</strong> fruits storage (Dumarey, van Nederkassel, Deconinck, & V<strong>and</strong>er<br />
Heyden, 2008). The wide complexity composition <strong>of</strong> plant<br />
materials makes the analysis <strong>of</strong> individual compound to not be<br />
useful or feasible, because it is very laborious <strong>and</strong> <strong>of</strong>ten unjustified<br />
expensive. The development <strong>of</strong> a suitable analytical procedure to<br />
separate <strong>and</strong> evaluate all constituents is practically impossible to<br />
realise. The natural synergic activity <strong>of</strong> compounds is well known<br />
<strong>and</strong> the fruits properties are a consequence <strong>of</strong> the entire chemical<br />
composition complexity. Considering this aspects, the global<br />
assessment <strong>of</strong> the fruits is recommended, instead <strong>of</strong> focusing on<br />
specific individual compounds. However, knowing the major<br />
constituents may sustain <strong>and</strong> in the same time may explain a specific<br />
classification or different fruit properties. Such a possibility is
<strong>of</strong>fered by the <strong>fingerprinting</strong> methods, which are comprehensive<br />
characterising the analysed sample (Ni, Lai, Br<strong>and</strong>es, & Kokot,<br />
2009). This method has as purpose the quality control <strong>of</strong> the vegetal<br />
material. It was firstly introduced for the characterisation <strong>of</strong><br />
the herbal medicines <strong>and</strong> extended to other types <strong>of</strong> vegetal materials.<br />
Even more, the fingerprint methodology is widely involved in<br />
the authenticity <strong>and</strong> origin control <strong>of</strong> fruits, herbs or derived products<br />
(Costas-Rodríguez, Lavilla, & Bendicho, 2010). The US Food<br />
<strong>and</strong> Drug Administration (2000) <strong>and</strong> the European Medicines<br />
Agency (2001) recommend that the appropriate <strong>fingerprinting</strong><br />
procedure involves chromatographic techniques. However, other<br />
techniques, such as the spectral ones may lead to interesting <strong>and</strong><br />
useful results.<br />
The chromatographic methods <strong>of</strong> <strong>fingerprinting</strong> are preferred<br />
for the sample characterisation since even at the first view it may<br />
<strong>of</strong>fer some screening information about the chemical composition<br />
<strong>of</strong> the samples (Gong, Liang, Fung, & Chau, 2004). The accepted<br />
chromatographic techniques are including thin layer chromatography<br />
(Ciésla, Bogucka-Kocka, Hajnos, Petruczynik, & Waksmundzka-<br />
Hajnos, 2008), high performance liquid chromatography (Zhai, Hu,<br />
Huang, & Chen, 2010), gas chromatography (Cardeal, de Souza,<br />
Gomes da Silva, & Marriott, 2008), highly speed counter current<br />
chromatography (Gu, Zhang, Su, Chen, & Ouyang, 2004) <strong>and</strong> so<br />
on. The chromatographic <strong>fingerprinting</strong> has also been intensively<br />
employed in the species authenticity <strong>and</strong> origins investigations.<br />
However, nearby chromatography other analytical techniques were<br />
indicated as being representative in the <strong>fingerprinting</strong> procedures.<br />
The spectroscopic techniques may <strong>of</strong>fer important information that<br />
may be used to identify the cultivation area <strong>and</strong> contaminated<br />
products (Ni, Zhang, Hou, Shi, & Guo, 2009). One <strong>of</strong> the most<br />
remarkable spectroscopic techniques is the nuclear magnetic resonance<br />
(NMR) spectroscopy, which is considered to be a powerful<br />
tool to determine metabolite <strong>fingerprinting</strong> <strong>and</strong>/or metabolic<br />
pr<strong>of</strong>iling <strong>of</strong> plant or animal extracts (Pereira et al., 2006; Taglienti,<br />
Massantini, Botondi, Mencarelli, & Valentini, 2009). Moreover, the<br />
FT-IR spectroscopy has been successfully used to classify the plant<br />
samples <strong>of</strong> different geographical areas (Wu et al., 2010; Yu, Sun,<br />
Fan, Zhou, & Noda, 2005), while the UV–Vis spectroscopy has not<br />
been intensively used because the obtained spectra are difficult to<br />
discriminate the samples, without the involvement <strong>of</strong> an adequate<br />
chemometric methodology (Casale, Oliveri, Armanino, Lanteri, &<br />
Forina, 2010), or the use <strong>of</strong> derivative spectroscopic analyses.<br />
A significant disadvantage <strong>of</strong> routine <strong>fingerprinting</strong> methods is<br />
the fact that they usually require a large number <strong>of</strong> experiments<br />
<strong>and</strong> interpretation procedure, which are <strong>of</strong>ten tedious <strong>and</strong> time<br />
consuming. An alternative may be <strong>of</strong>fered by an efficient simultaneous<br />
investigation <strong>of</strong> different types <strong>of</strong> samples. Focused on these<br />
considerations, the main goal <strong>of</strong> this study has been the development<br />
<strong>of</strong> a new simple <strong>and</strong> fast method for the simultaneous discrimination<br />
<strong>and</strong> authentication <strong>of</strong> various samples <strong>of</strong> fruits based<br />
on chemometric analysis <strong>of</strong> HPLC <strong>and</strong> UV–Vis spectroscopy data.<br />
The proposed method has been tested on four subspecies <strong>of</strong> <strong>kiwi</strong>fruit<br />
<strong>and</strong> three subspecies <strong>of</strong> pomelo fruit. It has been evidenced<br />
that the UV–Vis spectrometry may be also considered a competitive<br />
technique in the <strong>fingerprinting</strong> approaches. In addition, the methodology<br />
developed in this paper might be also extended in the<br />
authenticity <strong>and</strong> origin control <strong>of</strong> fruits, herbs or derived products.<br />
2. Experimental<br />
2.1. Fruits samples <strong>and</strong> extraction procedure<br />
All compounds <strong>and</strong> solvents were obtained from Merck (Darmstadt,<br />
Germany) in analytical degree purity. Water was purified by<br />
use <strong>of</strong> a Millipore Waters (Milford, MA, USA) Milli-Q system. All<br />
fruit cultivars that reached commercial maturity stage were<br />
C. Sârbu et al. / Food Chemistry 130 (2012) 994–1002 995<br />
harvested in an orchard located in Heanam County, Jeonnam Province,<br />
Korea in 2009. The fruits were stored in a cool <strong>and</strong> dry atmosphere<br />
till the sample preparation has been performed. Kiwifruit<br />
belong to some subspecies <strong>of</strong> Actinidia chinensis, namely: Hayward<br />
(HW), Haenam (HN), Bidan (BD) <strong>and</strong> Daeheung (DH), while pomelo<br />
fruit belong to some subspecies <strong>of</strong> C. maxima, named as follows:<br />
Kao Paen (KP), Thong Dee (TD) <strong>and</strong> Tha Knoi (TK).<br />
The fruits extraction pre-treatment consists in pealing <strong>and</strong> chopping<br />
<strong>of</strong> the fresh fruit flash, followed by their freezing at 80 °C for<br />
2 h. The frozen piece <strong>of</strong> fruits was lyophilised for 72 h at 0.2 Pa <strong>and</strong><br />
stored at 4 °C. Before extraction the lyophilised samples were powdered<br />
by means <strong>of</strong> a mortar <strong>and</strong> pestle. Recently, the ultrasound assisted<br />
extraction technique is one <strong>of</strong> the most used phytochemical<br />
compounds extraction because <strong>of</strong> its significant advantages expressed<br />
in terms <strong>of</strong> simplicity <strong>and</strong> extraction capacity; thereby it<br />
was used to extract the chemical compounds from the fruit matrices.<br />
The extraction conditions were typical for a large spectrum <strong>of</strong><br />
polyphenolic compounds extraction, such as flavonoids <strong>and</strong> polyphenolic<br />
acids. The extractions were performed in an Elmasonic<br />
S15H ultrasonic bath (Singen, Germany), with a frequency <strong>of</strong><br />
37 kHz <strong>and</strong> a power <strong>of</strong> 95 W. Each sample (2.5 g) was extracted<br />
for 30 min with 30 mL extraction solvent (ethanol: water, 70:30,<br />
v/v). The hydroalcoholic mixture will be able to extract mainly<br />
the polyphenols. Three parallel extractions were performed for<br />
each fruit subspecies. The obtained extracts were filtered through<br />
quantitative paper filters with grade <strong>of</strong> 40:8 lm (Whatman, GE<br />
Health, Germany) <strong>and</strong> rinsed trice with 5 mL <strong>of</strong> the extraction solvent.<br />
The filtrate was evaporated to dryness by using a rotary evaporator<br />
(Heidolph Laborota 4000 eco, Suarlee, Belgium) <strong>and</strong> the<br />
residuum has been diluted quantitatively with 10 mL <strong>of</strong> extraction<br />
solvent. The evaporation had as purpose the concentration <strong>of</strong> the<br />
fruit extract. Previously <strong>of</strong> the chromatography the extracts were<br />
filtered through nylon micr<strong>of</strong>ilters <strong>of</strong> 0.22 lm (Whatman, GE<br />
Health, Germany), <strong>and</strong> directly injected in the HPLC system.<br />
2.2. Chromatography<br />
The chromatography was performed on an Agilent 1100 Series LC<br />
(Agilent Technologies, Santa Clara, CA, USA) system consisting <strong>of</strong> a<br />
vacuum degassing unit, a binary pump, an autosampler injector, a<br />
column thermostat, <strong>and</strong> a diode array detector (DAD). The system<br />
has been directly connected to 1100 MSD mass spectrometer,<br />
equipped with an electrospray ion source <strong>and</strong> ion trap analyzer (Agilent<br />
Technologies, Santa Clara, CA, USA). The injection volume <strong>of</strong> the<br />
fruit extracts was 20 lL per sample. The chromatographic analyses<br />
were carried out on a LiChrosphere RP-18e column (250 4.6 mm,<br />
5 lm particle size). A binary gradient elution system composed <strong>of</strong><br />
0.1% solution <strong>of</strong> formic acid in water as solvent A <strong>and</strong> 0.1% solution<br />
<strong>of</strong> formic acid in acetonitrile: methanol (1:1; v/v) as solvent B was<br />
applied for the fingerprint analysis with gradient elution as follows:<br />
0.00 min, 15% B; 0.00–10.00 min, 15–22% B; 10.00–17.00 min, 22–<br />
27% B; 17.00–17.01 min, 27–40% B; 17.01–25.00 min, 40–50% B;<br />
25.00–30.00 min, 50% B. The separations were performed with a<br />
flow rate <strong>of</strong> 1 mL min 1 , which was directly injected in the ESI<br />
source, without any splitting. The column temperature has been<br />
maintained at 30 °C. The analysis time was <strong>of</strong> 30 min. The ESI mass<br />
spectrometer was set to run in negative SCAN mode with a capillary<br />
voltage <strong>of</strong> 4000 V <strong>and</strong> sample cone voltage <strong>of</strong> 70 V. The MS pseudoions<br />
range has been chosen between 50 <strong>and</strong> 2500 m/z. The HPLC–MS<br />
method was tested on 16 phytophenolic compounds (catechin,<br />
chlorogenic acid, 4-hydroxybenzoic acid, caffeic acid, o-coumaric<br />
acid, m-coumaric acid, p-coumaric acid, sinapic acid, rutin, naringin,<br />
quercetin, naringenin, kaempferol, apigein, phloretin <strong>and</strong> luteolin),<br />
in order to evaluate its separation capacity. All the st<strong>and</strong>ards were<br />
Sigma–Aldrich products quality. The polyphenols st<strong>and</strong>ard solutions<br />
(10 lgmL 1 ) were prepared in methanol.
996 C. Sârbu et al. / Food Chemistry 130 (2012) 994–1002<br />
2.3. UV–Vis Spectroscopy<br />
The UV–Vis absorbance spectra were recorded using a V-550<br />
Jasco spectrophotometer (ABL&E Jasco, Cluj-Napoca, Romania) on<br />
a wavelength range starting from 200 to 500 nm. Previously <strong>of</strong><br />
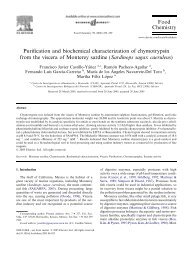
Fig. 1. The HPLC–MS chromatograms obtained for <strong>kiwi</strong>fruit (a) <strong>and</strong> pomelo fruit (b).<br />
spectroscopic investigation, all fruits extracts were 10 times diluted<br />
as follows: 1 mL <strong>of</strong> each fruit extract was introduced in a<br />
10 mL volumetric flask, which was then filled with methanol. The<br />
obtained mixture was homogenised under ultrasonic conditions<br />
for 10 min. All spectra were recorded with a resolution <strong>of</strong> 0.5 nm.
The obtained zero order spectra were normalised by using the following<br />
Eq.:<br />
y i ¼ xi xmin<br />
xmax xmin<br />
C. Sârbu et al. / Food Chemistry 130 (2012) 994–1002 997<br />
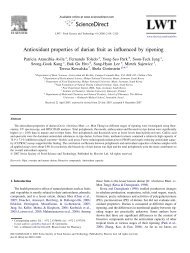
Fig. 2. The UV–Vis zero order (a, b), first order (c, d) <strong>and</strong> normalised (e, f) spectra <strong>of</strong> <strong>kiwi</strong>fruit <strong>and</strong> pomelo extracts.<br />
ð1Þ<br />
where y i represents the normalised value, x i is the initial absorbance<br />
value at given wavelength <strong>and</strong> xmax <strong>and</strong> xmin are coinciding to the<br />
maximum <strong>and</strong> minimum absorbance values for the zero order<br />
UV–Vis spectra. Moreover, the first order spectra have been computed<br />
according to the Savitzky–Golay algorithm (Savitzky & Golay,
998 C. Sârbu et al. / Food Chemistry 130 (2012) 994–1002<br />
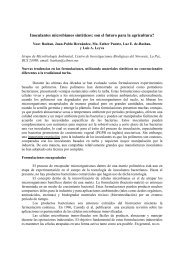
Fig. 3. Hierarchical clustering <strong>of</strong> <strong>kiwi</strong> <strong>and</strong> pomelo fruits using HPLC digitized chromatogram (a) <strong>and</strong> UV–Vis spectra data: (b) zero order spectra; (c) first order spectra; <strong>and</strong> (d)<br />
normalised zero order spectra.<br />
1964) included in the Spectra Analysis option <strong>of</strong> Jasco spectrophotometer<br />
s<strong>of</strong>tware.<br />
2.4. Chemometric methods<br />
Nowadays, many chemical problems are solved by the computational<br />
methods, especially those classified as multivariate exploratory<br />
techniques. While the computational methods were<br />
introduced in the <strong>fingerprinting</strong> methodology a new analytical level<br />
has been reached. In this order, the most used techniques are<br />
the principal component analysis (PCA), partial least squares<br />
(PLS), cluster analysis (CA), linear discriminant analysis (LDA),<br />
<strong>and</strong> so on (Chen et al. 2008; Xu et al. 2009). CA is a well-known<br />
<strong>and</strong> widely used unsupervised clustering procedure with its hierarchical<br />
<strong>and</strong> non-hierarchical approaches. CA is a multivariate analysis<br />
technique used to sort samples (in our case fruits extracts)<br />
into groups. The Ward’s method as the amalgamation rule <strong>and</strong><br />
the squared Euclidean distance as metric were used to establish<br />
clusters. PCA is the most preferred multivariate technique because<br />
it is considered a sophisticated technique that is reducing the<br />
dimensionality <strong>of</strong> the original dataset by explaining the correlation<br />
amongst a large number <strong>of</strong> variables (digitized chromatograms <strong>and</strong><br />
spectra) in terms <strong>of</strong> a smaller number <strong>of</strong> underlying factors<br />
(principal components or PCs) without losing much information<br />
(Kong, Zhao, Xiao, Jin, & Li, 2009). The PCs are a very useful tool<br />
for examining the relationships between objects, looking for<br />
groups <strong>and</strong> trends, sorting out outliers. The PCA <strong>and</strong> CA are unsupervised<br />
techniques which <strong>of</strong>fer useful information about samples<br />
by graphical representation as 2D <strong>and</strong> 3D patterns or as a dendrogram,<br />
but sometimes when the similarities are very prominent<br />
they are not enough for a highly sustained conclusion. On the other<br />
side, the LDA is a supervised classification technique based on the<br />
linear discriminant functions, which maximises the ratio <strong>of</strong><br />
between-class variance <strong>and</strong> minimises the ratio <strong>of</strong> within-class<br />
variance. LDA selects directions, which accomplish maximum separation<br />
among the given classes. The Euclidean distance is used in<br />
the LDA algorithms in order to classify unknown samples <strong>and</strong> the<br />
stepwise algorithm to extract the most important variables (Motß,<br />
Soponar, & Sârbu, 2010; Ni, Peng, & Kokot, 2008; Xiang et al.,<br />
2010). It is also possible to visualise how the functions discriminate<br />
between groups by plotting the individual scores for the<br />
discriminant functions. In addition, the combination <strong>of</strong> the PCA<br />
<strong>and</strong> LDA may <strong>of</strong>fer some remarkable information for classification<br />
<strong>and</strong> discrimination <strong>of</strong> the considered samples. The chemometric<br />
analysis has been performed by using Statistica 7.1 s<strong>of</strong>tware (Stat-<br />
S<strong>of</strong>t, Inc., Tulsa, USA).
3. Results <strong>and</strong> discussion<br />
The HPLC fingerprints are very difficult to be efficiently analysed<br />
by a simple visual screening. By carefully examination <strong>of</strong><br />
the HPLC–MS chromatograms (Fig. 1) <strong>and</strong> the UV–Vis spectra<br />
(Fig. 2) corresponding to <strong>kiwi</strong> <strong>and</strong> pomelo subspecies, there may<br />
be appreciated that they presents some significant differences.<br />
Three <strong>of</strong> the <strong>kiwi</strong>fruits are recommended by the chromatograms<br />
(HW, HN <strong>and</strong> DH) to be highly similar, while the <strong>kiwi</strong>fruit extracts<br />
UV–Vis spectra indicated that the HN species has a chemical<br />
composition a bit different by the HW <strong>and</strong> DH. The BD <strong>kiwi</strong>fruit<br />
has been remarked as being different by the rest <strong>of</strong> the <strong>kiwi</strong>fruit<br />
subspecies. On the other side, for pomelo fruits both the chromatograms<br />
<strong>and</strong> the spectra are suggesting that the TD <strong>and</strong> TK are<br />
presenting high similarity, while the KP is a bit different. The <strong>kiwi</strong>fruit<br />
chromatograms are indicating that the first 10 min are differentiating<br />
the samples, while those corresponding to pomelo fruits<br />
are leading to more significant differences between 10 <strong>and</strong> 20 min.<br />
According to the phytochemical st<strong>and</strong>ards separation there may be<br />
C. Sârbu et al. / Food Chemistry 130 (2012) 994–1002 999<br />
Fig. 4. PC1–PC2 score plot: (a) HPLC–MS chromatogram; (b) zero order spectra; (c) first order spectra; <strong>and</strong> (d) normalised zero order spectra.<br />
appreciated that in the first 10 min the most polar compounds are<br />
eluted, such as catechins <strong>and</strong> small molecule phenolic acids<br />
(4-hydroxybenzoic acid, chlorogenic acid <strong>and</strong> caffeic acid), while<br />
between 10 <strong>and</strong> 20 min the intermediary polarity compounds<br />
should be observed, like phenolic acids (o-, m-, p-coumaric acids<br />
<strong>and</strong> sinapic acid) <strong>and</strong> glycosylated flavonoids (rutin <strong>and</strong> naringin).<br />
However, after 20 min the flavonoids aglicons could be detected<br />
(quercetin, kaempferol, luteolin, naringenin <strong>and</strong> phloretin). All<br />
these observations are leading to the conclusion that the <strong>kiwi</strong>fruits<br />
are discriminated by very polar phenolic compounds, while the<br />
glycosylated flavonoids are influencing the pomelo fruit characteristics.<br />
The use <strong>of</strong> parallel sample analysis is strongly sustaining the<br />
above presented considerations.<br />
The UV–Vis spectra were showing that the most specific UV<br />
range is mainly between 200 <strong>and</strong> 350 nm. The <strong>kiwi</strong>fruit extracts<br />
exhibit the maximum absorption between 210 <strong>and</strong> 220 nm, but<br />
the spectra were quite simple, while the pomelo spectra were<br />
more specific, presenting two absorption maxima around 280<br />
<strong>and</strong> 320 nm. However, the (dis-)similarity level <strong>of</strong> the analysed
1000 C. Sârbu et al. / Food Chemistry 130 (2012) 994–1002<br />
Table 1<br />
<strong>Classification</strong> matrix <strong>of</strong> <strong>kiwi</strong> <strong>and</strong> pomelo fruits (21 samples) using scores corresponding to the first 14 principal components.<br />
Data Group Correct classification (%) Observed classification<br />
G1 G2 G3 G4 G5 G6 G7<br />
Chromatograms BG 100 3 0 0 0 0 0 0<br />
DH 100 0 3 0 0 0 0 0<br />
HN 100 0 0 3 0 0 0 0<br />
HW 100 0 0 0 3 0 0 0<br />
KP 100 0 0 0 0 3 0 0<br />
TD 100 0 0 0 0 0 3 0<br />
TK 100 0 0 0 0 0 0 3<br />
Total 100 3 3 3 3 3 3 3<br />
Zero order spectra BG 100 3 0 0 0 0 0 0<br />
DH 100 0 3 0 0 0 0 0<br />
HN 100 0 0 3 0 0 0 0<br />
HW 100 0 0 0 3 0 0 0<br />
KP 100 0 0 0 0 3 0 0<br />
TD 100 0 0 0 0 0 3 0<br />
TK 100 0 0 0 0 0 0 3<br />
Total 100 3 3 3 3 3 3 3<br />
First order spectra BG 100 3 0 0 0 0 0 0<br />
DH 100 0 3 0 0 0 0 0<br />
HN 100 0 0 3 0 0 0 0<br />
HW 100 0 0 0 3 0 0 0<br />
KP 100 0 0 0 0 3 0 0<br />
TD 100 0 0 0 0 0 3 0<br />
TK 100 0 0 0 0 0 0 3<br />
Total 100 3 3 3 3 3 3 3<br />
Normalised zero order spectra BG 100 3 0 0 0 0 0 0<br />
DH 100 0 3 0 0 0 0 0<br />
HN 100 0 0 3 0 0 0 0<br />
HW 100 0 0 0 3 0 0 0<br />
KP 100 0 0 0 0 3 0 0<br />
TD 100 0 0 0 0 0 3 0<br />
TK 100 0 0 0 0 0 0 3<br />
Total 100 3 3 3 3 3 3 3<br />
fruits is impossible to be comprehended by a simple visual<br />
screening.<br />
The dendrograms (Fig. 3) obtained by applying the CA on the<br />
digitized chromatogram (21 samples 1775 variables), <strong>and</strong> UV–<br />
Vis spectra (21 samples 601 variables) <strong>of</strong>fer some more information<br />
about the (dis)similarities observed between the analysed<br />
samples. The Ward’s method used for cluster building is regarded<br />
as being one <strong>of</strong> the most efficient rules <strong>of</strong> amalgamation, because<br />
it uses an analysis <strong>of</strong> variance approach to evaluate the distance<br />
between clusters. The procedure is more efficient when the<br />
distance between clusters is computed by squared Euclidean<br />
method, which is not affected by the addition <strong>of</strong> new objects to<br />
the analysis or by outliers. In our particular case, by studying<br />
Fig. 3a <strong>and</strong> c is easy to observe that, according to CA, the chromatograms<br />
<strong>and</strong> first order spectra <strong>of</strong>fer the most significant classifications<br />
since the fruit samples are associated according to the fruit<br />
species reality. Once again the HW <strong>and</strong> DH <strong>kiwi</strong>fruit are highly<br />
resembled, while the BD is more different by the rest <strong>of</strong> <strong>kiwi</strong>s.<br />
On the other side, the fruit samples (12 <strong>kiwi</strong> subspecies <strong>and</strong> nine<br />
pomelo subspecies) are more weakly classified by the CA applied<br />
on the zero order spectra (Fig. 3b) <strong>and</strong> normalised zero order spectra<br />
(Fig. 3d), which are mixing the fruit types <strong>and</strong> the obtained<br />
classifications are inconclusive. However the similarities <strong>and</strong><br />
differences indicated by the CA applied on the chromatograms<br />
<strong>and</strong> first order spectra are a direct consequence <strong>of</strong> the high level<br />
<strong>of</strong> resemblance existed between HN–DH–HW <strong>kiwi</strong>fruits subspecies<br />
<strong>and</strong> TD–TK pomelo subspecies.<br />
By applying PCA on the digitized chromatograms <strong>and</strong> spectra<br />
some new information about the fruits origin, similarity <strong>and</strong> differences<br />
may be obtained. The projected dots <strong>of</strong> the chromatograms<br />
<strong>and</strong> spectra were localised in a confined cluster in the 2D-projection<br />
plot <strong>of</strong> PCA (Fig. 4). The observation indicates that both analytical<br />
results are correctly associating the samples according to fruits<br />
species. In all cases the first 20 PCs explain the total variance<br />
(100%) <strong>of</strong> the data. The variance corresponding to the PC1 are<br />
accounting more that 75% in the case <strong>of</strong> the HPLC chromatograms<br />
<strong>and</strong> around 87% <strong>and</strong> 41% for zero <strong>and</strong> first order UV/Vis spectra.<br />
The low value in the case <strong>of</strong> first order spectra might be explained<br />
by two main directions <strong>of</strong> variation in the spectra data as a result <strong>of</strong><br />
the first derivative. The PC1 <strong>of</strong> normalised spectra takes 84% from<br />
the variance <strong>of</strong> raw data. The first two PCs obtained on the<br />
chromatographic data accounts more than 84%, while the two<br />
PCs corresponding to zero <strong>and</strong> first order spectra take 98% <strong>and</strong><br />
81%, respectively. Finally, the normalised spectra 97% refunded in<br />
the first two PCs. The obtained PCA patterns gave an illustrative<br />
<strong>and</strong> elegant suggestion about the CA results. For example, the<br />
PC1–PC2 score plot corresponding to the chromatograms<br />
(Fig. 4a), zero order spectra <strong>and</strong> normalised zero order spectra<br />
(Fig. 4b <strong>and</strong> d) illustrate the HW–DH <strong>and</strong> TK–TD almost as single<br />
groups, while the first order spectra (Fig. 4c) are mixing the <strong>kiwi</strong>fruit<br />
subspecies, but the fruit species may still be distinguish.<br />
However, the BD subspecies <strong>of</strong> <strong>kiwi</strong> can be remarked as being<br />
totally different by the other <strong>kiwi</strong>s.<br />
Even if the involved methods seem to be very efficient in the<br />
simultaneous evaluation <strong>of</strong> different types <strong>of</strong> fruit, there are some<br />
problems when the fruit subspecies are highly similar from<br />
chemical composition point <strong>of</strong> view. The previous obtained results<br />
are highly descriptive, but they are not always sufficient <strong>of</strong> a<br />
beyond doubt classification <strong>of</strong> the <strong>kiwi</strong>s or pomelo subspecies.<br />
The combination <strong>of</strong> PCA with LDA leaded to the most efficient discrimination<br />
<strong>of</strong> the investigated groups <strong>of</strong> fruit. The results obtained<br />
by applying LDA to the first 14 principal components (Table 1)<br />
indicate a total separation <strong>of</strong> samples (100%) within seven groups,<br />
in a good agreement with their nature (species <strong>and</strong> subspecies) <strong>and</strong><br />
origin (cultivar), <strong>and</strong> independently <strong>of</strong> the analytical technique.<br />
These statements are supported <strong>and</strong> well illustrated in the Root
1–Root 2 score plots (Fig. 5), which clearly indicate that the chromatography<br />
(Fig. 5a) is more efficient in the fruits sample classification,<br />
since all fruit subspecies <strong>and</strong> species are very substantially<br />
separated, without any overlapping. Moreover, the UV–Vis spectroscopy<br />
is also correctly classifying the investigated samples,<br />
but in all cases the <strong>kiwi</strong> DH <strong>and</strong> HW subspecies are very close.<br />
However, comparing all spectra taken into consideration is easy<br />
to appreciate that the zero order spectra (Fig. 5b) are the most<br />
efficient in the PCA–LDA analysis. Even more, the first order spectra<br />
(Fig. 5c) are grouping the pomelo KP <strong>and</strong> TD groups very close,<br />
while the normalised zero order spectra (Fig. 5d) are leading to a<br />
total overlapping <strong>of</strong> TK <strong>and</strong> TD groups. All the above presented<br />
analyses are indicating that the combination <strong>of</strong> PCA with LDA will<br />
lead to more powerful classification <strong>and</strong> discrimination <strong>of</strong> vegetal<br />
samples, firstly according to their species <strong>and</strong> secondly taking into<br />
consideration the subspecies variance. Furthermore, this type <strong>of</strong><br />
analyses may open new pathways in the <strong>fingerprinting</strong> procedures.<br />
The UV–Vis spectroscopy leaded to HPLC comparable results,<br />
which is a strong argument for employing it in other investigations.<br />
Another aspect that must be considered is the fact that the<br />
UV–Vis method is simpler <strong>and</strong> less expensive, so it may be viewed<br />
as a competitive <strong>and</strong> friendly technique in the fingerprint analyses.<br />
C. Sârbu et al. / Food Chemistry 130 (2012) 994–1002 1001<br />
Fig. 5. Root 1–Root 2 canonical score plot: (a) digitized chromatogram; (b) zero order spectra; (c) first order spectra; <strong>and</strong> (d) normalised zero order spectra.<br />
The methodology developed in this paper might be also extended<br />
in the authenticity <strong>and</strong> origin control <strong>of</strong> fruits, herbs or derived<br />
products.<br />
4. Conclusions<br />
A simultaneous <strong>fingerprinting</strong> analysis <strong>of</strong> some <strong>kiwi</strong> <strong>and</strong> pomelo<br />
fruits has been performed by employing the HPLC <strong>and</strong><br />
UV–Vis spectroscopy. The analysis <strong>of</strong> the data has been performed<br />
by multivariate exploratory techniques, such as cluster analysis,<br />
principal component analysis, <strong>and</strong> linear discriminant analysis<br />
applied on the scores corresponding to the first principal components.<br />
Four subspecies <strong>of</strong> <strong>kiwi</strong> <strong>and</strong> three <strong>of</strong> pomelo were analysed<br />
in order to investigate the most efficient technique <strong>of</strong> simultaneous<br />
discrimination. The employed chemometric methods <strong>of</strong>fer sustainable<br />
results, but the most powerful seems to be the combination <strong>of</strong><br />
PCA with LDA. The digitized chromatograms leaded to a better<br />
classification <strong>and</strong> discrimination <strong>of</strong> the fruits samples than the<br />
UV–Vis spectra, but the zero order spectra leaded to very competitive<br />
results. All results have indicated that the BD <strong>kiwi</strong> subspecies<br />
is the most different one, while DH <strong>and</strong> HW present high similarities.<br />
The TK <strong>and</strong> TD subspecies <strong>of</strong> pomelo are majorly related.
1002 C. Sârbu et al. / Food Chemistry 130 (2012) 994–1002<br />
References<br />
Cardeal, Z. L., de Souza, P. P., Gomes da Silva, M. D. R., & Marriott, P. J. (2008).<br />
Comprehensive two-dimensional gas chromatography for fingerprint pattern<br />
recognition in cachaça production. Talanta, 74, 793–799.<br />
Casale, M., Oliveri, P., Armanino, C., Lanteri, S., & Forina, M. (2010). NIR <strong>and</strong> UV–vis<br />
spectroscopy, artificial nose <strong>and</strong> tongue: Comparison <strong>of</strong> four <strong>fingerprinting</strong><br />
techniques for the characterisation <strong>of</strong> Italian red wines. Analytica Chimica Acta,<br />
668, 143–148.<br />
Chen, Y., Zhu, S.-B., Xie, M.-Y., Nie, S.-P., Liu, W., Li, C., et al. (2008). Quality control<br />
<strong>and</strong> original discrimination <strong>of</strong> Ganoderma lucidum based on high-performance<br />
liquid chromatographic fingerprints <strong>and</strong> combined chemometrics methods.<br />
Analytica Chimica Acta, 623, 146–156.<br />
Ciésla, Ł., Bogucka-Kocka, A., Hajnos, M., Petruczynik, A., & Waksmundzka-Hajnos,<br />
M. (2008). Two-dimensional thin-layer chromatography with adsorbent<br />
gradient as a method <strong>of</strong> chromatographic <strong>fingerprinting</strong> <strong>of</strong> furanocoumarins<br />
for distinguishing selected varieties <strong>and</strong> forms <strong>of</strong> Heracleum spp.. Journal <strong>of</strong><br />
Chromatography A, 1207, 160–168.<br />
Costas-Rodríguez, M., Lavilla, I., & Bendicho, C. (2010). <strong>Classification</strong> <strong>of</strong> cultivated<br />
mussels from Galicia (Northwest Spain) with European protected designation <strong>of</strong><br />
origin using trace element fingerprint <strong>and</strong> chemometric analysis. Analytica<br />
Chimica Acta, 664, 121–128.<br />
Dumarey, M., van Nederkassel, A. M., Deconinck, E., & V<strong>and</strong>er Heyden, Y. (2008).<br />
Exploration <strong>of</strong> linear multivariate calibration techniques to predict the total<br />
antioxidant capacity <strong>of</strong> green tea from chromatographic fingerprints. Journal <strong>of</strong><br />
Chromatography A, 1192, 81–88.<br />
European Medicines Agency, note for guidance on quality, <strong>of</strong> herbal medicinal<br />
products, London, 2001, pp. 6. www.tga.gov.au/docs/pdf/euguide/qwp/<br />
281900en01.pdf, Accessed 01.09.10.<br />
Ferguson, A. R. (1990). Kiwifruit (actinidia). Acta Horticulturae, 290, 603–653.<br />
Fiorentino, A., D’Abrosca, B., Pacifico, S., Mastellone, C., Scognamiglio, M., & Monaco,<br />
P. (2009). Identification <strong>and</strong> assessment <strong>of</strong> antioxidant capacity <strong>of</strong><br />
phytochemicals from <strong>kiwi</strong> fruits. Journal <strong>of</strong> Agricultural <strong>and</strong> Food Chemistry, 57,<br />
4148–4155.<br />
Fiorentino, A., Mastellone, C., D’Abrosca, B., Pacifico, S., Scognamiglio, M., Cefarelli,<br />
G., et al. (2009). d-Tocomonoenol: A new vitamin E from <strong>kiwi</strong> (Actinidia<br />
chinensis) fruits. Food Chemistry, 115, 187–192.<br />
Franke, A. A., Custer, L. J., Arakaki, C., & Murphy, S. P. (2004). Vitamin C <strong>and</strong> flavonoid<br />
levels <strong>of</strong> fruits <strong>and</strong> vegetables consumed in Hawaii. Journal <strong>of</strong> Food Composition<br />
<strong>and</strong> Analysis, 17, 1–35.<br />
Gong, F., Liang, Y.-Z., Fung, Y.-S., & Chau, F.-T. (2004). Correction <strong>of</strong> retention time<br />
shifts for chromatographic fingerprints <strong>of</strong> herbal medicines. Journal <strong>of</strong><br />
Chromatography A, 1029, 173–183.<br />
Granado-Serrano, A. B., Martin, M. A., Izquierdo-Pulido, M., Goya, L., Bravo, L., &<br />
Ramos, S. (2007). Molecular mechanisms <strong>of</strong> ( )-epicatechin <strong>and</strong> chlorogenic<br />
acid on the regulation <strong>of</strong> the apoptotic <strong>and</strong> survival/proliferation pathways in a<br />
human hepatoma cell line. Journal <strong>of</strong> Agricultural <strong>and</strong> Food Chemistry, 55,<br />
2020–2027.<br />
Gu, M., Zhang, S., Su, Z., Chen, Y., & Ouyang, F. (2004). Fingerprinting <strong>of</strong> Salvia<br />
miltiorrhiza Bunge by non-aqueous capillary electrophoresis compared with<br />
high-speed counter-current chromatography. Journal <strong>of</strong> Chromatography A,<br />
1057, 133–140.<br />
Imeh, U., & Khokhar, S. (2002). Distribution <strong>of</strong> conjugated <strong>and</strong> free phenols in fruits:<br />
Antioxidant activity <strong>and</strong> cultivar variations. Journal <strong>of</strong> Agricultural <strong>and</strong> Food<br />
Chemistry, 50, 6301–6306.<br />
Kong, W.-J., Zhao, Y.-L., Xiao, X.-H., Jin, C., & Li, Z.-L. (2009). Quantitative <strong>and</strong><br />
chemical fingerprint analysis for quality control <strong>of</strong> Rhizoma Coptidischinensis<br />
based on UPLC–PAD combined with chemometrics methods. Phytomedicine, 16,<br />
950–959.<br />
Mattila, P., Hellström, J., & Törrönen, R. (2006). Phenolic acids in berries, fruits, <strong>and</strong><br />
beverages. Journal <strong>of</strong> Agricultural <strong>and</strong> Food Chemistry, 54, 7193–7199.<br />
Motß, A. C., Soponar, F., & Sârbu, C. (2010). Multivariate analysis <strong>of</strong> reflectance<br />
spectra from propolis: Geographical variation in Romanian samples. Talanta, 81,<br />
1010–1015.<br />
Ni, Y., Lai, Y., Br<strong>and</strong>es, S., & Kokot, S. (2009). Multi-wavelength HPLC fingerprints<br />
from complex substances: An exploratory chemometrics study <strong>of</strong> the Cassia<br />
seed example. Analitica Chimica Acta, 647, 149–158.<br />
Ni, Y., Peng, Y., & Kokot, S. (2008). Fingerprinting <strong>of</strong> complex mixtures with the use<br />
<strong>of</strong> high performance liquid chromatography, inductively coupled plasma atomic<br />
emission spectroscopy <strong>and</strong> chemometrics. Analytica Chimica Acta, 616, 19–27.<br />
Ni, L.-J., Zhang, L.-G., Hou, J., Shi, W.-Z., & Guo, M.-L. (2009). A strategy for evaluating<br />
antipyretic efficacy <strong>of</strong> Chinese herbal medicines based on UV spectra<br />
fingerprints. Journal <strong>of</strong> Ethnopharmacology, 124, 79–86.<br />
Pereira, G. E., Gaudillere, J.-P., van Leeuwen, C., Hilbert, G., Maucourt, M., Deborde,<br />
C., et al. (2006). 1 H NMR metabolite fingerprints <strong>of</strong> grape berry: Comparison <strong>of</strong><br />
vintage <strong>and</strong> soil effects in Bordeaux grapevine growing areas. Analytica Chimica<br />
Acta, 563, 346–352.<br />
Savitzky, A., & Golay, M. J. E. (1964). Smoothing <strong>and</strong> differentiation <strong>of</strong> data by<br />
simplified least squares procedures. Analytical Chemistry, 36, 1627–1639.<br />
Taglienti, A., Massantini, R., Botondi, R., Mencarelli, F., & Valentini, M. (2009).<br />
Postharvest structural changes <strong>of</strong> Hayward <strong>kiwi</strong>fruit by means <strong>of</strong> magnetic<br />
resonance imaging spectroscopy. Food Chemistry, 114, 1583–1589.<br />
US Food <strong>and</strong> Drug Administration, FDA Guidance for Industry – Botanical Drug<br />
Products (Draft Guidance), Rockville, 2000, pp. 4. www.fda.gov/.../Drugs/<br />
GuidanceComplianceRegulatoryInformation/Guidances/ucm070491.pdf,<br />
Accessed 01.09.10.<br />
Wu, Z., Tao, L., Zhang, P., Li, P., Zhu, Q., Tian, Y., et al. (2010). Diffuse reflectance midinfrared<br />
Fourier transform spectroscopy (DRIFTS) for rapid identification <strong>of</strong><br />
dried sea cucumber products from different geographical areas. Vibrational<br />
Spectroscopy, 53, 222–226.<br />
Xiang, G., Yang, H., Yang, L., Zhang, X., Cao, Q., & Miao, M. (2010). Multivariate<br />
statistical analysis <strong>of</strong> tobacco <strong>of</strong> different origin, grade <strong>and</strong> variety according to<br />
polyphenols <strong>and</strong> organic acids. Microchemical Journal, 95, 198–206.<br />
Xu, S., Yang, L., Tian, R., Wang, Z., Liu, Z., Xie, P., et al. (2009). Species differentiation<br />
<strong>and</strong> quality assessment <strong>of</strong> Radix Paeoniae Rubra (Chi-shao) by means <strong>of</strong> highperformance<br />
liquid chromatographic fingerprint. Journal <strong>of</strong> Chromatography A,<br />
1216, 2163–2168.<br />
Yu, L., Sun, S.-Q., Fan, K.-F., Zhou, Q., & Noda, I. (2005). Research on processing<br />
medicinal herbs with multi-steps infrared macro-fingerprint method.<br />
Spectrochimica Acta A, 62, 22–29.<br />
Zhai, H. L., Hu, F. D., Huang, X. Y., & Chen, J. H. (2010). The application <strong>of</strong> digital<br />
image recognition to the analysis <strong>of</strong> two-dimensional fingerprints. Analytica<br />
Chimica Acta, 657, 131–135.