Market Overview – November 2011 Singapore - SBM Offshore
Market Overview – November 2011 Singapore - SBM Offshore
Market Overview – November 2011 Singapore - SBM Offshore
Create successful ePaper yourself
Turn your PDF publications into a flip-book with our unique Google optimized e-Paper software.
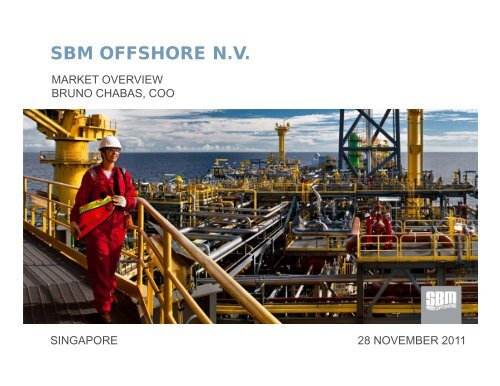
<strong>SBM</strong> OFFSHORE N.V.<br />
MARKET OVERVIEW<br />
BRUNO CHABAS, COO<br />
SINGAPORE 28 NOVEMBER <strong>2011</strong>
Some of the statements contained<br />
in this presentation that are not<br />
historical facts are statements of<br />
future expectations and other<br />
forward-looking statements based<br />
on management’s current views and<br />
assumptions and involve known and<br />
unknown risks and uncertainties<br />
that could cause actual results,<br />
performance, or events to differ<br />
materially from those in such<br />
statements. Such forward-looking<br />
statements are subject to various<br />
risks and uncertainties, which may<br />
cause actual results and<br />
performance of the Company’s<br />
business to differ materially and<br />
adversely from the forward-looking<br />
statements.<br />
Disclaimer<br />
Should one or more of these risks<br />
or uncertainties materialize, or<br />
should underlying assumptions<br />
prove incorrect, actual results may<br />
vary materially from those described<br />
in this presentation as anticipated,<br />
believed, or expected. <strong>SBM</strong><br />
<strong>Offshore</strong> NV does not intend, and<br />
does not assume any obligation, to<br />
update any industry information or<br />
forward-looking statements set forth<br />
in this presentation to reflect<br />
subsequent events or<br />
circumstances.<br />
page 2
Content<br />
Introduction<br />
<strong>Market</strong><br />
The Company<br />
page 3
Content<br />
Introduction<br />
<strong>Market</strong><br />
The Company<br />
page 4
Content<br />
Introduction<br />
<strong>Market</strong><br />
The Company<br />
page 5
Oil: demand/supply equilibrium<br />
Source: IEA- June <strong>2011</strong><br />
Current focus on potential short term decreasing demand in oil, but real issue<br />
is long term stability of supply:<br />
Depletion rates<br />
Geopolitical tensions<br />
Development of new fields is high priority<br />
page 6
Reserves (bn boe)<br />
700<br />
600<br />
500<br />
400<br />
300<br />
200<br />
100<br />
0<br />
<strong>Offshore</strong> reserves<br />
Importance of offshore development<br />
1950<br />
1956<br />
1962<br />
1968<br />
1974<br />
1980<br />
1986<br />
1992<br />
1998<br />
2004<br />
Liquids Gas<br />
Source: IFPEN, IHS<br />
<strong>Offshore</strong> oil production is today around 25 million barrels/day, above a quarter<br />
of worldwide oil production (30% for gas production). Deepwater is 20% of this<br />
offshore production.<br />
Mboe/d<br />
45<br />
40<br />
35<br />
30<br />
25<br />
20<br />
15<br />
10<br />
5<br />
0<br />
1950<br />
1954<br />
1958<br />
1962<br />
<strong>Offshore</strong> is fast growing area<br />
<strong>Offshore</strong> production<br />
1966<br />
1970<br />
1974<br />
1978<br />
1982<br />
1986<br />
1990<br />
1994<br />
1998<br />
2002<br />
2006<br />
Liquids< 1000m<br />
Liquids> 1000m<br />
Gas< 1000m<br />
Gas>1000m<br />
page 7
Part of recent discoveries in Deepwater<br />
New discoveries 2005-2010<br />
51%<br />
49%<br />
Other discoveries Deepwater<br />
Source: Petrobras<br />
Deepwater needs high technology solutions<br />
page 8
Economics of offshore development<br />
CAPEX for offshore field development<br />
21%<br />
38%<br />
41%<br />
Subsea Drilling Production facility<br />
Source: IFPEN<br />
Production facility is the minor part of field development costs<br />
page 9
CAPEX plans<br />
CAPEX plans of our clients are oriented to offshore<br />
page 10
Others<br />
ENI/Agip<br />
CoconoPhilips<br />
CNOOC<br />
Total<br />
Anadarko<br />
Chevron<br />
BP<br />
ExxonMobil<br />
StatoilHydro<br />
Shell<br />
Petrobras<br />
<strong>Offshore</strong> production facilities- Existing fleet<br />
Alternative solutions<br />
0 10 20 30 40 50 60 70 80 90 100 110<br />
FPSO Semi Spar TLP Other<br />
Source: Petrobras, PFC Energy<br />
FPSO is the favourite solution for offshore field development<br />
page 11
No of FPSOs<br />
100<br />
90<br />
80<br />
70<br />
60<br />
50<br />
40<br />
30<br />
20<br />
10<br />
Conversion is the cheapest solution<br />
Alternative solutions<br />
Conversion Newbuild<br />
0<br />
2000 2001 2002 2003 2004 2005 2006 2007 2008 2009 2010 <strong>2011</strong><br />
page 12
Lease<br />
Sale<br />
Lease or Sale<br />
2<br />
Field developments over 3 coming years<br />
1<br />
7<br />
6<br />
3<br />
14<br />
6<br />
9<br />
<strong>Market</strong> outlook is buoyant<br />
5<br />
1<br />
9<br />
2<br />
3<br />
FPSOs only<br />
page 13
N<br />
u<br />
m<br />
b<br />
e<br />
r<br />
o<br />
f<br />
u<br />
n<br />
i<br />
t<br />
s<br />
160<br />
140<br />
120<br />
100<br />
80<br />
60<br />
40<br />
20<br />
0<br />
Outlook on FPSO market over next 5 years<br />
New units+ redeployments<br />
US$/bl: 70-90 US$/bl: 90-110 US$/bl: 110-150<br />
<strong>SBM</strong> targets the upper side of the market<br />
Large FPSO<br />
Medium FPSO<br />
Small FPSO<br />
Source: IMA March <strong>2011</strong><br />
page 14
<strong>SBM</strong><br />
BW <strong>Offshore</strong><br />
Modec<br />
Teekay<br />
Bluewater<br />
Bumi Armada<br />
OSX<br />
Maersk<br />
Petrofac<br />
Saipem<br />
MISC<br />
Fred Olsen<br />
Rubicon<br />
Emas<br />
Sea Production<br />
Sevan Marine<br />
Single Unit Owners<br />
1<br />
2<br />
2<br />
2<br />
2<br />
2<br />
2<br />
2<br />
3<br />
4<br />
4<br />
2<br />
5<br />
1<br />
1<br />
6<br />
7<br />
1<br />
2<br />
9<br />
1<br />
11<br />
1<br />
12<br />
1<br />
1<br />
3<br />
1<br />
Lease production units<br />
2<br />
0 2 4 6 8 10 12 14 16 18 20<br />
Working Under Construction Idle Construction on Speculation/hold<br />
3<br />
6<br />
1<br />
page 15
(Engineering/Financial<br />
capacity)<br />
A<br />
w<br />
a<br />
r<br />
d<br />
s<br />
w<br />
o<br />
n<br />
5<br />
4<br />
3<br />
2<br />
1<br />
0<br />
FPSO market 2010-<strong>2011</strong> YTD Awards<br />
Competitors<br />
0 20000 40000 60000 80000 100000 120000 140000<br />
Average production capacity (bpd)<br />
(Engineering complexity)<br />
<strong>SBM</strong> engineering and financing capacity makes the difference<br />
page 16
FPSO Years<br />
140<br />
120<br />
100<br />
80<br />
60<br />
40<br />
20<br />
0<br />
Cumulative FPSO Operational Experience<br />
137 120 116<br />
93 88<br />
77<br />
69<br />
47 45 38 33<br />
Unrivalled experience in operation of FPSOs<br />
page 17
What is different from 2008-2009 period?<br />
Oil price has not decreased<br />
Recent trend in costs<br />
Overheating in supply chain<br />
page 18
240<br />
220<br />
200<br />
180<br />
160<br />
140<br />
120<br />
100<br />
IHS/CERA Upstream Capital Costs Index (UCCI)<br />
Trend in costs<br />
Q3 Q3 Q3 Q3 Q1 Q3 Q1 Q3 Q1 Q3 Q1 Q3 Q1 Q3 Q4 Q1 Q3 Q1 Q3 Q1<br />
2000 2001 2002 2003 2004 2004 2005 2005 2006 2006 2007 2007 2008 2008 2008 2009 2009 2010 2010 <strong>2011</strong><br />
All the industry now works with new breakeven level for<br />
deepwater offshore development around US$ 50/bl<br />
page 19
Global picture is different for yards<br />
Overheating<br />
page 20
Content<br />
Introduction<br />
<strong>Market</strong><br />
The Company<br />
page 21
Business Model<br />
Integrated model creates cash flow and knowledge synergies<br />
page 22
6,992<br />
7,955<br />
Backlog<br />
9,247<br />
CAGR: +13.3%<br />
10,032<br />
11,502<br />
2006 2007 2008 2009 2010<br />
1,990<br />
Historical figures<br />
Turnover<br />
2,871 3,060 2,956 3,056<br />
CAGR: +11.3%<br />
2006 2007 2008 2009 2010<br />
page 23
477<br />
Ebitda<br />
549 530<br />
CAGR: +9.6%<br />
613<br />
2006 2007 2008 2009 2010<br />
216<br />
688<br />
267<br />
Historical figures<br />
Net income<br />
228 230<br />
CAGR: +6.4%<br />
276<br />
2006 2007 2008 2009 2010<br />
page 24
14.6 15.1<br />
ROCE<br />
11<br />
2006 2007 2008 2009 2010<br />
9.7<br />
21.5<br />
10.1<br />
21.7<br />
Historical figures<br />
ROE<br />
17.7<br />
14.6<br />
12.4<br />
2006 2007 2008 2009 2010<br />
page 25
FPSO, FPSO, FPSO<br />
<strong>SBM</strong> focuses growth on core products with historically solid margins<br />
page 26
Improved execution and control<br />
2006 2007 2008 2009 2010 <strong>2011</strong> 2012 2013 2014<br />
2 MOPUs<br />
4 FPSOs<br />
+ 1 Turret<br />
5<br />
FPSOs<br />
2 Turrets<br />
Difficult Projects<br />
Completed with<br />
good performance<br />
In progress, on schedule<br />
<strong>SBM</strong> maintains preferred supplier status to deliver superior<br />
financial returns whilst maintaining a good risk/reward balance<br />
page 27
First criteria of choice: Quality and Safety<br />
Basic work<br />
Contingencies and calendar redundancies<br />
China<br />
page 28
Local content: <strong>SBM</strong>’s way to do business<br />
Partnership or investment in local yards: PAENAL (Angola) and MAUA (Brazil)<br />
P 57: 65 % of local content, first FPSO achieving this level in Brazil<br />
Local workforce<br />
80.00%<br />
70.00%<br />
60.00%<br />
50.00%<br />
40.00%<br />
30.00%<br />
20.00%<br />
10.00%<br />
0.00%<br />
Percentage of national crew in <strong>SBM</strong> <strong>Offshore</strong><br />
fleet at year- end 2010<br />
Brazil Angola Malaysia Overall<br />
Long term business partners are key to our performance , ability to<br />
invest and deliver<br />
page 29
Project Financing<br />
Joint ventures with Local partners<br />
Mitsubishi agreement<br />
Direct access to debt markets<br />
Financing the growth<br />
<strong>SBM</strong> has strong financial basis thanks its long term business partners<br />
page 30
Q&A session<br />
page 31
Notes<br />
page 32


