2008 Full Year Results - SBM Offshore
2008 Full Year Results - SBM Offshore
2008 Full Year Results - SBM Offshore
Create successful ePaper yourself
Turn your PDF publications into a flip-book with our unique Google optimized e-Paper software.
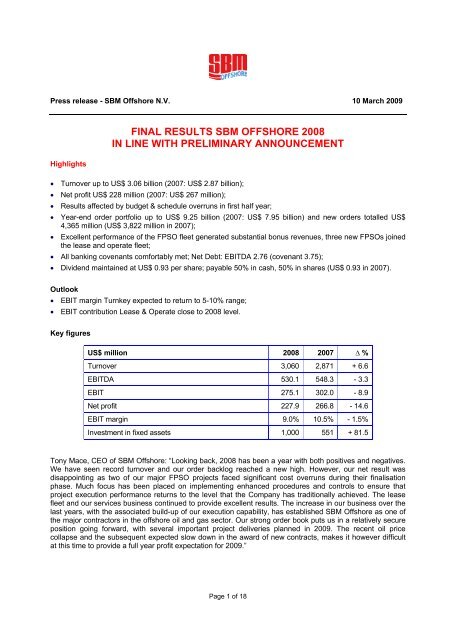
Press release - <strong>SBM</strong> <strong>Offshore</strong> N.V. 10 March 2009<br />
Highlights<br />
FINAL RESULTS <strong>SBM</strong> OFFSHORE <strong>2008</strong><br />
IN LINE WITH PRELIMINARY ANNOUNCEMENT<br />
• Turnover up to US$ 3.06 billion (2007: US$ 2.87 billion);<br />
• Net profit US$ 228 million (2007: US$ 267 million);<br />
• <strong>Results</strong> affected by budget & schedule overruns in first half year;<br />
• <strong>Year</strong>-end order portfolio up to US$ 9.25 billion (2007: US$ 7.95 billion) and new orders totalled US$<br />
4,365 million (US$ 3,822 million in 2007);<br />
• Excellent performance of the FPSO fleet generated substantial bonus revenues, three new FPSOs joined<br />
the lease and operate fleet;<br />
• All banking covenants comfortably met; Net Debt: EBITDA 2.76 (covenant 3.75);<br />
• Dividend maintained at US$ 0.93 per share; payable 50% in cash, 50% in shares (US$ 0.93 in 2007).<br />
Outlook<br />
• EBIT margin Turnkey expected to return to 5-10% range;<br />
• EBIT contribution Lease & Operate close to <strong>2008</strong> level.<br />
Key figures<br />
US$ million <strong>2008</strong> 2007 ∆ %<br />
Turnover 3,060 2,871 + 6.6<br />
EBITDA 530.1 548.3 - 3.3<br />
EBIT 275.1 302.0 - 8.9<br />
Net profit 227.9 266.8 - 14.6<br />
EBIT margin 9.0% 10.5% - 1.5%<br />
Investment in fixed assets 1,000 551 + 81.5<br />
Tony Mace, CEO of <strong>SBM</strong> <strong>Offshore</strong>: “Looking back, <strong>2008</strong> has been a year with both positives and negatives.<br />
We have seen record turnover and our order backlog reached a new high. However, our net result was<br />
disappointing as two of our major FPSO projects faced significant cost overruns during their finalisation<br />
phase. Much focus has been placed on implementing enhanced procedures and controls to ensure that<br />
project execution performance returns to the level that the Company has traditionally achieved. The lease<br />
fleet and our services business continued to provide excellent results. The increase in our business over the<br />
last years, with the associated build-up of our execution capability, has established <strong>SBM</strong> <strong>Offshore</strong> as one of<br />
the major contractors in the offshore oil and gas sector. Our strong order book puts us in a relatively secure<br />
position going forward, with several important project deliveries planned in 2009. The recent oil price<br />
collapse and the subsequent expected slow down in the award of new contracts, makes it however difficult<br />
at this time to provide a full year profit expectation for 2009.”<br />
Page 1 of 18
2. Development Order Portfolio<br />
2.1. Lease and Operate Portfolio<br />
The portfolio developed over the year as follows:<br />
New orders and extensions:<br />
• A one-year extension, until 23 November 2009, of the lease and operate contract for the FPSO Falcon<br />
from Esso Deepwater Limited, a subsidiary of Exxon Mobil;<br />
• A lease and operate contract with Petrobras for the Company’s existing FPSO Capixaba for a period of<br />
12 years at the Cachalote field offshore Brazil. Disconnection from the Golfinho field is planned for June<br />
2009, followed by an upgrade of the unit in Singapore with first oil at the Cachalote field in February<br />
2010.<br />
Start of operations:<br />
• In January, start of operation of the FPSO Mondo in the Kizomba ‘C’ field offshore Angola under the<br />
fifteen year lease contract with Exxon Mobil;<br />
• In July, start of operation of the FPSO Saxi-Batuque in the Kizomba ‘C’ field offshore Angola under the<br />
fifteen year lease contract with Exxon Mobil;<br />
• At the end of December, hook up of the FPSO Espirito Santo in the BC-10 field offshore Brazil under the<br />
fifteen year lease contract with Shell. The lease commenced on 1 January 2009.<br />
End of lease contracts:<br />
• In May, the FPSO Mystras, previously owned by FPSO Mystras Producao de Petroleo LTDA (FMPP), a<br />
50% owned subsidiary of the Company, has been purchased by Agip Energy and Natural Resources<br />
(Nigeria) Ltd (AENR);<br />
• In July, the FPSO Tantawan Explorer in Thailand has been purchased by Chevron <strong>Offshore</strong> Thailand<br />
Ltd at the end of the lease and operate contract;<br />
• At the end of October, FPSO Rang Dong I in Vietnam has been redelivered to the Company by Japan<br />
Vietnam Petroleum Company Ltd (JVPC) at the end of the confirmed lease period including a short<br />
extension. The unit has been disconnected and decommissioned and is currently laid up;<br />
• The FSO Okha has been redelivered to the Company by Sakhalin Energy Investment Company Ltd<br />
(SEIC) in December 2009, at the end of the lease period. The FSO will be converted into a FPSO as<br />
replacement of the Cossack Pioneer FPSO for Woodside Energy Limited.<br />
The lease fleet is contracted with major and national oil companies on long-term charters independent of oil<br />
price fluctuations, production volumes (except for Murphy Thunder Hawk) or financial turmoil. The solid and<br />
robust nature of our clients and contracts give a high level of confidence for profit generation in the years to<br />
come and continued repayment of debt on schedule.<br />
2.2 Turnkey Supply and Services Portfolio<br />
The major completions and milestones during the year included the following projects:<br />
• Supply of an external turret for an FSO for Tanker Pacific <strong>Offshore</strong> Terminal Pte Ltd (TPOT) for<br />
operation in the Su Tu Vang field offshore Vietnam;<br />
• Supply of a turret for the LPG FSO for the Belanak field for ConocoPhillips;<br />
• Supply of a deep water CALM buoy for Total for the Akpo field development offshore Nigeria;<br />
• Mechanical completion of the Frade FPSO at Dubai Drydocks.<br />
Page 2 of 18
The most significant awards during the year included:<br />
• A contract with Petrobras for the turnkey supply and three years of operation of the P-57 FPSO to be<br />
installed on Jubarte field offshore Brazil. The delivery of the unit in Brazil, ready for installation, is<br />
planned for the end of 2010;<br />
• A contract with Woodside Energy Limited and the Cossack Wanaea Lambert Hermes (CWLH) Joint<br />
Venture for the turnkey supply of the disconnectable FPSO Okha, to be installed offshore Australia as<br />
replacement of the existing FPSO Cossack Pioneer. Delivery of the unit is scheduled for the fourth<br />
quarter of 2010;<br />
• A call off frame contract with BP Angola for the supply of FPSOs offshore Angola. The initial contract call<br />
off has been signed for early engineering and fabrication works. Subject to project sanction decisions,<br />
the full scope supply of one or more FPSOs is expected. In view of this contract and other FPSO<br />
prospects in Angola, in joint-venture with Sonangol the Company commenced construction of a new<br />
fabrication yard at Porto Amboim, which will be able to perform significant FPSO construction and<br />
integration activities;<br />
• In consortium with APL, a contract with Total E&P Angola for the supply and installation of the Oil<br />
Loading System on the Pazflor project. The Company’s scope of work consists of supply of the (2) Oil<br />
Offloading Lines, to be based on the Trelline TM , and the offshore installation of the complete Oil Loading<br />
System;<br />
• A contract with Resolution Shipping Ltd (Cyprus), a subsidiary of Vroon Group, for the supply of two<br />
1,000 ton cranes and two jacking systems, with a total jacking capacity of 22,500 tons each, for two wind<br />
turbine installation jack-up vessels (<strong>SBM</strong> <strong>Offshore</strong> group design).<br />
The execution of the current turnkey portfolio backlog is progressing on schedule. Input costs remain tight,<br />
even though there are some signs of easing in the construction activities.<br />
2.3 Developments since the beginning of 2009<br />
In the first quarter of the year the following activities have taken place:<br />
• The FPSO Frade is currently en route to Brazil for offshore installation;<br />
• <strong>SBM</strong> <strong>Offshore</strong>, in a consortium with Aker Solutions and Technip, has been awarded an engineering<br />
contract by Shtokman Development AG which will lead to the tender for the floating production unit for<br />
the first phase of the integrated development of the Shtokman gas-condensate field in the Barents Sea<br />
offshore Russia;<br />
• The Thunder Hawk FPU is currently being towed to the field in the Gulf of Mexico.<br />
3. Dividend proposal<br />
To reflect the Company’s confidence in its strong order book the dividend proposal will be to maintain the<br />
same dividend level as for 2007, at US$ 0.93 per share, representing an exceptional pay-out ratio of 60%,<br />
differing from the Company’s 50% pay-out policy. Nevertheless, to conserve capital and secure cash-flow<br />
predictability the dividend will, exceptionally, be payable 50% in cash and 50% in shares.<br />
As in previous years, the annual dividend will be calculated in US Dollars, but will be payable in Euros. The<br />
conversion into Euros will be effected on the basis of the exchange rate on 14 May 2009. The conversion<br />
ratio for stock dividend will be determined on 22 May 2009, after the close of the Euronext Amsterdam stock<br />
exchange and will be based on the volume weighted average price of all traded ordinary shares for the<br />
period of 18 - 22 May 2009.<br />
Page 3 of 18
4. Market Developments<br />
The Company secured several major contracts in <strong>2008</strong> which resulted in a record order backlog by the end<br />
of the year. A majority (67%) of the new orders were for turnkey sales rather than lease contracts. It should<br />
be noted that the Company is generally not able to influence the client’s lease or buy decision and in the<br />
case of the Woodside contract initial discussions focused on a lease although ultimately a turnkey sale<br />
contract was concluded.<br />
The medium and long term fundamentals of the business remain sound and the demand for the Company’s<br />
products and services is still strong. This is supported by the current high level of bidding activities similar to<br />
previous years. This includes both lease and turnkey supply of large FPSOs for deepwater application in<br />
West Africa and Brazil, but also other areas, such as the Barents Sea. However, due to the current turmoil in<br />
the financial markets and lower oil price, it is anticipated that there will be a slow-down in the award of new<br />
contracts in the short term as some oil companies may decide to postpone project developments, either<br />
because the projects become uneconomic at current low oil price levels or that they will wait before awarding<br />
contracts in the expectation that the costs will decrease.<br />
It is also anticipated that some of the smaller operators may run into difficulty to raise financing for their<br />
project developments, resulting in the projects being cancelled or at least delayed. It should be noted<br />
however, that the Company generally targets the major oil companies who are less likely to be affected by<br />
financing concerns.<br />
With respect to the LNG FPSO the Company expects to start front-end engineering and design work for a<br />
client in 2009, although a final investment decision is not expected before the end of 2009. No material<br />
capex requirements are expected in 2009 for the LNG FPSO.<br />
The Company will continue to develop technology for the increasing challenge of deepwater, complex oil<br />
fields and natural gas exploitation, which are considered to be the long-term growth areas.<br />
5. Expectations for 2009<br />
In the current economic climate, awards of a number of oil and gas projects targeted by the Company in<br />
2009 are likely to be delayed. As a result the Company is not in a position at this time to provide net profit<br />
expectations for the full-year 2009, but anticipates the following:<br />
• Average EBIT margins in 2009 in the Turnkey Systems and Services segment are expected to return to<br />
the 5% - 10% range.<br />
• Depending upon the variable, production related revenues from the Thunder Hawk semi-submersible<br />
unit, the EBIT contribution from the lease and operate segment is expected to be close to the level<br />
achieved in <strong>2008</strong>, excluding non-recurring items.<br />
• Net interest charge in 2009 will double compared to <strong>2008</strong> due to start of operations on major lease<br />
contracts and low expected interest income on liquidities.<br />
• Capital expenditure, excluding any new operating lease contracts to be obtained in 2009, is expected to<br />
amount to US$ 0.5 billion.<br />
• Net gearing at year-end 2009 is expected to be at or below the current level, with debt ratios well within<br />
all banking covenants. A temporary increase in net gearing in mid 2009 is expected due to the timing of<br />
turnkey project milestone payments, but ratios still well within bank covenants.<br />
Quarterly trading updates will be provided in 2009.<br />
Page 4 of 18
6. Financial Review<br />
Highlights<br />
Turnover for <strong>2008</strong> increased to US$ 3,060 million, a 6.6% increase in comparison with US$ 2,871 million in<br />
2007, mainly as a result of expanded lease and operate activities.<br />
Operating profit (EBIT) decreased to US$ 275.1 million compared with US$ 302.0 million in 2007. EBIT<br />
margin decreased to 9.0% compared to 10.5% in 2007 while the net profit margin decreased to 7.4% (9.3%<br />
in 2007). Both decreases result mainly from the higher materials, equipment and subcontractors costs than<br />
budgeted on certain major projects, which severely impacted the profitability of the Turnkey Systems and<br />
Services segment in the first half of <strong>2008</strong>.<br />
EBITDA amounted to US$ 530.1 million, compared to US$ 548.3 million in 2007.<br />
In <strong>2008</strong> net profit of US$ 227.9 million was achieved, representing a 14.6% decrease in comparison with the<br />
2007 net profit of US$ 266.8 million. After adjusting for non recurring sales of assets or activities (net gain<br />
US$ 31 million in <strong>2008</strong> versus US$ 5 million in 2007) operational profits show a decrease of approximately<br />
24.8%.<br />
Earnings per share amounted to US$ 1.54, compared to US$ 1.85 in 2007.<br />
New orders in the year totalled US$ 4,365 million (split 67% / 33% between the Turnkey Systems and<br />
Services and the Lease and Operate segments respectively), compared to US$ 3,822 million in 2007.<br />
Total order portfolio at the end of the year was US$ 9,247 million compared to US$ 7,955 million at the end<br />
of 2007, an increase of 16.2%. Of this, 67.9% or US$ 6,278 million relates to the non-discounted value of the<br />
revenues from the Company’s long-term lease contracts in portfolio.<br />
The year was marked by the following highlights:<br />
• a healthy inflow of new orders, from turnkey contracts (including two orders for FPSOs on a sales basis)<br />
and a major upgrade and contract extension for the FPSO Capixaba;<br />
• the sale of the FPSO Mystras (50% owned by the Company) to Agip Energy Natural Resources (Nigeria<br />
Ltd) (AENR) in May <strong>2008</strong> and the FPSO Tantawan Explorer to Chevron Thailand in August <strong>2008</strong> under<br />
the client’s contractual purchase options;<br />
• the sale of the Alblasserdam South land remaining from the Company’s previous Dutch shipbuilding<br />
activities;<br />
• the delivery of one major lease project, the FPSO Espirito Santo for Shell in Brazil;<br />
• the total investment in fixed assets in <strong>2008</strong> amounted to US$ 1.00 billion, which is much higher than in<br />
2007 (US$ 551 million) and which excludes the costs of completing the investment in the FPSO Saxi<br />
Batuque contract which is accounted for as a finance (capital) lease.<br />
Segmental information in respect of the two core businesses of the Company during <strong>2008</strong> is provided in the<br />
detailed financial analysis which follows:<br />
Page 5 of 18
Order portfolio<br />
7000<br />
6000<br />
5000<br />
4000<br />
3000<br />
2000<br />
1000<br />
0<br />
in millions of US$<br />
Total new booked orders for <strong>2008</strong> amounted to US$ 4,365 million. This amount includes a major contract<br />
amendment for the relocation of the FPSO Capixaba to Petrobras’ Cachalote field in Brazil, other lease<br />
extensions (FPSO Falcon, FPSO Rang Dong I and FSO Sakhalin Okha) as well as substantial turnkey<br />
contracts (Petrobras P-57 FPSO, Woodside Cossack FPSO).<br />
Total turnover increased when compared with 2007, with turnkey business representing 74% of total<br />
turnover in <strong>2008</strong> (76% in 2007). Lease and Operate turnover increased by 17% compared with 2007 as the<br />
first revenues from FPSO Saxi Batuque and full year revenues from the FPSO Kikeh and FPSO Mondo<br />
more than compensated for the reduction in revenues resulting from the sale of FPSO Mystras (May <strong>2008</strong>),<br />
the sale of FPSO Tantawan Explorer (August <strong>2008</strong>) and the termination of Rang Dong I charter (October<br />
<strong>2008</strong>).<br />
The contracts for the FPSO Mondo and FPSO Saxi Batuque for ExxonMobil consist of significant lump sum<br />
elements, plus fifteen year front loaded leases, which are accounted for as finance leases. This means that<br />
the entire capital values are recognised as turnkey turnover during construction, but with only the return on<br />
investment recognised as lease income during the lease period, thus negatively impacting turnkey margins<br />
and improving lease margins. Under an operating lease treatment only the partner’s 50% share of the Capex<br />
investment would have been accounted for as a turnkey sale and the Company’s 50% share of the full<br />
revenues recognised as lease turnover during the charter. In <strong>2008</strong>, total turnover recognised in respect of<br />
construction of assets accounted for as finance leases amounted to US$ 61 million (2007: US$ 315 million).<br />
3500<br />
3000<br />
2500<br />
2000<br />
1500<br />
1000<br />
Turnkey<br />
Lease<br />
500<br />
1436 1510<br />
0<br />
634<br />
802<br />
in millions of US$<br />
Turnkey<br />
Lease<br />
1069<br />
537<br />
1519<br />
1044<br />
466<br />
934<br />
533 585<br />
New Orders<br />
4916<br />
Turnover<br />
1990<br />
Page 6 of 18<br />
3549<br />
1367<br />
1396<br />
594<br />
2871<br />
3822<br />
2181<br />
2004 2005 2006 2007 <strong>2008</strong><br />
690<br />
1886<br />
1936<br />
2004 2005 2006 2007 <strong>2008</strong><br />
3060<br />
4365<br />
2928<br />
2250<br />
810<br />
1437
12000<br />
11000<br />
10000<br />
9000<br />
8000<br />
7000<br />
6000<br />
5000<br />
4000<br />
3000<br />
2000<br />
1000<br />
0<br />
in millions of US$<br />
Turnkey<br />
Lease<br />
4071 4059<br />
498 839<br />
3573 3220<br />
Order Portfolio<br />
Page 7 of 18<br />
2585<br />
4407<br />
2304<br />
5651<br />
2004 2005 2006 2007 <strong>2008</strong><br />
The year-end order portfolio at US$ 9.25 billion is up 16.2% from last year’s level of US$ 7.96 billion and<br />
represents a year-end record. The current order portfolio includes US$ 6.28 billion (2007: US$ 5.65 billion)<br />
for the non-discounted value of future revenues from the long-term charters of the lease fleet, of which US$<br />
4.25 billion (2007: US$ 3.86 billion) represents the bareboat element of the operating leases. The turnkey<br />
order backlog increased by 29% and represents more than one year of turnkey turnover.<br />
Profitability<br />
The primary business segments of the Company are the Lease and Operate activities versus Turnkey<br />
Systems and Services sales. However, given that both activities are closely related, and each demand the<br />
same core technological know-how, all costs are not specifically related to either one segment or the other.<br />
For example, when sales costs are incurred (including significant sums for preparing the bid), it is often<br />
uncertain whether the project will be leased or contracted on a turnkey lump sum basis. Furthermore, with<br />
IFRS limiting the capitalisation of General & Administrative overheads into the asset value of the lease fleet,<br />
segmental results are further skewed in favour of the lease activities. Indeed much of the Company’s<br />
engineering and project management resources contribute to construction of the lease fleet ‘at cost’ without<br />
a Selling, General and Administration costs (S, G & A) mark-up, while the FPSO/FSO fleet results ‘benefit’<br />
from lower capex and lower annual depreciation. For these reasons, the Company does not present detailed<br />
analysis of segment net profits. In approximate terms however, two-thirds of S, G & A and other operating<br />
costs and revenues can be attributed to the Turnkey Systems and Services segment, meaning that in <strong>2008</strong><br />
23.6% of EBIT is contributed by Turnkey sales and 76.4% by Lease and Operate activities.<br />
The Company will implement the requirements of IFRS 8 ‘Operating Segments’ as from 1 January 2009,<br />
which will provide a more precise analysis of segmental profitability.<br />
6992<br />
7955<br />
9247<br />
2969<br />
6278
450<br />
400<br />
350<br />
300<br />
250<br />
200<br />
150<br />
100<br />
50<br />
0<br />
in millions of US$<br />
FPSO Serpentina Sale<br />
161<br />
275<br />
195<br />
EBIT<br />
(Operating Profit)<br />
254<br />
2004 2005 2006 2007 <strong>2008</strong><br />
Gross margin in <strong>2008</strong> of US$ 413.6 million (US$ 435.6 million in 2007) consisted of US$ 256.3 million (US$<br />
223.9 million in 2007) from Lease and Operate activities and US$ 157.3 million (US$ 211.7 million in 2007)<br />
from Turnkey Systems and Services.<br />
EBIT decreased compared to 2007 due to:<br />
• much lower contribution from major turnkey projects, particularly due to cost overruns on the FPSO<br />
Frade, FPSO Saxi Batuque and (to a lesser extent) drilling rig series;<br />
• continuing growth from the lease fleet as mentioned earlier. It should be repeated however that the net<br />
profit contribution of newly operational leased units is limited by the relatively high interest burden during<br />
the first years of operation. <strong>Full</strong> dedication of lease revenues to debt servicing leads to fast amortisation<br />
of the loan balances and hence reduced interest charges going forward;<br />
• sale of FPSOs Mystras and Tantawan Explorer and sale of the Company’s Alblasserdam South land,<br />
resulting in a combined net gain of US$ 31.4 million (including release of FPSO demobilisation<br />
provisions);<br />
• slightly lower R&D charge.<br />
As a percentage of the higher turnover, operating profit therefore decreased to 9.0% (2007: 10.5%).<br />
Net financing costs were higher as a result of the beginning of the charters in 2007 and <strong>2008</strong> of the FPSO<br />
Kikeh, FPSO Mondo and FPSO Saxi Batuque. Once production units are brought into service the financing<br />
costs are expensed to P&L (whereas during construction interest is capitalised). Although net debt increased<br />
significantly during <strong>2008</strong>, the major part of this increase concerned production units still under construction.<br />
Interest income fell sharply in the second half of <strong>2008</strong> with the reduction in short-term US interest rates.<br />
The <strong>2008</strong> tax burden was US$ 9.4 million (4.0% of profit before tax), reflecting in particular the profitability of<br />
the Dutch operations of the Company, combined with the relatively low tax burden elsewhere. This<br />
compares to a net tax burden of US$ 14.9 million (5.3% of pre-tax profit) in 2007. The corporate tax burden<br />
(excluding withholding taxes and other project taxes) for the Company is expected to average between 5%<br />
and 10% of pre-tax profits for the foreseeable future.<br />
Page 8 of 18<br />
302<br />
275
400<br />
350<br />
300<br />
250<br />
200<br />
150<br />
100<br />
50<br />
0<br />
in millions of US$<br />
FPSO Serpentina Sale<br />
92<br />
146<br />
Net Profit<br />
216<br />
2004 2005 2006 2007 <strong>2008</strong><br />
For the reasons stated before, no detailed allocation of net profit between business segments is provided.<br />
3.00<br />
2.50<br />
2.00<br />
1.50<br />
1.00<br />
0.50<br />
0.00<br />
Weighted average earnings per share*<br />
in US$<br />
FPSO Serpentina Sale<br />
0.69<br />
1.66<br />
1.0 7<br />
1.55<br />
1.85<br />
226<br />
The dividend proposal of US$ 0.93 per share is explained earlier in Section 3.<br />
1.54<br />
2004 2005 2006 2007 <strong>2008</strong><br />
2.00<br />
1.50<br />
1.00<br />
0.50<br />
0.00<br />
Page 9 of 18<br />
in US$<br />
0.43<br />
0.54<br />
267<br />
FPSO Serpentina Sale<br />
0.83<br />
Dividend per share*<br />
0.77<br />
0.93<br />
228<br />
0.93<br />
2004 2005 2006 2007 <strong>2008</strong><br />
* restated for the four to one share split in 2006 * restated for the four to one share split in 2006
Return On average Capital Employed and Equity<br />
3000<br />
2400<br />
1800<br />
1200<br />
600<br />
0<br />
in millions of US$<br />
FPSO Serpentina Sale<br />
1818<br />
(Weighted) Average Capital Employed<br />
1828<br />
1747<br />
Page 10 of 18<br />
2006<br />
2499<br />
2004 2005 2006 2007 <strong>2008</strong><br />
Capital Employed (Equity + Provisions + Deferred tax liability + Net Debt) at year-end <strong>2008</strong> is US$ 483<br />
million above last year’s level due to the increasing investments in leased production facilities (and<br />
consequently net debt), plus retained profits less adjustments to equity in respect of financial instruments.<br />
With the strengthening of the US Dollar and the dramatic reduction in US interest rates in the second half of<br />
the year, equity has been negatively impacted by US$ 269 million in <strong>2008</strong> on marking to market the<br />
Company’s portfolio of forward exchange contracts and interest rate swaps.<br />
25.00<br />
20.00<br />
15.00<br />
10.00<br />
5.00<br />
0.00<br />
in millions of US$<br />
FPSO Serpentina Sale<br />
8.9<br />
1886<br />
Return on Average Capital Employed (%)<br />
14.6<br />
10.7<br />
14.6<br />
15.1<br />
11.0<br />
2004 2005 2006 2007 <strong>2008</strong><br />
ROACE (Return On Average Capital Employed) decreased in <strong>2008</strong> to 11.0%. This is the combined result of<br />
two main factors, namely:<br />
• low profitability of Turnkey Systems and Services segment;<br />
• high profitability from the Lease and Operate segment but with growing average capital employed.
40.00<br />
35.00<br />
30.00<br />
25.00<br />
20.00<br />
15.00<br />
10.00<br />
5.00<br />
0.00<br />
Return On average Equity (ROE) at 17.7% was well below the level achieved in recent years due to the<br />
impact of the turnkey project cost overruns in the first half of <strong>2008</strong> and despite the attractive returns achieved<br />
on the lease fleet.<br />
Cash flow / liquidities<br />
in millions of US$<br />
14.1<br />
Return On average Equity (%)<br />
28.1<br />
21.5<br />
21.7<br />
18.5 17.7<br />
2004 2005 2006 2007 <strong>2008</strong><br />
US$ million 2004 2005 2006 2007 <strong>2008</strong><br />
Net profit 91.7 225.8 216.3 266.8 227.9<br />
Depreciation and amortisation 209.6 206.8 223.3 246.3 255.0<br />
Cash flow 301.3 432.6 439.6 513.1 482.9<br />
EBITDA 370.8 482.2 477.5 548.3 530.1<br />
Net liquidities/securities 145.1 144.8 339.7 274.1 230.1<br />
Cash flow from operations* 93.1 831.0 592.4 331.1 577.0<br />
EV: EBITDA ratio at 31/12 8.8 7.4 11.3 9.9 6.4<br />
EBITDA: interest cover ratio 6.1 9.4 15.2 24.5 13.1<br />
* As per the consolidated statement of cash flows<br />
Cash flow and EBITDA were each lower than prior years with the reduced contribution from Turnkey<br />
activities outweighing the impact of the growing lease fleet.<br />
Net liquidities decreased to US$ 230 million, of which US$ 62.2 million can be considered as being<br />
dedicated to specific project debt servicing or otherwise restricted in its utilisation.<br />
Page 11 of 18
Balance sheet<br />
US$ million 2004 2005 2006 2007 <strong>2008</strong><br />
Capital employed 1,846.1 1,740.9 1,754.0 2,257.4 2,740.9<br />
Shareholders' equity 662.4 895.0 1,118.7 1,333.4 1,234.7<br />
Net Debt 1,139.6 804.7 585.8 874.7 1,464.0<br />
Net gearing (%) 172 90 52 65 119<br />
Net Debt: EBITDA ratio 3.21 1.67 1.23 1.60 2.76<br />
Investment in fixed assets 237.3 398.5 309.0 551.0 999.8<br />
Current ratio 0.96 0.78 1.14 1.15 0.79<br />
Shareholders’ equity decreased by 7.4% to US$ 1,235 million as a result of the negative change in value in<br />
the Company’s portfolio of interest rate and foreign exchange hedges. These unrealised losses are charged<br />
directly against equity in accordance with hedge accounting rules and result from the Company’s policy of<br />
full hedging of identified interest rate and forex exposures and the significant movements in US interest rates<br />
and foreign exchange rates in the latter part of <strong>2008</strong>. Capital employed increased by 21.4% when taking into<br />
account the expansion of net debt. The Company remains clearly focused on the Company’s gearing and<br />
other balance sheet ratios. The relevant banking covenants (of which the principal covenant is Net Debt:<br />
EBIDTA ≤ 3.75) were all more than comfortably met.<br />
The investments in the operating units have been fully financed to the extent necessary, with the exception<br />
of the EnCana Deep Panuke project, for which the Company is currently engaged in financing discussions.<br />
Before deduction of accrued interest, at 31 December <strong>2008</strong> the Company has undrawn committed bank<br />
facilities totalling US$ 404 million (Revolving Credit Facility, Thunder Hawk and BC-10 project loans)<br />
available for financing capital investment in 2009.<br />
There continues to be no off-balance sheet financing.<br />
Capital Expenditure<br />
Total capital expenditure for <strong>2008</strong> (comprising of additions to property, plant & equipment plus capitalised<br />
R&D expenditure) amounted to US$ 999.8 million (2007: US$ 551 million). The majority of this total is<br />
related to new investment in the lease fleet for which the major elements are:<br />
• completion of the FPSO Espirito Santo for Shell, Brazil (51%);<br />
• ongoing expenditure on the conversion and equipment procurement for the semi-submersible for Murphy<br />
Thunder Hawk (US Gulf of Mexico), the MOPUstor jack-up facility for Talisman’s Yme field in Norway,<br />
and for the MOPU gas platform for EnCana’s Deep Panuke field in Canada.<br />
Capital expenditure in <strong>2008</strong> on the FPSO Saxi Batuque for ExxonMobil, Angola, is excluded from the total<br />
amount above. Due to the classification of the contract as a finance lease, investment in the unit was<br />
recorded through construction contracts with the investment in finance lease ultimately recorded in financial<br />
fixed assets.<br />
Page 12 of 18
7. Financial Agenda<br />
Final <strong>Results</strong> <strong>2008</strong> - Analysts Presentation (Amsterdam)<br />
Annual Report <strong>2008</strong><br />
Trading Update Q1 2009 - Press Release<br />
Annual General Meeting of Shareholders <strong>2008</strong><br />
Ex-dividend Date<br />
Half-year <strong>Results</strong> 2009 - Press Release<br />
Half-year <strong>Results</strong> 2009 - Analysts Presentation (Amsterdam)<br />
Trading Update Q3 2009 - Press Release<br />
Page 13 of 18<br />
11 March<br />
End April<br />
13 May<br />
14 May<br />
18 May<br />
19 August<br />
19 August<br />
10 November<br />
2009<br />
2009<br />
2009<br />
2009<br />
2009<br />
2009<br />
2009<br />
2009<br />
The Analysts Presentation will be webcast via the <strong>SBM</strong> <strong>Offshore</strong> website (www.sbmoffshore.com) at 14h00<br />
CET on Wednesday 11 March 2009.<br />
8. Corporate Profile<br />
The Dutch public company <strong>SBM</strong> <strong>Offshore</strong> N.V. is the holding company of a group of international, marine<br />
technology orientated companies. Its business is to serve on a global basis the offshore oil and gas industry<br />
by supplying engineered products, vessels and systems, and offshore oil and gas production services.<br />
The product line comprises:<br />
• <strong>Offshore</strong> import/export terminals for crude oil, refined products, LPG and LNG, mostly based on the single<br />
point mooring principle, Floating Production and/or Storage and Offloading systems (FSOs and FPSOs)<br />
and other floating production facilities based on ship hulls, semi-submersibles and Tension Leg Platforms<br />
(TLPs);<br />
• <strong>Offshore</strong> oil and gas production services through the leasing of integrated production and storage facilities<br />
owned and operated by the Company;<br />
• Design, construction and supply of semi-submersible drilling platforms;<br />
• Special designs and engineering services and delivery of specific hardware components for dynamically<br />
positioned drillships, semi-submersible drilling platforms, jack-up drilling platforms, jack-up platforms for<br />
civil construction, large capacity offshore cranes, elevating and lifting systems, crane vessels and other<br />
specialised work vessels;<br />
• <strong>Offshore</strong> construction and installation contracting services.<br />
The Board of Management Schiedam, 10 March 2009
For further information:<br />
<strong>SBM</strong> <strong>Offshore</strong> N.V.<br />
Karel Doormanweg 66<br />
3115 JD Schiedam<br />
Post address:<br />
P.O. Box 31<br />
3100 AA Schiedam<br />
The Netherlands<br />
Contact person: Mr. Sebastiaan de Ronde Bresser<br />
Telephone: (+377) 92 05 85 15<br />
Mobile: (+33) 643 919 312<br />
Fax: (+377) 92 05 89 40<br />
E-mail: sebastiaan.derondebresser@sbmoffshore.com<br />
Website: www.sbmoffshore.com<br />
Disclaimer<br />
Some of the statements contained in this release that are not historical facts are statements of future<br />
expectations and other forward-looking statements based on management’s current views and assumptions<br />
and involve known and unknown risks and uncertainties that could cause actual results, performance, or<br />
events to differ materially from those in such statements. Such forward-looking statements are subject to<br />
various risks and uncertainties, which may cause actual results and performance of the Company’s business<br />
to differ materially and adversely from the forward-looking statements. Certain such forward-looking<br />
statements can be identified by the use of forward-looking terminology such as “believes”, “may”, “will”,<br />
“should”, “would be”, “expects” or “anticipates” or similar expressions, or the negative thereof, or other<br />
variations thereof, or comparable terminology, or by discussions of strategy, plans, or intentions. Should one<br />
or more of these risks or uncertainties materialize, or should underlying assumptions prove incorrect, actual<br />
results may vary materially from those described in this release as anticipated, believed, or expected. <strong>SBM</strong><br />
<strong>Offshore</strong> NV does not intend, and does not assume any obligation, to update any industry information or<br />
forward-looking statements set forth in this release to reflect subsequent events or circumstances<br />
Page 14 of 18
Consolidated income statement<br />
For the years ended 31 December in thousands of US Dollars<br />
Page 15 of 18<br />
<strong>2008</strong> 2007<br />
Revenue 3,060,276 2,871,214<br />
Cost of Sales (2,646,660) (2,435,624)<br />
Gross margin 413,616 435,590<br />
Other operating income 10,345 1,313<br />
Selling and marketing expenses (37,510) (36,234)<br />
General and administrative expenses (90,022) (76,496)<br />
Other operating expenses (21,365) (22,158)<br />
(138,552)<br />
(133,575)<br />
Operating profit (EBIT) 275,064 302,015<br />
Financial income 24,932 20,870<br />
Financial expenses (65,276) (43,222)<br />
Net financing costs (40,344) (22,352)<br />
Share of profit of associates 2,535 1,964<br />
Profit before tax 237,255 281,627<br />
Income tax (9,380)<br />
(14,861)<br />
Profit 227,875 266,766<br />
<strong>2008</strong> 2007<br />
Attributable to shareholders 223,172 262,885<br />
Attributable to minority interests 4,703 3,881<br />
Profit 227,875 266,766<br />
<strong>2008</strong> 2007<br />
Weighted average number of shares outstanding 144,659,503 142,274,874<br />
Basic earnings per share US$ 1.54 US$ 1.85<br />
<strong>Full</strong>y diluted earnings per share US$ 1.53 US$ 1.82
Consolidated balance sheet<br />
at 31 December in thousands of US Dollars (before appropriation of profit)<br />
<strong>2008</strong><br />
ASSETS<br />
2007<br />
Property, plant and equipment<br />
2,565,388 1,962,395<br />
Intangible assets<br />
46,782 35,571<br />
Investment in associates 69 71<br />
Other financial assets<br />
420,372 92,550<br />
Deferred tax asset<br />
12,922 8,596<br />
Total non-current assets 3,045,533 2,099,183<br />
Inventories<br />
Trade and other receivables<br />
Income tax receivable<br />
Construction contracts<br />
Derivative financial instruments<br />
Cash and cash equivalents<br />
Total current assets<br />
TOTAL ASSETS<br />
EQUITY AND LIABILITIES<br />
Equity attributable to shareholders<br />
Issued share capital<br />
Share premium reserve<br />
Retained earnings<br />
Other reserves<br />
Minority interests<br />
Total equity<br />
Long-term loans and other liabilities<br />
Provisions<br />
Deferred tax liability<br />
23,305 15,448<br />
672,795 569,344<br />
Page 16 of 18<br />
829 224<br />
292,542 513,644<br />
79,661 156,095<br />
230,329 280,684<br />
1,299,461 1,535,439<br />
4,344,994 3,634,622<br />
50,885 52,750<br />
383,274 363,057<br />
1,053,780 890,697<br />
(253,211) 26,933<br />
1,234,728 1,333,437<br />
6,207 4,297<br />
1,240,935 1,337,734<br />
1,430,319 921,505<br />
35,275 44,110<br />
709 812<br />
Total non-current liabilities 1,466,303 966,427<br />
Trade and other payables<br />
Current income tax liabilities<br />
Borrowings and bank overdrafts<br />
Derivative financial instruments<br />
1,039,467 909,081<br />
21,144 16,414<br />
263,970 233,868<br />
313,175 171,098<br />
Total current liabilities 1,637,756 1,330,461<br />
TOTAL EQUITY AND LIABILITIES<br />
4,344,994 3,634,622
Consolidated statement of changes in equity<br />
in thousands of US Dollars<br />
At 1 January 2007<br />
Outstanding<br />
number of<br />
shares<br />
Issued<br />
share<br />
capital<br />
Attributable to shareholders Minority<br />
interests<br />
Share Retained Other Total<br />
premium<br />
reserve<br />
earnings reserves<br />
Page 17 of 18<br />
Total<br />
equity<br />
140,715,535 46,359 344,326 677,636 50,379 1,118,700 323 1,119,023<br />
Foreign currency translation<br />
Cash flow hedges/net<br />
5,524 - (5,617) 8,821 8,728 93 8,821<br />
investment hedges<br />
-<br />
-<br />
- (32,267) (32,267) - (32,267)<br />
Share based payments - - 14,099 - 14,099 - 14,099<br />
Net income directly recognised in equity<br />
5,524<br />
- 8,482 (23,446) (9,440) 93 (9,347)<br />
Profit for the year - - 262,885 - 262,885 3,881 266,766<br />
Total income and expense for the year<br />
5,524<br />
-<br />
271,367<br />
(23,446)<br />
253,445<br />
3,974<br />
257,419<br />
Stock dividend 1,432,296 476 (476) - - 0 - 0<br />
Share options/ bonus shares 1,175,850 391 19,207 - - 19,598 - 19,598<br />
Cash dividend - - (58,306) - (58,306) - (58,306)<br />
At 31 December 2007 143,323,681 52,750 363,057 890,697 26,933 1,333,437 4,297 1,337,734<br />
Foreign currency translation<br />
Cash flow hedges/net<br />
(2,740) - 2,933 (10,669) (10,476) (189) (10,665)<br />
investment hedges<br />
-<br />
-<br />
- (269,475) (269,475) - (269,475)<br />
Share based payments - - 16,842 - 16,842 - 16,842<br />
Net income directly recognised in equity<br />
(2,740)<br />
- 19,775 (280,144) (263,109) (189) (263,298)<br />
Profit for the year - - 223,172 - 223,172 4,703 227,875<br />
Total income and expense for the year<br />
(2,740)<br />
-<br />
242,947<br />
(280,144)<br />
(39,937)<br />
4,514<br />
(35,423)<br />
Stock dividend 1,300,774 498 (498) - - 0 - 0<br />
Share options/ bonus shares 989,533 377 20,715 - - 21,092 - 21,092<br />
Cash dividend - - (79,864) - (79,864) (2,604) (82,468)<br />
At 31 December <strong>2008</strong> 145,613,988 50,885 383,274 1,053,780 (253,211) 1,234,728 6,207 1,240,935<br />
Within retained earnings an amount of US$ 102.0 million (2007: US$ 100.3 million) relates to equity of joint ventures and<br />
other non-distributable items and should therefore be treated as legal reserve. Furthermore a legal reserve of US$ 15.4<br />
(2007: US$ 3.4 million) should be maintained in respect of capitalised development expenditures.
Consolidated cash flow statement<br />
For the years ended 31 December in thousands of US Dollars<br />
<strong>2008</strong> 2007<br />
Cash flow from operating activities<br />
Receipts from customers 2,958,493 2,537,426<br />
Payments to suppliers and employees (2,376,261) (2,203,177)<br />
Income tax received / (paid) (5,254) (3,187)<br />
Net cash from operating activities 576,978 331,062<br />
Cash flow from investing activities<br />
Interest received 22,861 19,156<br />
Interest paid (64,017) (35,620)<br />
Investment in property, plant and equipment (987,570) (555,757)<br />
Investment in intangible fixed assets (12,217) (3,365)<br />
Investment in associated and group companies - -<br />
Disposals of property, plant and equipment 9,833 3,659<br />
Disposal of intangible fixed assets - -<br />
Dividends received from associated companies 2,535 1,964<br />
Net cash from investing activities (1,028,575) (569,963)<br />
Cash flow from financing activities<br />
Proceeds from issue of shares 12,141 16,898<br />
Additions to borrowings and loans 682,350 383,472<br />
Repayments of borrowings and loans (204,967) (170,919)<br />
Investments in other financial fixed assets (1,488) (2,080)<br />
Dividends paid to shareholders (79,864) (58,284)<br />
Net cash from financing activities 408,172 169,087<br />
Net increase in cash and cash equivalents (43,425) (69,814)<br />
Cash and cash equivalents at 1 January 274,088 339,687<br />
Net cash divestments - (286)<br />
Currency differences (526) 4,501<br />
Cash and cash equivalents at 31 December<br />
Page 18 of 18<br />
230,137<br />
274,088<br />
The reconciliation of the cash and cash equivalents as at 31 December with the corresponding amounts in the balance<br />
sheet is as follows:<br />
<strong>2008</strong> 2007<br />
Cash and cash equivalents 230,329 280,684<br />
Bank overdrafts (192) (6,596)<br />
Cash and cash equivalents at 31 December<br />
230,137<br />
274,088


