James King - ipenz
James King - ipenz
James King - ipenz

You also want an ePaper? Increase the reach of your titles
YUMPU automatically turns print PDFs into web optimized ePapers that Google loves.
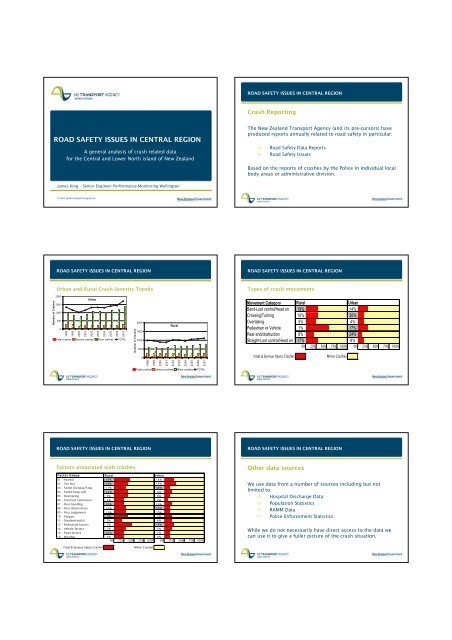
ROAD SAFETY ISSUES IN CENTRAL REGION<br />
Number of Crashes<br />
A general analysis of crash related data<br />
for the Central and Lower North island of New Zealand<br />
<strong>James</strong> <strong>King</strong> – Senior Engineer Performance Monitoring Wellington<br />
E-mail: james.king@nzta.govt.nz<br />
ROAD SAFETY ISSUES IN CENTRAL REGION<br />
Urban and Rural Crash Severity Trends<br />
2000<br />
1500<br />
1000<br />
500<br />
0<br />
1998<br />
1999<br />
2000<br />
2001<br />
Urban<br />
2002<br />
2003<br />
2004<br />
2005<br />
2006<br />
2007<br />
Fatal crashes Serious crashes Minor crashes TOTAL<br />
Number of Crashes<br />
2000<br />
1500<br />
1000<br />
ROAD SAFETY ISSUES IN CENTRAL REGION<br />
Factors associated with crashes<br />
500<br />
0<br />
1998<br />
1999<br />
2000<br />
2001<br />
Rural<br />
2002<br />
2003<br />
2004<br />
2005<br />
2006<br />
Fatal crashes Serious crashes Minor crashes TOTAL<br />
Factor Group Rural Urban<br />
01 - Alcohol 19% 14%<br />
02 - Too fast 35% 15%<br />
03 - Failed Giveway/Stop 11% 34%<br />
04 - Failed Keep Left 12% 4%<br />
05 - Overtaking 3% 3%<br />
06 - Incorrect Lane/posn 7% 9%<br />
07 - Poor handling 35% 14%<br />
08 - Poor Observation 31% 55%<br />
09 - Poor judgement 13% 10%<br />
10 - Fatigue 7% 2%<br />
11 - Disabled/old/ill 2% 4%<br />
12 - Pedestrian factors 1% 18%<br />
14 - Vehicle factors 7% 5%<br />
15 - Road factors 20% 7%<br />
16 - Weather 5% 3%<br />
0% 25% 50% 75% 100% 0% 25% 50% 75% 100%<br />
Fatal & Serious Injury Crashes Minor Crashes<br />
2007<br />
ROAD SAFETY ISSUES IN CENTRAL REGION<br />
Crash Reporting<br />
The New Zealand Transport Agency (and its pre-cursors) have<br />
produced reports annually related to road safety in particular:<br />
Road Safety Data Reports<br />
Road Safety Issues<br />
Based on the reports of crashes by the Police in individual local<br />
body areas or administrative division.<br />
ROAD SAFETY ISSUES IN CENTRAL REGION<br />
Types of crash movements<br />
Movement Category Rural Urban<br />
Bend-Lost control/Head on 19% 14%<br />
Crossing/Turning 10% 30%<br />
Overtaking 5% 4%<br />
Pedestrian vs Vehicle 1% 17%<br />
Rear end/obstruction 8% 24%<br />
Straight-Lost control/Head on 17% 8%<br />
0% 25% 50% 75% 100% 0% 25% 50% 75% 100%<br />
Fatal & Serious Injury Crashes Minor Crashes<br />
ROAD SAFETY ISSUES IN CENTRAL REGION<br />
Other data sources<br />
We use data from a number of sources including but not<br />
limited to:<br />
Hospital Discharge Data<br />
Population Statistics<br />
RAMM Data<br />
Police Enforcement Statistics<br />
While we do not necessarily have direct access to the data we<br />
can use it to give a fuller picture of the crash situation.
Number of Offences/10<br />
Number of Crashes<br />
ROAD SAFETY ISSUES IN CENTRAL REGION<br />
Speed Offences by 1000 population<br />
Hospital to Crash Casualty Comparisons<br />
Number of Crash Casualties<br />
2000<br />
18 0 0<br />
16 0 0<br />
14 0 0<br />
12 0 0<br />
10 0 0<br />
800<br />
600<br />
400<br />
200<br />
0<br />
1995 1996 1997 1998 1999 2000 2001 2002 2003 2004 2005 2006 2007<br />
Year of Event<br />
Gisborne RC Hawkes Bay RC Manawatu-Wanganui RC<br />
Taranaki RC Wellington RC Taranaki DHB<br />
Gisborne DHB Hawkes Bay DHB Manawatu-Wanganui DHB<br />
Wellington DHB<br />
ROAD SAFETY ISSUES IN CENTRAL REGION<br />
Alcohol Offences/Crashes<br />
600<br />
500<br />
400<br />
300<br />
200<br />
100<br />
0<br />
11%<br />
Carterton DC<br />
13%<br />
Central Hawkes Bay DC<br />
14%<br />
Gisborne DC<br />
11%<br />
Hastings DC<br />
10%<br />
Horowhenua DC<br />
10%<br />
Hutt City<br />
9%<br />
10%<br />
Kapiti DC<br />
Alcohol Offences Alcohol Related Crashes<br />
ROAD SAFETY ISSUES IN CENTRAL REGION<br />
Speed and Population<br />
900<br />
800<br />
700<br />
600<br />
500<br />
400<br />
300<br />
200<br />
100<br />
0<br />
Carterton DC<br />
Central Hawkes Bay DC<br />
Gisborne DC<br />
Manawatu DC<br />
8%<br />
Masterton DC<br />
12%<br />
Napier CC<br />
9%<br />
New Plymouth CC<br />
8%<br />
Palmerston North CC<br />
9%<br />
Porirua CC<br />
8%<br />
Rangitikei DC<br />
9%<br />
Ruapehu DC<br />
16%<br />
South Taranaki DC<br />
South Wairarapa DC<br />
11%<br />
Stratford DC<br />
10%<br />
Tararua DC<br />
11%<br />
Upper Hutt CC<br />
7%<br />
3000<br />
2500<br />
2000<br />
150 0<br />
1000<br />
Note: label is percentage of reported crashes<br />
2003 2004 2005 2006 2007<br />
Hastings DC<br />
Horowhenua DC<br />
Hutt City<br />
Kapiti DC<br />
Manawatu DC<br />
Masterton DC<br />
Napier CC<br />
New Plymouth CC<br />
Palmerston North CC<br />
Porirua CC<br />
Rangitikei DC<br />
Ruapehu DC<br />
South Taranaki DC<br />
South Wairarapa DC<br />
Stratford DC<br />
Tararua DC<br />
500<br />
0<br />
Upper Hutt CC<br />
Number of Hospital Casualties<br />
12%<br />
Wairoa DC<br />
Wairoa DC<br />
13%<br />
Wanganui CC<br />
Wanganui CC<br />
6%<br />
Wellington CC<br />
Wellington CC<br />
ROAD SAFETY ISSUES IN CENTRAL REGION<br />
Alcohol and Speed<br />
Using Police Statistics on offences detected we can compare<br />
crash data for trends and indicators that suggest where<br />
enforcement action might be targeted.<br />
Number of Offences/100<br />
Number of Crashes<br />
Number of Offences<br />
per 1000 population<br />
ROAD SAFETY ISSUES IN CENTRAL REGION<br />
Speed Offences/Crashes<br />
1000<br />
900<br />
800<br />
700<br />
600<br />
500<br />
400<br />
300<br />
200<br />
100<br />
0<br />
14%<br />
Carterton DC<br />
19%<br />
Central Hawkes Bay DC<br />
12%<br />
Gisborne DC<br />
16%<br />
Hastings DC<br />
17%<br />
Horowhenua DC<br />
Speed Offences Speed Related Crashes<br />
15%<br />
Hutt City<br />
ROAD SAFETY ISSUES IN CENTRAL REGION<br />
Speed Offence Detection<br />
70<br />
60<br />
50<br />
40<br />
30<br />
20<br />
10<br />
0<br />
Gisborne<br />
14%<br />
Kapiti DC<br />
18%<br />
Manawatu DC<br />
15%<br />
Masterton DC<br />
2003 2004 2005 2006 2007<br />
Hawkes<br />
Bay<br />
Manawatu-<br />
Wanganui<br />
Taranaki<br />
Wellington<br />
12%<br />
Napier CC<br />
13%<br />
New Plymouth CC<br />
11%<br />
Palmerston North CC<br />
Number of Offences<br />
per million vkt<br />
16%<br />
Porirua CC<br />
15%<br />
22%<br />
Rangitikei DC<br />
Ruapehu DC<br />
22%<br />
South Taranaki DC<br />
23%<br />
South Wairarapa DC<br />
17%<br />
20%<br />
Note: label is percentage of reported crashes<br />
19%<br />
Stratford DC<br />
4500<br />
4000<br />
3500<br />
3000<br />
2500<br />
2000<br />
1500<br />
1000<br />
500<br />
0<br />
2003 2004 2005 2006 2007<br />
Gisborne<br />
Hawkes Bay<br />
Tararua DC<br />
Manawatu-<br />
Wanganui<br />
Upper Hutt CC<br />
20%<br />
Wairoa DC<br />
Taranaki<br />
16%<br />
Wanganui CC<br />
11%<br />
Wellington CC<br />
Wellington
ROAD SAFETY ISSUES IN CENTRAL REGION<br />
Seatbelt Usage<br />
Percentage<br />
100<br />
80<br />
60<br />
40<br />
20<br />
0<br />
1998<br />
1999<br />
Front Seatbelt Wearing<br />
Gisborne Hawkes Bay<br />
Taranaki Manawatu-Wanganui<br />
Wellington<br />
2000<br />
2001<br />
2002<br />
Percentage<br />
2003<br />
100<br />
80<br />
60<br />
40<br />
20<br />
0<br />
2004<br />
1999<br />
2005<br />
2000<br />
2006<br />
2001<br />
2007<br />
Percentage<br />
100<br />
80<br />
60<br />
40<br />
20<br />
0<br />
Child Restraint Use<br />
2002<br />
2003<br />
2004<br />
1998<br />
2005<br />
1999<br />
2000<br />
Back Seatbelt Wearing<br />
Gisborne Hawkes Bay<br />
Taranaki Manawatu-Wanganui<br />
Wellington<br />
2006<br />
2001<br />
Gisborne Hawkes Bay<br />
Taranaki Manawatu-Wanganui<br />
Wellington<br />
ROAD SAFETY ISSUES IN CENTRAL REGION<br />
Driver Licences<br />
Type of licence held by<br />
“at fault” drivers in<br />
crashes can be<br />
examined to give an<br />
indication for road<br />
safety activities related<br />
to licensing.<br />
Wellington City<br />
Wanganui District<br />
Wairoa District<br />
Upper Hutt City<br />
Tararua District<br />
Stratford District<br />
South Wairarapa District<br />
South Taranaki District<br />
Ruapehu District<br />
Rangitikei District<br />
Porirua City<br />
Palmerston North City<br />
New Plymouth District<br />
Napier City<br />
Masterton District<br />
Manawatu District<br />
Kapiti Coast District<br />
Hutt City<br />
Horowhenua District<br />
Hastings District<br />
Gisborne District<br />
Central Hawkes Bay District<br />
Carterton District<br />
0% 10% 20% 30% 40% 50% 60% 70% 80% 90% 100%<br />
2007<br />
2002<br />
2003<br />
Driver Licence Type in %<br />
Never Licensed Disqualified Expired Forbidden Wrong Class<br />
Overseas Learner Restricted Full<br />
ROAD SAFETY ISSUES IN CENTRAL REGION<br />
Crash Data Conclusions<br />
o Alcohol crashes percentages have reduced in the last 10<br />
years although no change in the number of crashes have<br />
been observed.<br />
o Restraint use may have peaked and most probably can only<br />
stay at the same level in future.<br />
o Speed related crashes are increasing in Urban areas.<br />
o Rural area crashes are a reducing percentage of crashes<br />
but the numbers are not.<br />
See http://www.ltsa.govt.nz/performance/index.html for individual authority data reports<br />
2004<br />
2005<br />
2006<br />
2007<br />
Number of Offences in Hundreds<br />
ROAD SAFETY ISSUES IN CENTRAL REGION<br />
Restraint and Unlicensed Driver Enforcement<br />
160<br />
140<br />
120<br />
100<br />
80<br />
60<br />
40<br />
20<br />
0<br />
Unlicenced Driver Restraints<br />
Carterton DC<br />
Central Hawkes Bay DC<br />
Gisborne DC<br />
Hastings DC<br />
Horowhenua DC<br />
Hutt City<br />
Kapiti DC<br />
Manawatu DC<br />
Masterton DC<br />
Napier CC<br />
New Plymouth CC<br />
Palmerston North CC<br />
Porirua CC<br />
Rangitikei DC<br />
Ruapehu DC<br />
South Taranaki DC<br />
South Wairarapa DC<br />
Stratford DC<br />
Tararua DC<br />
Upper Hutt CC<br />
Wairoa DC<br />
Wanganui CC<br />
Wellington CC<br />
ROAD SAFETY ISSUES IN CENTRAL REGION<br />
Crash Data Conclusions<br />
o Crashes, and casualties, in Central Region, have increased<br />
in the last 5 years principally in minor urban crashes.<br />
o Lost of control is more prominent in rural crashes.<br />
o Crossing/turning, Pedestrian vs. Vehicle and Rear<br />
end/obstructions are predominant in urban areas.<br />
o For vulnerable road users, cyclist and motorcyclist crashes<br />
are increasing, pedestrian incidents are steady.<br />
o Evidence suggests that Police enforcement may be uneven<br />
across the Region.<br />
ROAD SAFETY ISSUES IN CENTRAL REGION<br />
SAFETY IMPROVEMENT ACTIVITIES<br />
The NZTA will continue to support road safety activities<br />
such as:<br />
o Crash Reduction Studies<br />
o Road Safety Action Plans<br />
o LTCCP’s<br />
o Road Safety Works<br />
We would also encourage roading authorities to establish a<br />
‘Deficiency Database and Prioritisation’ process as an<br />
element of their road safety planning processes.