A Rocha Portugal Observatory Report 2009-2010
A Rocha Portugal Observatory Report 2009-2010
A Rocha Portugal Observatory Report 2009-2010

You also want an ePaper? Increase the reach of your titles
YUMPU automatically turns print PDFs into web optimized ePapers that Google loves.
84 A <strong>Rocha</strong> <strong>Portugal</strong> <strong>Observatory</strong> <strong>Report</strong> <strong>2009</strong>-<strong>2010</strong><br />
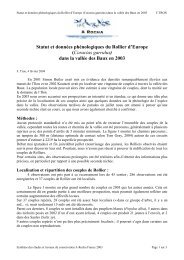
Figure 1 Average monthly maximum and minimum air temperatures for <strong>2009</strong> and averages for 2003-<br />
2008. To show the across year variation in the 2003-2008 data, error bars are plotted which<br />
represent one standard error.<br />
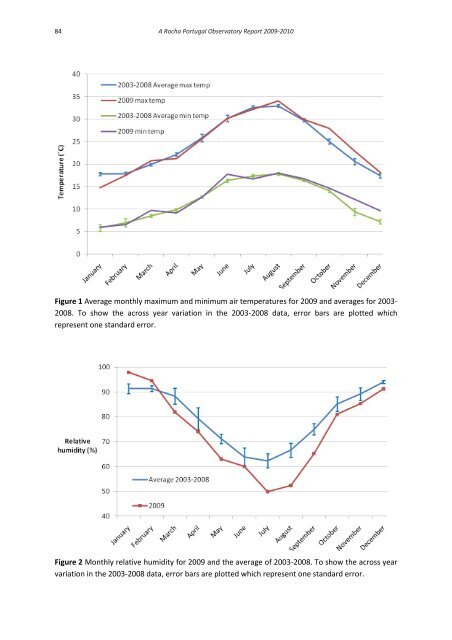
Figure 2 Monthly relative humidity for <strong>2009</strong> and the average of 2003-2008. To show the across year<br />
variation in the 2003-2008 data, error bars are plotted which represent one standard error.