A Rocha Portugal Observatory Report 2009-2010
A Rocha Portugal Observatory Report 2009-2010
A Rocha Portugal Observatory Report 2009-2010

You also want an ePaper? Increase the reach of your titles
YUMPU automatically turns print PDFs into web optimized ePapers that Google loves.
90 A <strong>Rocha</strong> <strong>Portugal</strong> <strong>Observatory</strong> <strong>Report</strong> <strong>2009</strong>-<strong>2010</strong><br />
Rainfall<br />
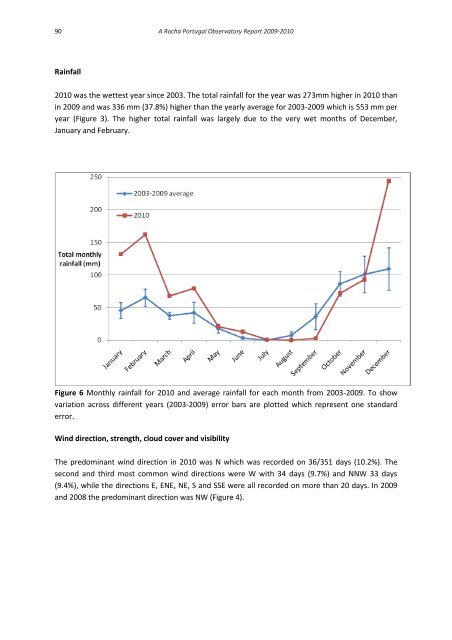
<strong>2010</strong> was the wettest year since 2003. The total rainfall for the year was 273mm higher in <strong>2010</strong> than<br />
in <strong>2009</strong> and was 336 mm (37.8%) higher than the yearly average for 2003-<strong>2009</strong> which is 553 mm per<br />
year (Figure 3). The higher total rainfall was largely due to the very wet months of December,<br />
January and February.<br />
Figure 6 Monthly rainfall for <strong>2010</strong> and average rainfall for each month from 2003-<strong>2009</strong>. To show<br />
variation across different years (2003-<strong>2009</strong>) error bars are plotted which represent one standard<br />
error.<br />
Wind direction, strength, cloud cover and visibility<br />
The predominant wind direction in <strong>2010</strong> was N which was recorded on 36/351 days (10.2%). The<br />
second and third most common wind directions were W with 34 days (9.7%) and NNW 33 days<br />
(9.4%), while the directions E, ENE, NE, S and SSE were all recorded on more than 20 days. In <strong>2009</strong><br />
and 2008 the predominant direction was NW (Figure 4).