Revenue - Trimble
Revenue - Trimble
Revenue - Trimble

You also want an ePaper? Increase the reach of your titles
YUMPU automatically turns print PDFs into web optimized ePapers that Google loves.
<strong>Trimble</strong> (NASDAQ: TRMB)<br />
Corporate Overview
Safe Harbor<br />
The forward-looking statements made in this presentation and<br />
any subsequent Q&A period, are subject to risks<br />
and uncertainties. <strong>Trimble</strong>'s actual results may differ materially<br />
from those currently anticipated due to a number of factors,<br />
including the competitive nature of the marketplace, the<br />
condition of the worldwide economy and other factors detailed<br />
in the company's form 10K for 2005 and subsequent 10Qs or<br />
other documents filed with the Securities and Exchange<br />
Commission.
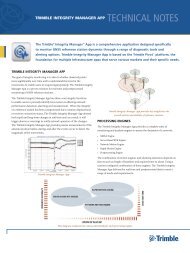
Our strategy has enabled consistently improving financial<br />
performance and an ability to project ourselves worldwide<br />
Millions of Dollars<br />
Millions of Dollars<br />
Millions of Dollars<br />
$900<br />
$800<br />
$700<br />
$600<br />
$500<br />
$400<br />
$300<br />
$200<br />
$100<br />
$0<br />
$160<br />
$140<br />
$120<br />
$100<br />
$80<br />
$60<br />
$40<br />
$20<br />
$0<br />
-$20<br />
-$40<br />
$100<br />
$90<br />
$80<br />
$70<br />
$60<br />
$50<br />
$40<br />
$30<br />
$20<br />
$10<br />
$0<br />
<strong>Revenue</strong><br />
1995 1997 1999 2001 2003 2005 TTM<br />
Non-GAAP OI<br />
1995 1996 1997 1998 1999 2000 2001 2002 2003 2004 2005 TTM<br />
R&D Spending<br />
1995 1997 1999 2001 2003 2005 TTM<br />
20%<br />
16%<br />
12%<br />
8%<br />
4%<br />
0%<br />
20.0%<br />
16.0%<br />
12.0%<br />
8.0%<br />
4.0%<br />
0.0%<br />
-4.0%<br />
-8.0%<br />
-12.0%<br />
54% 25% 11%<br />
10%<br />
2005 <strong>Revenue</strong><br />
Manufacturing & Hardware R&D<br />
California Germany<br />
Canada Japan<br />
China Ohio<br />
France Sweden<br />
Virginia Oregon<br />
Mexico<br />
Software Development<br />
Arizona Japan<br />
Colorado New Zealand<br />
Germany Oregon<br />
France Virginia<br />
Texas Florida<br />
Australia
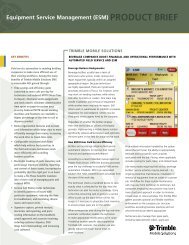
<strong>Trimble</strong> is typically categorized in “GPS Space.” In reality<br />
that space is a collection of applications with differing<br />
requirements & price points.<br />
“System Price”<br />
$25,000<br />
$2,500<br />
$250<br />
Asset & Fleet<br />
Management<br />
Consumer<br />
GIS<br />
Agricultural<br />
Guidance &<br />
Monitoring<br />
Meters Sub-meter Centimeters Millimeters<br />
Accuracy<br />
Construction<br />
Surveying
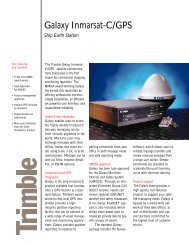
<strong>Trimble</strong>’s post 1999 focus has been on capturing the<br />
technically more demanding application solutions space<br />
“System Price”<br />
$25,000<br />
$2,500<br />
$250<br />
Asset & Fleet<br />
Management<br />
Consumer<br />
GIS<br />
Agricultural<br />
Guidance &<br />
Monitoring<br />
Meters Sub-meter Centimeters Millimeters<br />
Accuracy<br />
Construction<br />
Surveying
<strong>Trimble</strong>’s technology path is built around the<br />
concept of technological convergence as the basis<br />
for solving the application problem<br />
Cellular<br />
Radio<br />
Bluetooth<br />
etc.<br />
Firmware<br />
Applications<br />
ASP or discrete delivery<br />
etc.<br />
GPS<br />
Laser<br />
Optical<br />
Inertial<br />
etc.
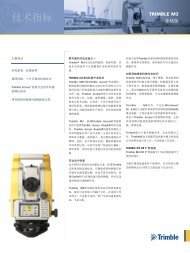
<strong>Trimble</strong>’s “applications centric” concept of the market is<br />
built around a number of defining elements<br />
2005 <strong>Revenue</strong>s<br />
“Box” Products<br />
End User<br />
Solutions<br />
• Productivity improvement is central<br />
• Position or location is part of the solution<br />
• Centered on the field or field to back office<br />
• Underserved – significant penetration potential<br />
• Significant applications software content<br />
• Price reflects value<br />
• Defensibility based on “whole product solution”<br />
• Compelling market leadership<br />
• Pioneering distribution<br />
• Configuration & localization<br />
• Search for adjacencies
Our strategic path requires a management culture<br />
framed around aspiration, intensity, focus and discipline<br />
<strong>Trimble</strong>’s values:<br />
• Coupling all our efforts to market objectives, staying centered on a clear<br />
definition of our customers and their needs.<br />
• Aggressive entrepreneurship and disciplined risk taking enabled by clear<br />
strategies.<br />
• Brilliant innovation driven by long term vision.<br />
• Speed and decisiveness built on precision in our thinking, planning, and<br />
communication.<br />
• Accountability for our results.<br />
• An organizational environment consistent with the values of teamwork,<br />
transparency, integrity, and respect.
Our strategic focus is on three primary growth platforms.<br />
The fourth leg of the strategy is opportunistic.<br />
Connected Construction Site Precision Agriculture<br />
Mobile & Field Worker Advanced Devices
<strong>Trimble</strong>’s growth path utilizes multiple mechanisms<br />
• Penetration of existing markets<br />
• Market consolidation<br />
• Product extension<br />
• Market extension<br />
• New businesses<br />
Indicative Market Penetration Levels<br />
Survey
Our portfolio has demonstrated the capability of<br />
sustained growth<br />
IN $ M 2002 2005<br />
CAGR<br />
Engineering & Construction $ 319.6 $ 524.5 18%<br />
Field Solutions $ 67.3 $ 127.8 24%<br />
Mobile Solutions $ 8.5 $ 31.5 55%<br />
Advanced Devices $ 71.3 $ 91.1 9%<br />
TRIMBLE $ 466.6 $ 774.9 18%<br />
Generating 56%<br />
CAGR in operating<br />
earnings
The markets <strong>Trimble</strong> addresses today have unpenetrated<br />
potential greater than $5 billion<br />
<strong>Trimble</strong>’s future growth is less defined by traditional<br />
concepts of “market growth” and more by the rate at<br />
which we can penetrate the market<br />
Penetration enablers and constraints:<br />
• Market segmentation and insight<br />
•Product<br />
• Distribution<br />
• Market conservatism & marketing at the frontier
Acquisitions and other deals are not central to our growth<br />
strategy – they provide a targeted role and have tended to<br />
be relatively small<br />
Acquisitions Post 1999<br />
Spectra Precision<br />
TDS<br />
Levelite<br />
Grid Data<br />
Applanix<br />
JEC<br />
Mensi<br />
TracerNet<br />
GeoNav<br />
Pacific Crest<br />
Apache<br />
MobileTech<br />
Advanced Public Safety<br />
XYZ of GPS<br />
Quantm<br />
Ventures<br />
Caterpillar <strong>Trimble</strong> Control Technologies<br />
Nikon <strong>Trimble</strong><br />
Acquisition Criteria<br />
• Market beachhead<br />
• Market extension<br />
• Technology or product gap
Objectives for the Day<br />
• Demonstrate <strong>Trimble</strong>’s unique capabilities and<br />
characteristics<br />
• Demonstrate <strong>Trimble</strong>’s emerging management<br />
competency and depth<br />
• Provide the basis of future credibility based on the<br />
soundness of our strategy and the capabilities of our<br />
management to execute that strategy
Mobility solutions…<br />
beyond vehicle tracking
Beyond vehicle tracking…<br />
Hardware<br />
Applications<br />
Software<br />
Integration Services
Fleet market<br />
Local fleet segment:<br />
• 2005-2009 CAGR = 16%<br />
• Penetration = < 10%
Mobile worker market<br />
All workers without<br />
desks<br />
Addressable targets<br />
based on company size<br />
Likely technology<br />
adopters<br />
U.S. Market Opportunity<br />
30 Million<br />
workers<br />
13.5 Million<br />
workers<br />
5 Million<br />
workers
Market trends<br />
• Sophisticated applications<br />
• New compliance rules<br />
• Higher fuel costs<br />
• Combined vehicle and worker solutions
Competitive landscape<br />
Market is fragmented and will consolidate along application lines<br />
C.J. Driscoll & Associates<br />
Local Fleet Units<br />
AirIQ<br />
All other<br />
@Road<br />
Teletrac<br />
Remote Dynamics<br />
Fleetilla<br />
Discrete Wireless<br />
<strong>Trimble</strong><br />
Wireless Matrix<br />
Intertrak<br />
Qualcom<br />
UPS Logistics
Sustainable advantages<br />
• High-value, under-served verticals<br />
• Specialized applications<br />
• Integration into back office systems<br />
• Integrated vehicle and worker applications
Integrated applications<br />
Vehicle Productivity<br />
Messaging<br />
Reporting<br />
Tracking<br />
Auto-Status<br />
Vehicle Based Applications Handheld Applications<br />
Compliance/Diagnostics<br />
DOT Logs<br />
Fuel Tax<br />
Parameter changes<br />
Warranty<br />
Route Accounting<br />
DSD<br />
Pre-sales<br />
Merchandising<br />
Settlements<br />
Integrated vehicle and worker applications leads to:<br />
• stronger customer link<br />
• improved competitive position<br />
• long-term recurring revenue<br />
Field Service<br />
Work Orders<br />
Parts ordering<br />
Service Tickets
Our current market segments<br />
• Construction supply<br />
• Utilities<br />
• Municipalities<br />
• Construction<br />
• Direct store delivery<br />
• Public safety<br />
Hardware & Apps Software Integration Services
Cost of Solution<br />
Mobility management value chain<br />
Vehicle Productivity<br />
Mobile Field Work Force Productivity<br />
Automatic Automatic<br />
Vehicle Vehicle Location Location<br />
(AVL) (AVL)<br />
Asset<br />
Tracking<br />
Messaging<br />
Messaging<br />
Dot-on-the-map<br />
- Regular reporting<br />
- Security<br />
- Exception queries<br />
2-way<br />
Driver<br />
Messaging<br />
Fleet<br />
Productivity<br />
Automatic Automatic<br />
Statusing Statusing<br />
Location-based<br />
Sensor-based<br />
Machine-to-machine<br />
Delivery loop<br />
integration<br />
Dispatch Dispatch<br />
Integration<br />
Integration<br />
Complexity and Value<br />
ERP ERP<br />
Integration<br />
Integration<br />
Advanced CRM<br />
Integrated auto<br />
statusing, Cargo<br />
status Delivery status<br />
Dispatch and<br />
Auto-Status<br />
Payroll<br />
Maintenance<br />
Billing<br />
Order Entry<br />
Accounting<br />
Supply Supply Chain Chain<br />
Integration<br />
Integration<br />
Real time asset<br />
allocation<br />
Dynamic rerouting<br />
Supply chain<br />
optimization<br />
Workforce<br />
Management<br />
Enterprise<br />
Direct Store Delivery<br />
Field Service
Server Platform<br />
ASP Platform<br />
Dual platform offerings<br />
Communication<br />
GIS Services<br />
Business logic<br />
Decision support<br />
Geo-coding<br />
Software<br />
Database<br />
Hot-zone logic<br />
Integration<br />
TMS DATA<br />
CENTER<br />
Wireless access<br />
Mapping<br />
Geo-coding<br />
Status<br />
Message routing<br />
Reporting<br />
Device management<br />
Configuration<br />
Over the air<br />
programming<br />
Open databases<br />
Application service
TrimTrac<br />
• Enhanced GPS sensitivity<br />
• Motion sensor<br />
• GSM communications<br />
• Minimum install<br />
• Multiple power options
Core vehicle applications<br />
• Vehicle tracking<br />
• Two-way messaging<br />
• Standard reporting<br />
Last known position<br />
Speeding & Stops<br />
Idle & Start time<br />
Vehicle Activity Summary<br />
Sites<br />
Vehicle Congregation<br />
Driver Activity & Usage<br />
• Auto-status (hot zones)<br />
• DriveSafe<br />
• J-Bus - diagnostics
MobileTech Solutions, Inc.<br />
• Dominant position in direct store<br />
delivery (DSD) market<br />
• Domain expertise in DSD and ERP<br />
system integration<br />
• Large fleet food delivery customer<br />
base of ~160,000<br />
• Customers need fleet and worker<br />
applications<br />
RoutePower
Advanced Public Safety, Inc.<br />
• Next vertical in mobile market<br />
• 400,000 total potential users<br />
• Basis for future software offerings<br />
• Cross-sell vehicle location solutions<br />
• Replace handheld devices with<br />
<strong>Trimble</strong> units<br />
PocketCitation
Uniquely positioned<br />
Advanced Public Safety<br />
<strong>Trimble</strong> Construction Services<br />
<strong>Trimble</strong> Component Technologies<br />
<strong>Trimble</strong> Mobile Solutions<br />
Mobile Worker<br />
and Fleet<br />
Management<br />
MobileTech Solutions<br />
<strong>Trimble</strong> Mapping/GIS<br />
Tripod Data Systems<br />
<strong>Trimble</strong> Outdoors
Focusing on the Future<br />
with the Connected Site<br />
LaVonne Frazier<br />
<strong>Trimble</strong> Navigation
Construction is an Information Technology Laggard*<br />
• Other industries have<br />
transformed productivity and<br />
quality through information<br />
technology<br />
– Airlines<br />
– Financial services<br />
– Logistics<br />
• Construction has principally<br />
relied on scale factors (bigger<br />
and faster) to create<br />
productivity improvements<br />
– not aggressive in<br />
reengineering processes<br />
Source: ASCE Journal Dec 2003<br />
*Update: 2006 National Construction Technology Survey<br />
39% Aggressive<br />
15% Early Adopters<br />
34% Somewhat Cautious Source: Constructech Magazine
Challenges Facing the Industry<br />
• Engineering and construction are generally separate processes<br />
• Information is traditionally paper based – Manual Process<br />
= EXPENSIVE<br />
• Data integrity is threatened due to manual re-entry<br />
• No standardized data and position information exchange<br />
REWORK!<br />
• Processes supporting project management are typically manual<br />
& labor intensive.
The Connected Site<br />
Providing the surveyor, engineer, and contractor on-demand<br />
location, asset, spatial, business management information and<br />
reporting solutions wherever and whenever needed.
Process Integration and the Connected Site<br />
will provide significant productivity benefits<br />
• Reduced rework<br />
• Efficient asset utilization<br />
• Timely design updates<br />
• Improved billing cycles<br />
• Improved bidding & planning
Seamless:<br />
Technology will enable radical, new solutions<br />
• Precision 3D position (mm/cm)<br />
• High density 3D surface data and imagery<br />
• Inexpensive location (5-10m) data<br />
• Machine control cross slope systems, lasers, sonic, total stations<br />
• Embedded information sensors<br />
• Wireless connectivity<br />
• Real time information networks (internet, other)<br />
• Information rich, geo-referenced data<br />
• Applications software<br />
Leading to new capabilities and seamless<br />
information flow throughout the process
Challenges Facing the Industry<br />
• Engineering and construction are generally separate processes<br />
• Information is traditionally paper based – Manual Process<br />
• Data integrity is threatened due to manual re-entry<br />
• No standardized data and position information exchange<br />
• Processes supporting project management are typically manual<br />
& labor intensive.
In <strong>Trimble</strong>’s World Today…<br />
Engineering, Surveying and Construction are<br />
integrated processes<br />
Survey<br />
Plan<br />
Process control<br />
through common<br />
project data<br />
Execute<br />
Build<br />
Design<br />
Improve<br />
Finishing<br />
Bulk Earthworks<br />
Manage
Challenges Facing the Industry<br />
• Engineering and construction are generally separate processes<br />
• Information is traditionally paper based – Manual Process<br />
• Data integrity is threatened due to manual re-entry<br />
• No standardized data and position information exchange<br />
• Processes supporting project management are typically manual<br />
& labor intensive.
From… Construction Staking<br />
Traditional Construction<br />
Staking
Today…<br />
To… Construction Positioning<br />
Doha Airport Project<br />
Doha Airport Project
Enabled by…<br />
digital data flow throughout the entire process<br />
OFFICE<br />
Field Systems
Challenges Facing the Industry<br />
• Engineering and construction are generally separate processes<br />
• Information is traditionally paper based – Manual Process<br />
• Data integrity is threatened due to manual re-entry<br />
• No standardized data and position information exchange<br />
• Processes supporting project management are<br />
typically manual & labor intensive.
Today<br />
Discrete sensors<br />
Future<br />
Everything -<br />
platform becomes a<br />
host for a sensor &<br />
a link in a network<br />
Information Sensors:<br />
process changes –Supply Chain<br />
<strong>Trimble</strong> Trimtrac<br />
GPS location, motion<br />
sensing, cellular link,<br />
RFID tag transceiver.<br />
Active Tags, etc.<br />
for equipment,<br />
containers,<br />
pallets...
Wireless Connectivity:<br />
real time data with unconstrained bandwidth<br />
• Newer communications standards<br />
(GPRS, 3G, etc.) enable large amounts of<br />
data to be shared at relatively low costs<br />
• Critical success factor is avoiding outages<br />
– important to support multiple<br />
techniques (radio, cellular, satellite, etc).
Information Rich, Geo-Referenced Data:<br />
information in context<br />
Sensing technology is moving<br />
beyond traditional airborne<br />
techniques and will include<br />
multiple sensors with high<br />
integration.<br />
Geo-referenced data bases will<br />
become increasingly enabled.
3D Data & Systems<br />
• Real time 3D mapping<br />
• Machine update of plan changes<br />
Machine Mgmt<br />
• Equipment location<br />
• Machine utilization<br />
- Hours of use on project<br />
- Cycle monitoring<br />
Elements of the Connected Site<br />
Asset Management<br />
•Asset location<br />
•Dispatch<br />
•Asset utilization reports<br />
•Equipment status<br />
Future Products
<strong>Trimble</strong> – Agriculture Division<br />
The line everyone follows
<strong>Trimble</strong> guidance is a<br />
replacement technology<br />
GPS based guidance solutions<br />
are a replacement technology<br />
to mechanical based guidance<br />
solutions for all field operations<br />
in Agriculture<br />
Spraying<br />
Harvest<br />
Planting<br />
Spraying<br />
Spreading<br />
Field Prep<br />
Row Marker<br />
Foam Marker
Why GPS Guidance?<br />
• Payback is easy to understand<br />
– Increased accuracy provides<br />
• Fuel and input savings<br />
• Time and labor savings<br />
• Existing vehicles used more effectively<br />
• Operate longer hours at critical times
Why GPS Guidance?<br />
• Expands to more solutions<br />
– Growers see payback from guidance – then<br />
interested in expanding their investment<br />
• Higher accuracy<br />
• More precision agriculture features
What’s important in a guidance<br />
system<br />
• Cost<br />
• GPS accuracy<br />
• Cross track error tolerance<br />
– Filtering<br />
– Terrain compensation<br />
• Operational speed<br />
• Farming patterns<br />
– straight, contour, pivot, etc.<br />
• Data logging and transfer<br />
• Precision Ag features<br />
• Platform availability<br />
– tractor, sprayer, combine
AgGPS Guidance Solutions<br />
EZ-Guide ® Plus system<br />
Simple guidance<br />
Save fuel and inputs<br />
EZ-Steer TM system<br />
Affordable<br />
hands-free<br />
farming<br />
Autopilot TM system<br />
Repeatable<br />
performance<br />
with advanced<br />
features
Market segmentation is key to offering<br />
the right solution<br />
High Value Crops<br />
Vegetables & Fruit<br />
$2000/acre<br />
Accuracy: 1”<br />
US Acres: 19M<br />
Broad Acre Crops<br />
Wheat, Barley, Rye<br />
$120/acre<br />
Accuracy: 6”-10”<br />
US Acres: 80M<br />
Row Crops<br />
Corn, Soy<br />
$225/acre<br />
Accuracy: 1” – 3”<br />
US Acres: 156M
Our target customer is the farmer<br />
Prioritized worldwide on market potential, based upon<br />
technology uptake, acreage & economy<br />
– North America, Australia, South America, Europe
Total available guidance market is large,<br />
and penetration to date is small<br />
Examples of total available market estimation variables:<br />
•Less than 20% penetration rate by all competitors, sales cumulative over time<br />
•Some of <strong>Trimble</strong>’s assumptions on total available market (TAM):<br />
•Assumes 7-10 year vehicle life<br />
•Tractors >100 hp<br />
•Might not count harvesters & sprayers, assuming reuse of equipment between the vehicles<br />
•Sources – Association of Equipment Manufacturers (AEM), and similar publications
Precision Ag Trends in the Market<br />
• Validation & mainstreaming of guidance<br />
• Grower acceptance of guidance is high
Precision Ag Trends in the Market<br />
• Global competition among farmers<br />
• Consolidation of cab electronics
Our strategy continues to be<br />
aggressively capture market share in<br />
the guidance markets by<br />
– partnering with the best distribution partners<br />
– providing greater value (features & price) than the guidance<br />
technology that we are replacing<br />
– continuing towards integration of “best in class” precision<br />
agricultural electronics solutions
<strong>Trimble</strong>’s competitive<br />
advantages are:<br />
• Product innovation<br />
– EZ-Guide Plus<br />
– EZ-Steer & T2 terrain compensation<br />
– Autopilot & Autosense & Field Manager Display<br />
• Distribution partners<br />
– <strong>Trimble</strong> independent resellers<br />
– Case IH, New Holland, Ag Leader Technology, HARDI,<br />
etc…<br />
• Market share<br />
– largest Precision Ag electronics after market supplier<br />
– momentum
<strong>Trimble</strong> – Agriculture Division<br />
The line everyone follows
Survey & Infrastructure<br />
Analyst Day<br />
Pete Large<br />
Survey Division
Surveying: the industry we serve<br />
Utilities, AM/FM<br />
Engineering &<br />
Construction<br />
Public Sector<br />
The land surveying profession<br />
serves a need for high accuracy<br />
data collection, presentation<br />
and management in a diverse<br />
range of industries world-wide<br />
Natural Resources<br />
Mining, Oil & Gas<br />
Land<br />
Management Title<br />
/ Cadastral<br />
Scientific<br />
& Academic
Survey Division Solutions Portfolio<br />
Convenience<br />
Solutions<br />
Entry level brands<br />
offer easy-to-use<br />
solutions at lower<br />
price points<br />
Enabling Solutions<br />
Major capital investment for<br />
permanent fixed infrastructure<br />
Productivity<br />
Solutions<br />
Provide a higher<br />
return on a higher<br />
initial customer<br />
investment
Convenience Solutions<br />
For Land Surveyors who prefer traditional<br />
solutions and lower initial capital outlay
Convenience Solutions<br />
Provide entry level &<br />
conventional survey products<br />
through second distribution<br />
channel<br />
Tripod Data Systems<br />
Nikon-<strong>Trimble</strong> Co Ltd<br />
Exclusive distribution of<br />
Nikon survey products<br />
outside Japan<br />
Expanding distribution into<br />
low end and emerging<br />
markets world-wide<br />
Distributes Nikon and Spectra Precision<br />
Survey products in North America.<br />
Positioned for market penetration and share<br />
gains with large installed base in N America
Enabling Solutions<br />
The Infrastructure Customer is the<br />
high accuracy data services provider<br />
• Public Sector<br />
– National & Local Government<br />
– Departments of Transportation<br />
– Military<br />
– Scientific<br />
• Private Sector<br />
– Commercial data service providers<br />
– In-house engineering & surveying<br />
– <strong>Trimble</strong> Distributors<br />
– Natural Resources
Productivity Solutions Customer:<br />
The Professional Land Surveyor<br />
#1 World-Wide<br />
“We’d run 400-500 points a<br />
day using conventional<br />
methods and that would be<br />
a very good day. With<br />
Autolock and the ACU, we’d<br />
easily almost double that.”<br />
-Wyoming DOT<br />
<strong>Trimble</strong> one-person<br />
productivity solutions<br />
lower fixed crew<br />
labor costs by 50%<br />
while more than<br />
doubling output
Customer Productivity Gains
The <strong>Trimble</strong> Integrated Surveying<br />
solution combines <strong>Trimble</strong> market leading<br />
technologies in the field user interface,<br />
field sensors, GNSS Infrastructure, the<br />
wireless internet and office software into a<br />
truly Connected Site<br />
The <strong>Trimble</strong> IS Rover is a patented<br />
combination of an RTK GPS and a Robotic<br />
total station on a single survey pole
<strong>Trimble</strong> S6 Mag Drive<br />
A unique, patented, industry leading technology<br />
which integrates the angle encoders and servo<br />
drives into a single, silent, low power unit. It<br />
can turn twice as fast as any other solution on<br />
the market.
Key Survey Industry Trends:<br />
Passive Control to Active Control
Key Survey Industry Trends:<br />
‘2.5D’ to True 3D Surveying
Key Survey Industry Trends:<br />
Shift to Productivity Solutions<br />
“Using GPS reduced the overall project<br />
time…conventional leveling would’ve taken<br />
twice as long.”<br />
“This project was more technology than labor<br />
intense,” Newell says. “Instead of throwing<br />
man hours at the project, we put more<br />
technology on it to reduce labor.”<br />
- Woolpert Engineering
Survey Productivity Solutions: Market<br />
Penetration<br />
• Even in most mature markets,<br />
~35%<br />
• In emerging markets,<br />
penetration is much lower<br />
• The adoption of this technology<br />
by the other 65% of current nonusers<br />
is a significant opportunity<br />
• .
Accelerating the adoption of RTK by surveyors<br />
• <strong>Trimble</strong> VRS networks cut the cost<br />
of entry by 50% for new RTK<br />
adopters<br />
• Also enhances simplicity and<br />
convenience<br />
• Accelerates market penetration<br />
and adoption of the technology by<br />
current non-users
<strong>Trimble</strong> VRS Now tm
<strong>Trimble</strong>: Uniquely Positioned<br />
• #1 Position in productivity solutions<br />
• #1 Position in GNSS Infrastructure<br />
• In-house core technologies with patented<br />
industry leading portfolio<br />
• Multiple global distribution channels
<strong>Trimble</strong> Analyst Day<br />
Sunnyvale, California<br />
April 21, 2006
Safe Harbor<br />
The forward-looking statements made in this presentation and<br />
any subsequent Q&A period, are subject to risks<br />
and uncertainties. <strong>Trimble</strong>'s actual results may differ materially<br />
from those currently anticipated due to a number of factors,<br />
including the competitive nature of the marketplace, the<br />
condition of the worldwide economy and other factors detailed<br />
in the company's form 10K for 2005 and subsequent 10Qs or<br />
other documents filed with the Securities and Exchange<br />
Commission.
All segments have demonstrated revenue growth &<br />
increased profitability over the last three years<br />
$ Millions<br />
Engineering & Construction<br />
<strong>Revenue</strong><br />
Operating Income<br />
Operating Margin<br />
Field Solutions<br />
<strong>Revenue</strong><br />
Operating Income<br />
Operating Margin<br />
Mobile Solutions<br />
<strong>Revenue</strong><br />
Operating Income<br />
Operating Margin<br />
Advanced Devices<br />
<strong>Revenue</strong><br />
Operating Income<br />
Operating Margin<br />
Consolidated <strong>Trimble</strong><br />
<strong>Revenue</strong><br />
Operating Income<br />
Operating Margin<br />
2002<br />
$319.6<br />
$53.5<br />
16.7%<br />
$67.3<br />
$9.7<br />
14.4%<br />
$8.5<br />
-$12.0<br />
-141.9%<br />
$71.3<br />
$11.2<br />
15.8%<br />
$466.6<br />
$33.8<br />
7.2%<br />
2005<br />
$524.5<br />
$118.0<br />
22.5%<br />
$127.8<br />
$32.5<br />
25.4%<br />
$31.5<br />
-$3.1<br />
-9.8%<br />
$91.1<br />
$13.2<br />
14.5%<br />
$774.9<br />
$124.9<br />
16.1%<br />
3-Year<br />
CAGR<br />
18%<br />
30%<br />
6 pt<br />
24%<br />
50%<br />
11 pt<br />
55%<br />
N/A<br />
132 pt<br />
9%<br />
6%<br />
-1 pt<br />
18%<br />
55%<br />
9 pt
Strong operating leverage has led to<br />
expansion of margins<br />
$Millions<br />
<strong>Revenue</strong><br />
Gross Profit<br />
% Rev<br />
Operating Expense<br />
% Rev<br />
Operating Income<br />
% Rev<br />
Non Op Expense<br />
Earnings before Tax<br />
Tax<br />
Net Income<br />
GAAP EPS<br />
NON-GAAP EPS<br />
2002<br />
$466.6<br />
$234.4<br />
50.2%<br />
$200.6<br />
43.0%<br />
$33.8<br />
7.2%<br />
$20.0<br />
$13.8<br />
$3.5<br />
$10.3<br />
0.24<br />
0.36<br />
2005<br />
$774.9<br />
$389.8<br />
50.3%<br />
$264.9<br />
34.2%<br />
$124.9<br />
16.1%<br />
$0.2<br />
$124.8<br />
$39.9<br />
$84.9<br />
1.49<br />
1.43<br />
3-Year<br />
CAGR<br />
18%<br />
18%<br />
10%<br />
55%<br />
-80%<br />
108%<br />
125%<br />
102%<br />
84%<br />
58%
All elements of operating expenses have grown at a<br />
lower rate than revenue growth of 18%<br />
$Millions 2002 2005<br />
3-Year<br />
CAGR<br />
R&D $61.2 $84.3 11%<br />
% Rev 13.1% 10.9%<br />
Marketing $28.7 $41.8 13%<br />
% Rev 6.1% 5.4%<br />
Sales $60.7 $78.4 9%<br />
% Rev 13.0% 10.1%<br />
General & Administrative $40.6 $52.1 9%<br />
% Rev 8.7% 6.7%<br />
Restructuring $1.1 $0.3 -37%<br />
% Rev 0.2% 0.0%<br />
Amortization & In-Process R&D $8.3 $8.0 -1%<br />
% Rev 1.8% 1.0%<br />
Operating Expense $200.6 $264.9 10%<br />
% Rev 43.0% 34.2%
Non-operating expense has been reduced due to<br />
elimination of debt and increased profitability of joint<br />
venture<br />
$Millions 2002 2005<br />
Interest Income $0.7 $0.8<br />
Interest Expense -$14.7 -$2.3<br />
Foreign Currency translation loss -$0.8 $1.0<br />
Expenses for affiliated operations -$4.0 -$0.3<br />
Other income (expense) -$1.2 $0.6<br />
Total Non-Operating Expense -$20.0 -$0.2
Consistent growth in non-GAAP EPS<br />
$0.50<br />
$0.40<br />
$0.30<br />
$0.20<br />
$0.10<br />
$0.00<br />
Q1 Q2 Q3 Q4<br />
CAGR: 104% 49%<br />
73%<br />
33%<br />
2002<br />
2003<br />
2004<br />
2005
Operating leverage drives income growth<br />
50%<br />
40%<br />
30%<br />
20%<br />
10%<br />
0%<br />
Gross Profit - % of Rev<br />
Operating Expense - % of Rev<br />
Operating Income - % of Rev<br />
2002 2003 2004 2005
Financial ratios have improved over time<br />
$ Millions 2002 2003 2004 2005<br />
Inventory Turns * 4.1 3.9 4.5 3.9<br />
DSO * 56 67 64 62<br />
Debt $ 139 $ 90 $ 39 -<br />
Cash $ 29 $ 45 $ 72 $ 74<br />
Shareholder Equity $ 201 $ 348 $ 472 $ 571<br />
ROE 5.7% 13.2% 16.5% 16.0%<br />
<strong>Revenue</strong> / Employee 228K 252K 310K 330K<br />
*Trailing Twelve Months
Strong cash flow generated by operations used to pay<br />
down debt and fund acquisitions<br />
$ Millions 2002 2003 2004 2005<br />
Opening Balance $ 31 $ 29 $ 45 $ 72<br />
Cash from Operations 32 30 75 93<br />
Capital Spending -6 -11 -12 -23<br />
Acquisitions 2 -11 -13 -51<br />
Options/ESPP 21 51 27 24<br />
Debt Retirement -53 -50 -51 -38<br />
Other 1 9 1 -3<br />
Ending Balance $ 29 $ 45 $ 72 $ 74<br />
Columns do not foot due to rounding
<strong>Trimble</strong><br />
<strong>Trimble</strong> Channel<br />
(Majority of Sales Today)<br />
CTCT<br />
JV<br />
10 11 11 15<br />
Old<br />
Methodology<br />
<strong>Revenue</strong> 15<br />
Cost 10<br />
Operating Profit 5<br />
CTCT-Profit 2<br />
-Transfer Pricing (3)<br />
Non-Operating Exp (1)<br />
Inc before Tax 4<br />
New<br />
Methodology<br />
15<br />
10 + 3<br />
2<br />
-<br />
2<br />
2<br />
4<br />
<strong>Trimble</strong><br />
Dealer<br />
Caterpillar Channel<br />
(Minority of Sales Today)<br />
<strong>Trimble</strong><br />
-<br />
-<br />
-<br />
CTCT<br />
JV<br />
10 11 11 15<br />
Old<br />
Methodology<br />
2<br />
1<br />
3<br />
3<br />
New<br />
Methodology<br />
-<br />
11<br />
10<br />
1<br />
2<br />
2<br />
3<br />
CAT<br />
Channel
Impact of CTCT transaction and FAS 123(R)<br />
accounting distorts year-over-year comparisons<br />
$Millions Q1'05 Underlying<br />
CTCT<br />
Accounting<br />
Impact<br />
FAS<br />
123(R) Reported<br />
Gross Profit $97.8 $113.0 ($5.2) ($0.3) $107.5<br />
Operating Income $30.2 $41.5 ($5.2) ($3.2) $33.1<br />
Non-Operating Inc/(Exp):<br />
CTCT - Profit $0.3 $1.6 - -<br />
CTCT - Transfer Price ($3.1) ($5.2) $5.2 -<br />
All Others ($1.0) $1.2 - -<br />
($3.8) ($2.4) $5.2 -<br />
Income before Taxes $26.4 $39.1 -<br />
Q1'06<br />
$1.6<br />
-<br />
$1.2<br />
$2.8<br />
($3.2) $35.9
Results show strong growth versus prior year on an<br />
underlying basis<br />
VS Prior Year<br />
$Millions Q1 '06 Reported Underlying<br />
<strong>Revenue</strong> $225.9<br />
Gross Margin % 47.6% -2.5 pt 0.4 pt<br />
Operating Income $33.1 9.5% 37.5%<br />
Operating Margin % 14.6% -0.8 pt 3.1 pt<br />
GAAP EPS 0.45 45%<br />
NON-GAAP EPS 0.52 55%
GAAP P&L & Non-GAAP Reconciliation<br />
$Millions (except share & EPS data) Q1'06 Q1'05<br />
<strong>Revenue</strong> $ 225.9 $ 195.4<br />
Gross Profit 107.5 97.8<br />
Operating expenses 74.4<br />
Operating income 33.1<br />
Non-operating income (expense) 2.8<br />
Income before taxes 35.9<br />
Income tax 10.0<br />
Net income 25.8<br />
67.6<br />
30.2<br />
(3.8)<br />
26.4<br />
EPS (Diluted) $ 0.45 $ 0.31<br />
Shares (Diluted) 57,859 56,371<br />
NON-GAAP RECONCILIATION<br />
GAAP income before taxes $ 35.9 $ 26.4<br />
Non-GAAP adjustments<br />
Amortization 2.3<br />
2.5<br />
Restructuring -<br />
0.3<br />
Stock-based compensation 3.2<br />
-<br />
Total Non-GAAP adjustments 5.6<br />
2.8<br />
-<br />
-<br />
Non-GAAP income before taxes 41.4 29.2<br />
Income tax 11.6 10.2<br />
Non-GAAP net income $ 29.8 $ 19.0<br />
Non-GAAP earnings per share (Diluted) $ 0.52 $<br />
0.34<br />
9.0<br />
17.4
U – Underlying R – Reported<br />
Engineering & Construction<br />
Mobile Solutions<br />
Q1’06 Segment Operating Results<br />
Prior YR %<br />
Q1'06 U R<br />
REVENUE $146.7 22% 22%<br />
GROSS MARGIN 48% 2 pt -2 pt<br />
OPERATING INCOME $26.4 50% 23%<br />
OPERATING MARGIN 18% 4 pt 0 pt<br />
Field Solutions<br />
Advanced Devices
U – Underlying R – Reported<br />
Engineering & Construction<br />
Mobile Solutions<br />
Q1’06 Segment Operating Results<br />
Prior YR %<br />
Q1'06 U R<br />
REVENUE $146.7 22% 22%<br />
GROSS MARGIN 48% 2 pt -2 pt<br />
OPERATING INCOME $26.4 50% 23%<br />
OPERATING MARGIN 18% 4 pt 0 pt<br />
Field Solutions<br />
Advanced Devices<br />
Prior YR %<br />
Q1'06 U R<br />
REVENUE $43.0 (5%) (5%)<br />
GROSS MARGIN 53% -3 pt -3 pt<br />
OPERATING INCOME $13.9 (7%) (11%)<br />
OPERATING MARGIN 32% -1 pt -2 pt
U – Underlying R – Reported<br />
Engineering & Construction<br />
Mobile Solutions<br />
Q1’06 Segment Operating Results<br />
Prior YR %<br />
Q1'06 U R<br />
REVENUE $146.7 22% 22%<br />
GROSS MARGIN 48% 2 pt -2 pt<br />
OPERATING INCOME $26.4 50% 23%<br />
OPERATING MARGIN 18% 4 pt 0 pt<br />
Prior YR %<br />
Q1'06 U R<br />
REVENUE $12.6 70% 70%<br />
GROSS MARGIN 39% 9 pt 9 pt<br />
OPERATING INCOME $0.2 160% 135%<br />
OPERATING MARGIN 2% 12 pt 10 pt<br />
Field Solutions<br />
Advanced Devices<br />
Prior YR %<br />
Q1'06 U R<br />
REVENUE $43.0 (5%) (5%)<br />
GROSS MARGIN 53% -3 pt -3 pt<br />
OPERATING INCOME $13.9 (7%) (11%)<br />
OPERATING MARGIN 32% -1 pt -2 pt<br />
Prior YR %<br />
Q1'06 U R<br />
REVENUE $23.3 4% 4%<br />
GROSS MARGIN 46% 0 pt 0 pt<br />
OPERATING INCOME $2.3 (7%) (22%)<br />
OPERATING MARGIN 10% -1 pt -3 pt
Q2 Guidance<br />
$Millions Guidance<br />
<strong>Revenue</strong> $231 to $237<br />
GAAP Operating Margins 15% to 16%<br />
Non-Operating Income $2.5<br />
Intangibles $2.3<br />
Stock-based Compensation $3.2<br />
Shares 58.7 million<br />
Tax Rate 34%<br />
CTCT Accounting Impact 2.8 pts<br />
GAAP EPS 43¢ to 46¢<br />
Non-GAAP EPS 49¢ to 52¢
Multi-year Outlook<br />
Guidance<br />
2006 to 2008<br />
<strong>Revenue</strong> 12 – 15%<br />
Margin Expansion 200-300 basis pts<br />
Capital Spending $15M – 20M<br />
Tax Rate 34%<br />
Acquisitions Small / Mid Sized