Children with Disabilities
Children with Disabilities
Children with Disabilities

Create successful ePaper yourself
Turn your PDF publications into a flip-book with our unique Google optimized e-Paper software.
THE STATE OF THE WORLD’S CHILDREN 2013<br />
<strong>Children</strong> <strong>with</strong><br />
<strong>Disabilities</strong>
© United Nations <strong>Children</strong>’s Fund (UNICEF)<br />
May 2013<br />
Permission is required to reproduce any part of this publication. Permission will be<br />
freely granted to educational or non-profit organizations. Others will be requested<br />
to pay a small fee. Please contact:<br />
Division of Communication, UNICEF<br />
Attn: Permissions H6F<br />
3 United Nations Plaza, New York, NY 10017, USA<br />
Tel: +1 (212) 326-7434<br />
Email: nyhqdoc.permit@unicef.org<br />
This report and additional online content are available at . Perspective and Focus essays represent the personal views of<br />
the authors and do not necessarily reflect the position of the United Nations<br />
<strong>Children</strong>’s Fund.<br />
For corrigenda subsequent to printing, please see .<br />
For latest data, please visit .<br />
ISBN: 978-92-806-4656-6<br />
eISBN: 978-92-806-4662-7<br />
United Nations publication sales no.: E.13.XX.1<br />
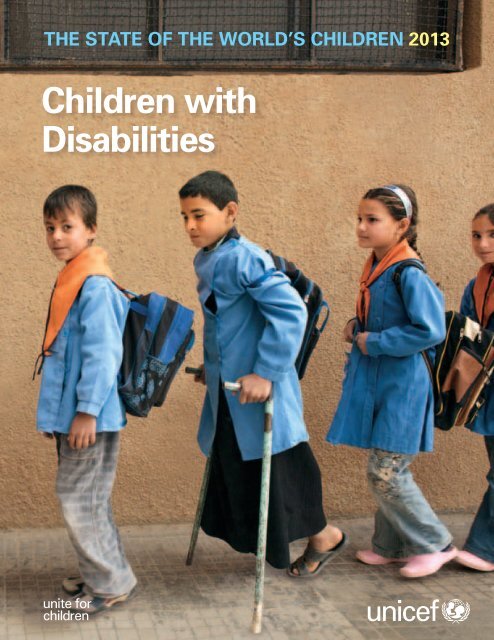
Cover photo:<br />
Schoolchildren queue to enter their classroom in this 2007 photograph from the<br />
Syrian Arab Republic. © UNICEF/HQ2007-0745/Noorani
THE STATE OF THE<br />
WORLD’S CHILDREN 2013
ACKNOWLEDGEMENTS<br />
This report is the result of collaboration among too many individuals and institutions to acknowledge here. The editorial and research team<br />
thanks all who gave so willingly of their time, expertise and energy, in particular:<br />
Vesna Bosnjak (International Social Services); Shuaib Chalklen (UN Special Rapporteur on Disability); Maureen Durkin (University of Wisconsin); Nora Groce and Maria Kett<br />
(Leonard Cheshire Disability and Inclusive Development Centre, University College London); Nawaf Kabbara (Arab Organization of Disabled People); Lisa Jordan (Bernard<br />
van Leer Foundation); Connie Laurin-Bowie (International Disability Alliance); Barbara LeRoy (Wayne State University); Charlotte McClain-Nhlapo (United States Agency for<br />
International Development); Helen Meekosha (Women <strong>with</strong> <strong>Disabilities</strong> Australia); Peter Mittler (University of Manchester); Roseweter Mudarikwa (Secretariat of the African<br />
Decade on Persons <strong>with</strong> <strong>Disabilities</strong>); David Mugawe (African Child Policy Forum); Ghulam Nabi Nizamani (Pakistan Disabled Peoples’ Organization); Victor Santiago Pineda<br />
(Victor Pineda Foundation); Tom Shakespeare (World Health Organization); Aleksandra Posarac (World Bank); Shantha Rau Barriga (Human Rights Watch); Eric Rosenthal<br />
(Disability Rights International); Albina Shankar (Mobility India); and Armando Vásquez (Pan American Health Organization) for serving on the External Advisory Board.<br />
Judith Klein (Open Society Foundations); Gerrison Lansdown (independent); Malcolm MacLachlan and Hasheem Mannan (Trinity College Dublin); Susie Miles (independent);<br />
Daniel Mont (Leonard Cheshire Disability); and Diane Richler (International Disability Alliance) for authoring background papers.<br />
Sruthi Atmakur (City University of New York); Parul Bakshi and Jean-Francois Trani (Washington University in St. Louis); Nazmul Bari and Amzad Hossain (Centre for Disability<br />
in Development); Simone Bloem and Mihaylo Milovanovitch (Organization for Economic Co-operation and Development); Johan Borg (Lund University); Megan Burke,<br />
Stephane De Greef and Loren Persi Vicentic (Landmine and Cluster Munition Monitor); James Conroy (Center for Outcome Analysis); Audrey Cooper, Charles Reilly and Amy<br />
Wilson (Gallaudet University); Alexandre Cote (International Disability Alliance); Marcella Deluca, Sunanda Mavillapalli, Alex Mhando, Kristy Mitchell, Hannah Nicolls and<br />
Diana Shaw (Leonard Cheshire Disability/Young Voices); Avinash De Souza (De Souza Foundation); Catherine Dixon (Handicap International); Fred Doulton (Secretariat of the<br />
Convention on the Rights of Persons <strong>with</strong> <strong>Disabilities</strong>); Natasha Graham (Global Partnership for Education); Jean Johnson (University of Hawaii); Chapal Khasnabis and Alana<br />
Officer (World Health Organization); Darko Krznaric (Queen’s University); Gwynnyth Llewellyn (University of Sydney); Mitch Loeb (Centers for Disease Control and Prevention/<br />
National Center for Health Statistics); Rosemay McKay (Australian Agency for International Development); Amanda McRae (Human Rights Watch); Sophie Mitra (Fordham<br />
University); David Morissey, Sherzodbek Sharipoo and Andrea Shettle (United States International Council on <strong>Disabilities</strong>); Zelda Mycroft (The Chaeli Campaign); Emma<br />
Pearce (Women’s Refugee Commission); Natalia Raileanu (Keystone Human Services); Richard Rieser (World of Inclusion); Marguerite Schneider (Stellenbosch University);<br />
Morsheda Akter Shilpi (Organization for the Poor Community Advancement); Silje Vold (Plan Norway) for writing background material or providing advice and information.<br />
Tracy Achieng; Grace Okumu Akimi; Sophia Rose Akoth; Abeida Onica Anderson; Washinton Okok Anyumba; Beatrice Atieno; Ssentongo Deo; Ivory Duncan; Argie Ergina;<br />
Mary Charles Felix; Michael Salah Hosea; Amna Hissein Idris; Tiffany Joseph; Hannah Wanja Maina; Saitoti Augustin Maina; Dianne Mallari; Modesta Mbijima; Shida<br />
Mganga; Nicole Mballah Mulavu; Joseph Kadiko Mutunkei; Ann Napaashu Nemagai; Rachael Nyaboke Nyabuti; Alice Akoth Nyamuok; Sarah Omanwa; Benson Okoth Otieno;<br />
Nakafu Phiona; Shalima Ramadhani; Rosemarie Ramitt; Nambobi Sadat; Veronicah Shangutit Sampeke; Ladu Michel Seme; Josephine Kiden Simon; Muhammad Tarmizi bin<br />
Fauzi; Elizabeth Mamunyak Tikami; Shemona Trinidad; and the 20 other young people who participated anonymously in surveys and focus groups conducted specially for this<br />
report by facilitators from the Leonard Cheshire Disability Young Voices network.<br />
Bora Shin and Matthew Manos (veryniceDesign) for the infographic on universal design published online at .<br />
UNICEF country and regional offices and headquarters divisions contributed to this report or to related online content or advocacy materials by submitting findings or photographs,<br />
taking part in formal reviews or commenting on drafts. Many UNICEF offices and national committees arranged to translate or adapt the report for local use.<br />
Programme, policy, communication and research advice and support were provided by Yoka Brandt, Deputy Executive Director; Geeta Rao Gupta, Deputy Executive Director;<br />
Gordon Alexander, Director, Office of Research and colleagues; Nicholas Alipui, Director, Programme Division and colleagues; Ted Chaiban, Director, Office of Emergency<br />
Operations and colleagues; Colin Kirk, Director, Office of Evaluation and colleagues; Jeffrey O’Malley, Director, Division of Policy and Strategy and colleagues; and Edward<br />
Carwardine, Deputy Director, Division of Communication and colleagues. This edition also benefited from the close cooperation of Rosangela Berman-Bieler, Chief, and<br />
colleagues in the Disability Section of UNICEF’s Programme Division.<br />
Special thanks to David Anthony, Chief, Policy Advocacy Section; Claudia Cappa, Statistics and Monitoring Specialist; Khaled Mansour, Director of Communication until<br />
January 2013; and Julia Szczuka, deputy editor of this report until September 2012, for their generosity of intellect and spirit.<br />
REPORT TEAM<br />
EDITORIAL AND RESEARCH<br />
Abid Aslam, Editor<br />
Christine Mills, Project Manager<br />
Nikola Balvin, Sue Le-Ba, Ticiana Maloney, Research Officers<br />
Anna Grojec, Perspectives Editor<br />
Marc Chalamet, French Editor<br />
Carlos Perellon, Spanish Editor<br />
Hirut Gebre-Egziabher (Lead), Lisa Kenney, Ami Pradhan, Research Assistants<br />
Charlotte Maitre (Lead), Carol Holmes, Pamela Knight, Natalie Leston,<br />
Kristin Moehlmann, Copy Editors<br />
Anne Santiago, Nogel S. Viyar, Judith Yemane, Editorial support<br />
ii<br />
THE STATE OF THE WORLD’S CHILDREN 2013: <strong>Children</strong> <strong>with</strong> <strong>Disabilities</strong><br />
PUBLISHING AND DISSEMINATION<br />
Catherine Langevin-Falcon, Chief, Publications Section; Jaclyn Tierney, Production<br />
Officer; Germain Ake; Christine Kenyi; Maryan Lobo; Jorge Peralta-Rodriguez;<br />
Elias Salem<br />
STATISTICAL TABLES<br />
Tessa Wardlaw, Associate Director, Statistics and Monitoring Section, Division<br />
of Policy and Strategy; David Brown; Claudia Cappa; Liliana Carvajal; Archana<br />
Dwivedi; Anne Genereux; Elizabeth Horn-Phathanothai; Priscilla Idele; Claes<br />
Johansson; Rouslan Karimov; Rolf Luyendijk; Colleen Murray; Jin Rou New;<br />
Holly Newby; Khin Wityee Oo; Nicole Petrowski; Tyler Porth; Chiho Suzuki;<br />
Andrew Thompson; Danzhen You<br />
Design by Prographics, Inc.<br />
Printed by Hatteras Press, Inc.
FOREWORD<br />
Is there a child who does not dream of being counted and having her or his gifts<br />
and talents recognized? No. All children have hopes and dreams – including children<br />
<strong>with</strong> disabilities. And all children deserve a fair chance to make their dreams real.<br />
This edition of The State of the World’s <strong>Children</strong> includes contributions by<br />
young people and parents who show that, when given that chance, children <strong>with</strong><br />
disabilities are more than capable of overcoming barriers to their inclusion, of taking their rightful place<br />
as equal participants in society and of enriching the life of their communities.<br />
But for far too many children <strong>with</strong> disabilities, the opportunity to participate simply does not exist. Far<br />
too often, children <strong>with</strong> disabilities are among the last in line for resources and services, especially<br />
where these are scarce to begin <strong>with</strong>. Far too regularly, they are the objects simply of pity or, worse,<br />
discrimination and abuse.<br />
The deprivations faced by children and adolescents <strong>with</strong> disabilities are violations of their rights and the<br />
principle of equity, at the heart of which lies a concern for the dignity and rights of all children – including<br />
the most vulnerable and marginalized members of society.<br />
As this report documents, the inclusion of children <strong>with</strong> disabilities in society is possible – but it requires<br />
first a change of perception, a recognition that children <strong>with</strong> disabilities hold the same rights as others;<br />
that they can be agents of change and self-determination, not merely the beneficiaries of charity; that<br />
their voices must be heard and heeded in our policymaking and programmes.<br />
We contribute to their exclusion by failing to gather enough data to inform our decisions. When we fail<br />
to count these children, we are failing to help them count for all they should in their societies.<br />
Fortunately, progress is being made – albeit unevenly. This report not only examines the challenges<br />
involved in ensuring that children <strong>with</strong> disabilities have the fair access to services that is their right. It<br />
also explores initiatives that show promise in such areas as health, nutrition, education and emergency<br />
programming – and in the data collection and analysis needed to improve policies and operations in all<br />
these fields. Other chapters also discuss principles and approaches that can be adapted to advance these<br />
children’s inclusion.<br />
Somewhere, a child is being told he cannot play because he cannot walk, or another that she cannot<br />
learn because she cannot see. That boy deserves a chance to play. And we all benefit when that girl,<br />
and all children, can read, learn and contribute.<br />
The path forward will be challenging. But children do not accept unnecessary limits. Neither should we.<br />
Anthony Lake<br />
Executive Director, UNICEF<br />
iii
CONTENTS<br />
ACKNOWLEDGEMENTS ................................................. ii<br />
FOREWORD<br />
Anthony Lake, Executive Director, UNICEF .............................. iii<br />
CHAPTER 1<br />
INTRODUCTION ................................................................ 1<br />
From exclusion to inclusion ........................................................ 1<br />
On the numbers ............................................................................ 3<br />
A framework for action ............................................................... 3<br />
CHAPTER 2<br />
FUNDAMENTALS OF INCLUSION ................... 11<br />
Changing attitudes ..................................................................... 12<br />
It’s about ability .......................................................................... 13<br />
Supporting children and their families .................................... 13<br />
Community-based rehabilitation .............................................. 16<br />
Assistive technology .................................................................. 18<br />
Universal design ......................................................................... 18<br />
CHAPTER 3<br />
A STRONG FOUNDATION ...................................... 23<br />
Inclusive health ........................................................................... 23<br />
Immunization .............................................................................. 23<br />
Nutrition ...................................................................................... 24<br />
Water, sanitation and hygiene ................................................... 25<br />
Sexual and reproductive health and HIV/AIDS ........................ 26<br />
Early detection and intervention ............................................... 26<br />
Inclusive education .................................................................... 27<br />
Starting early .............................................................................. 29<br />
Working <strong>with</strong> teachers ............................................................... 32<br />
Involving parents, communities and children ........................ 33<br />
Lines of responsibility ................................................................ 36<br />
iv<br />
THE STATE OF THE WORLD’S CHILDREN 2013: <strong>Children</strong> <strong>with</strong> <strong>Disabilities</strong><br />
CHAPTER 4<br />
ESSENTIALS OF PROTECTION ........................... 41<br />
Abuse and violence .................................................................... 41<br />
Institutions and inappropriate care .......................................... 42<br />
Inclusive justice .......................................................................... 43<br />
CHAPTER 5<br />
HUMANITARIAN RESPONSE ............................... 49<br />
CHAPTER 6<br />
MEASURING CHILD DISABILITY ....................... 63<br />
Evolving definitions ................................................................... 63<br />
Putting disability in context ..................................................... 64<br />
Data collection ............................................................................ 65<br />
Questionnaire design ................................................................. 66<br />
Purpose and consequences ....................................................... 67<br />
A way forward ............................................................................ 68<br />
CHAPTER 7<br />
AN AGENDA FOR ACTION .................................... 75<br />
Ratify and implement the Conventions ................................... 75<br />
Fight discrimination ................................................................... 75<br />
Dismantle barriers to inclusion ................................................. 77<br />
End institutionalization ............................................................. 80<br />
Support families ......................................................................... 81<br />
Move beyond minimum standards .......................................... 81<br />
Coordinate services to support the child ................................ 81<br />
Involve children <strong>with</strong> disabilities in making decisions ........... 84<br />
Global promise, local test ......................................................... 85
FOCUS<br />
Violence against children <strong>with</strong> disabilities .............................. 44<br />
Risk, resilience and inclusive humanitarian action ................. 52<br />
Explosive remnants of war ....................................................... 54<br />
Lessons learned .......................................................................... 69<br />
From screening to assessment ................................................. 70<br />
PERSPECTIVE<br />
From pioneer to advocate for inclusion<br />
Nancy Maguire ............................................................................. 4<br />
Living <strong>with</strong> albinism, discrimination and superstition<br />
Michael Hosea .............................................................................. 6<br />
I want good memories<br />
Nicolae Poraico ............................................................................. 8<br />
For deaf young people, language is the key<br />
Krishneer Sen ............................................................................. 20<br />
My son Hanif<br />
Mohammad Absar ..................................................................... 30<br />
The new normal<br />
Claire Halford .............................................................................. 34<br />
Adjusting, adapting and empowering<br />
Yahia J. Elziq ............................................................................... 38<br />
Segregation and abuse in institutions<br />
Eric Rosenthal and Laurie Ahern .............................................. 46<br />
One bite of the elephant at a time<br />
Chaeli Mycroft ............................................................................. 60<br />
From invisibility to inclusion for<br />
indigenous children <strong>with</strong> disabilities<br />
Olga Montufar Contreras ........................................................... 72<br />
Open the doors to education – and employment<br />
Ivory Duncan ............................................................................... 78<br />
End the ‘book famine’ <strong>with</strong> better<br />
technology, attitudes and copyright law<br />
Kartik Sawhney ........................................................................... 82<br />
<strong>Children</strong> <strong>with</strong> disabilities and<br />
universal human rights<br />
Lenín Voltaire Moreno Garcés ................................................... 86<br />
Additional Focus and Perspective essays are available online at<br />
.<br />
FIGURES<br />
Estimated rates of primary school completion ....................... 12<br />
Community-based rehabilitation .............................................. 16<br />
Assistive technology products .................................................. 19<br />
<strong>Children</strong> <strong>with</strong> disabilities and secondary education .............. 42<br />
Last to benefit ............................................................................. 43<br />
Child casualties in countries heavily affected by<br />
mines and explosive remnants of war, 2011 ........................... 56<br />
Child casualties in the most affected<br />
countries (1999–2011) ................................................................ 57<br />
Child casualties by type of explosive ....................................... 59<br />
Four case studies: Percentage of population<br />
reporting some form of disability ............................................. 64<br />
Convention on the Rights of Persons <strong>with</strong> <strong>Disabilities</strong><br />
and Optional Protocol: Signatures and ratifications .............. 76<br />
REFERENCES ....................................................................... 88<br />
STATISTICAL TABLES ................................................ 93<br />
Overview ..................................................................................... 94<br />
Under-five mortality rankings ................................................... 99<br />
Table 1. Basic indicators .......................................................... 100<br />
Table 2. Nutrition ...................................................................... 104<br />
Table 3. Health .......................................................................... 108<br />
Table 4. HIV/AIDS ..................................................................... 112<br />
Table 5. Education .................................................................... 116<br />
Table 6. Demographic indicators ............................................ 120<br />
Table 7. Economic indicators .................................................. 124<br />
Table 8. Women ........................................................................ 128<br />
Table 9. Child protection .......................................................... 132<br />
Table 10. The rate of progress ................................................ 136<br />
Table 11. Adolescents .............................................................. 140<br />
Table 12. Disparities by residence .......................................... 144<br />
Table 13. Disparities by household wealth ............................ 148<br />
Table 14. Early childhood development ................................. 152<br />
A NOTE ON TERMS<br />
Conventions, optional protocols, signatures and<br />
ratifications ............................................................................... 154<br />
v
Victor, a 13-year-old <strong>with</strong> cerebral palsy, has fun in the water in Brazil. © Andre Castro/2012
Rather, each is a sister, brother or friend who has<br />
a favourite dish, song or game; a daughter or son<br />
<strong>with</strong> dreams and the desire to fulfil them; a child<br />
<strong>with</strong> a disability who has the same rights as any<br />
other girl or boy.<br />
Given opportunities to flourish as others might,<br />
children <strong>with</strong> disabilities have the potential to<br />
lead fulfilling lives and to contribute to the<br />
social, cultural and economic vitality of their<br />
communities – as the personal essays in this<br />
volume attest.<br />
Yet surviving and thriving can be especially<br />
difficult for children <strong>with</strong> disabilities. They are<br />
at greater risk of being poor than peers <strong>with</strong>out<br />
disabilities. Even where children share the same<br />
disadvantages – of poverty or membership in a<br />
minority group, say – children <strong>with</strong> disabilities<br />
confront additional challenges as a result of their<br />
impairments and the many barriers that society<br />
throws in their way. <strong>Children</strong> living in poverty are<br />
among the least likely to enjoy the benefits of education<br />
and health care, for example, but children<br />
who live in poverty and have a disability are even<br />
less likely to attend their local school or clinic.<br />
In many countries, responses to the situation<br />
of children <strong>with</strong> disabilities are largely limited<br />
to institutionalization, abandonment or neglect.<br />
These responses are the problem, and they are<br />
rooted in negative or paternalistic assumptions<br />
INTRODUCTION<br />
Reports such as this typically begin <strong>with</strong> a statistic<br />
designed to highlight a problem. The girls and boys to<br />
whom this edition of The State of the World’s <strong>Children</strong><br />
is dedicated are not problems.<br />
of incapacity, dependency and difference that are<br />
perpetuated by ignorance. Unless this changes,<br />
children <strong>with</strong> disabilities will continue to have their<br />
rights neglected; to experience discrimination,<br />
violence and abuse; to have their opportunities<br />
restricted; to be excluded from society.<br />
What is needed is a commitment to these<br />
children’s rights and their futures, giving priority<br />
to the most disadvantaged – as a matter of equity<br />
and for the benefit of all.<br />
From exclusion to inclusion<br />
CHAPTER 1<br />
<strong>Children</strong> <strong>with</strong> disabilities encounter different<br />
forms of exclusion and are affected by them to<br />
varying degrees, depending on factors such as<br />
the type of disability they have, where they live<br />
and the culture or class to which they belong.<br />
Gender is also a crucial factor: Girls are less<br />
likely than boys to receive care and food and are<br />
more likely to be left out of family interactions<br />
and activities. Girls and young women <strong>with</strong><br />
disabilities are ‘doubly disabled’. They confront<br />
not only the prejudice and inequities encountered<br />
by many persons <strong>with</strong> disabilities, but are also<br />
constrained by traditional gender roles and<br />
barriers. 1 Girls <strong>with</strong> disabilities are also less likely<br />
to get an education, receive vocational training or<br />
find employment than are boys <strong>with</strong> disabilities<br />
or girls <strong>with</strong>out disabilities. 2<br />
INTRODUCTION<br />
1
2<br />
At the heart of these differing forms and degrees<br />
of exclusion, however, lies the shared experience<br />
of being defined and judged by what one lacks<br />
rather than by what one has. <strong>Children</strong> <strong>with</strong> disabilities<br />
are often regarded as inferior, and this exposes<br />
them to increased vulnerability: Discrimination<br />
based on disability has manifested itself in marginalization<br />
from resources and decision-making, and<br />
even in infanticide. 3<br />
Exclusion is often the consequence of invisibility.<br />
Few countries have reliable information on how<br />
many of their citizens are children <strong>with</strong> disabilities,<br />
what disabilities they have or how these<br />
disabilities affect their lives. In some countries,<br />
families raising children <strong>with</strong> disabilities face<br />
ostracism. Because of this, even loving parents<br />
and family members can be reluctant to report<br />
that a child of theirs has a disability – whether<br />
because they are trying to avoid being shunned,<br />
because they are being overprotective of the<br />
THE STATE OF THE WORLD’S CHILDREN 2013: <strong>Children</strong> <strong>with</strong> <strong>Disabilities</strong><br />
child, or both. If the child is born <strong>with</strong> an impair-<br />
ment, its birth might not even be registered.<br />
<strong>Children</strong> excluded in this way are unknown to,<br />
and therefore cut off from, the health, education<br />
and social services to which they are entitled.<br />
Childhood deprivations can have lasting effects<br />
– by limiting access to gainful employment or<br />
participation in civic affairs later in life, for<br />
example. Conversely, access to and use of<br />
supportive services and technology can position<br />
a child <strong>with</strong> a disability to take her or his<br />
place in the community and contribute to it.<br />
Indeed, the future is far from grim. Effective<br />
means are available to build inclusive societies<br />
in which children <strong>with</strong> and <strong>with</strong>out disabilities<br />
can enjoy their rights equally. Physical, attitudinal<br />
and political barriers are being dismantled,<br />
although the process is uneven and has far<br />
to go.<br />
Rahmatuallah, 14, who lost his leg in a landmine explosion, takes part in a training workshop for electricians at a centre for<br />
war-affected children in Kandahar, Afghanistan. © UNICEF/AFGA2007-00420/Noorani
Under the Convention on the Rights of the<br />
Child (CRC) and the Convention on the Rights of<br />
Persons <strong>with</strong> <strong>Disabilities</strong> (CRPD), governments<br />
around the world have taken upon themselves<br />
the responsibility of ensuring that all children,<br />
irrespective of ability or disability, enjoy their<br />
rights <strong>with</strong>out discrimination of any kind. As of<br />
February 2013, 193 countries had ratified the CRC<br />
and 127 countries and the European Union had<br />
ratified the CRPD.<br />
These two Conventions bear witness to a growing<br />
global movement dedicated to the inclusion<br />
of children <strong>with</strong> disabilities in community life.<br />
Concern for inclusion is rooted in the recognition<br />
that all children are full members of society: that<br />
each child is a unique individual who is entitled<br />
to be respected and consulted, who has skills<br />
and aspirations worth nurturing and needs that<br />
demand fulfilment and whose contributions are<br />
to be valued and encouraged. Inclusion requires<br />
society to make physical infrastructure, information<br />
and the means of communication accessible<br />
so all can use them, to eliminate discrimination<br />
so none is forced to suffer it and to provide protection,<br />
support and services so every child <strong>with</strong><br />
a disability is able to enjoy her or his rights as<br />
do others.<br />
Inclusion goes beyond ‘integration’. The latter<br />
implies that children <strong>with</strong> disabilities are to be<br />
brought into a pre-existing framework of prevailing<br />
norms and standards. In the context of<br />
education, for example, integration might be<br />
attempted simply by admitting children <strong>with</strong><br />
disabilities to ‘regular’ schools. This would fall<br />
short of inclusion, which is possible only when<br />
schools are designed and administered so that<br />
all children can experience quality learning and<br />
recreation together. This would entail providing<br />
students <strong>with</strong> disabilities <strong>with</strong> such needed<br />
accommodations as access to Braille, sign<br />
language and adapted curricula that allow<br />
them equal opportunity to learn and interact.<br />
Inclusion benefits everyone. To continue <strong>with</strong> the<br />
example of education, ramps and wide doorways<br />
On the numbers<br />
By one widely used estimate, some 93 million children<br />
– or 1 in 20 of those aged 14 or younger – live <strong>with</strong> a<br />
moderate or severe disability of some kind.<br />
Such global estimates are essentially speculative. They<br />
are dated – this one has been in circulation since 2004<br />
– and derived from data of quality too varied and methods<br />
too inconsistent to be reliable. In order to provide<br />
a context for and illustrate the issues under discussion,<br />
this report presents the results of national surveys and<br />
independent studies, but even these must be interpreted<br />
<strong>with</strong> caution and should not be compared to one<br />
another. This is because definitions of disability<br />
differ by place and time, as do study design, methodology<br />
and analysis. These issues, and promising initiatives<br />
aimed at improving the quality and availability<br />
of data, are discussed in Chapter 6 of this report.<br />
can enhance access and safety for all children,<br />
teachers, parents and visitors in a school, not<br />
just those who use wheelchairs. And an inclusive<br />
curriculum – one that is child-centred and that<br />
includes representations of persons <strong>with</strong> disabilities<br />
in order to reflect and cater to a true cross<br />
section of society – can broaden the horizons not<br />
only of children whose disabilities would otherwise<br />
limit their ambitions or options, but also of<br />
those <strong>with</strong>out disabilities who stand to gain an<br />
appreciation of diversity and of the skills and preparedness<br />
necessary to build a society inclusive<br />
of all. Where educational attainment leads to a job<br />
or other means of earning a living, the child <strong>with</strong><br />
a disability is able to advance and to take her or<br />
his place as a full and equal member of the adult<br />
world, one who produces as well as consumes.<br />
A framework for action<br />
<strong>Children</strong> <strong>with</strong> disabilities should not be treated or<br />
regarded simply as the recipients of charity. They<br />
have the same rights as others – among these,<br />
the right to life and to the opportunities that flow<br />
from good health care, nutrition and education,<br />
(continued on p. 9)<br />
INTRODUCTION 3
4<br />
PERSPECTIVE<br />
From pioneer to advocate<br />
for inclusion<br />
By Nancy Maguire<br />
Nancy Maguire is a disability<br />
activist from the United Kingdom.<br />
She is a qualified social worker but,<br />
after travelling abroad, decided to<br />
campaign for the rights of people<br />
<strong>with</strong> disabilities, especially young<br />
women. She has worked <strong>with</strong><br />
disabled people’s organizations<br />
in Asia and Southern Africa, and<br />
hopes to obtain a Master’s degree<br />
in policy and development.<br />
I was born in London in 1986<br />
and have a condition called<br />
osteogenesis imperfecta, commonly<br />
known as brittle bones.<br />
Many children <strong>with</strong> brittle bones<br />
grow up protected – overprotected,<br />
some might say – from<br />
any possibility of hurting themselves.<br />
My parents wanted me<br />
to be safe, but they also wanted<br />
me to have the opportunity to<br />
play, make friends and lead as<br />
normal a childhood as possible.<br />
In the 1980s, inclusive education<br />
was still a fairly new concept.<br />
Like most parents of a disabled<br />
child, mine were advised to<br />
send me to a special school.<br />
My mother is a teacher, and<br />
after visiting the recommended<br />
school she was convinced that<br />
it would provide a substandard<br />
education. My parents have<br />
always used my older sister<br />
Katy, who did not have a disability,<br />
to gauge what is acceptable<br />
for me: If they thought<br />
something wasn’t good enough<br />
for Katy, then it wasn’t good<br />
enough for me.<br />
I was the first child <strong>with</strong> a disability<br />
to attend my primary<br />
school, and in many ways I felt<br />
like a guinea pig for inclusion.<br />
For example, despite having a<br />
positive attitude towards including<br />
me in all aspects of school<br />
life, my teachers lacked experience<br />
in how to adapt physical<br />
education so that I could get<br />
involved in a meaningful way.<br />
Like most childhoods, mine<br />
wasn’t always easy. I spent a<br />
lot of time in hospital, and even<br />
<strong>with</strong>in an ‘inclusive’ mainstream<br />
education system, there were<br />
times when I was excluded.<br />
For example, I wasn’t allowed<br />
to go to my nursery Christmas<br />
party because the teachers were<br />
worried I would break a bone.<br />
THE STATE OF THE WORLD’S CHILDREN 2013: <strong>Children</strong> <strong>with</strong> <strong>Disabilities</strong><br />
Also, at high school they had a<br />
separate table in the canteen for<br />
children <strong>with</strong> disabilities and the<br />
teachers could not understand<br />
why I refused to sit at it. Despite<br />
setbacks and obstacles, however,<br />
I managed to flourish both<br />
educationally and socially.<br />
I was always encouraged to try<br />
new things. My extracurricular<br />
activities included swimming,<br />
ballet, wheelchair tennis, drama<br />
and singing. In many of these,<br />
I was also the only child <strong>with</strong> a<br />
disability. Interestingly, I often<br />
found these groups more inclusive<br />
than school in terms of<br />
how much I could participate<br />
and contribute. I felt wanted<br />
and people found creative<br />
ways for me to get involved.<br />
Nonetheless, there were many<br />
things I found difficult to do<br />
because of my limited mobility.<br />
I would sometimes feel upset<br />
because I couldn’t do things as<br />
well as the other children, and<br />
as I grew older and more selfconscious,<br />
I became reluctant to<br />
put myself in situations where<br />
my difficulties were on show.<br />
In my teenage years a lot of my<br />
friends went through phases<br />
of being a ‘goth’ or a ‘rude<br />
girl’, which involved dressing<br />
or behaving in ways designed<br />
to attract attention. Whilst they<br />
were doing everything they
People <strong>with</strong> disabilities are becoming more visible in many walks<br />
of life – in politics and the media, for example. This is instrumental<br />
in improving children’s perceptions of what they can achieve.<br />
could to stand out and be different,<br />
I was desperate to be<br />
‘normal’ and fit in. Growing up<br />
<strong>with</strong> a disability, I received a lot<br />
of attention. People in the street<br />
would often stare at me, make<br />
comments and ask my parents,<br />
“What’s wrong <strong>with</strong> her?” I had<br />
days when I was able to brush it<br />
off, but no amount of resilience<br />
or family support can stop that<br />
from affecting you.<br />
I developed extremely low selfesteem<br />
and poor body image,<br />
made worse because I was<br />
significantly overweight. I found<br />
exercise difficult, and like many<br />
girls my age, I ate to comfort<br />
myself. I had also internalized<br />
the medical terminology that<br />
was used to describe me – in<br />
particular the word ‘deformed’<br />
(I had a curvature of the spine,<br />
since corrected). When I was 14,<br />
I developed an eating disorder,<br />
partly because I wanted to lose<br />
weight – but also because my<br />
weight felt like one aspect of my<br />
physical appearance that I could<br />
actually control.<br />
Although I had incredibly<br />
supportive family and friends,<br />
being disabled was never something<br />
I viewed as a positive<br />
thing. I thought I had to overcome<br />
it, like adversity. I became<br />
obsessed <strong>with</strong> being as ‘undisabled’<br />
as possible, and I was<br />
convinced that if I could walk,<br />
my life would be a lot better.<br />
Ironically, although I no longer<br />
use a wheelchair, in many ways<br />
I feel more aware of my disability<br />
than ever. People still make comments<br />
about me because I have<br />
small stature, and make assumptions<br />
about my life and ability;<br />
I always have to prove myself,<br />
particularly in the workplace.<br />
Though I am not defined by my<br />
disability, it has been pivotal in<br />
shaping who I am and what<br />
I have achieved. Having a disability<br />
is now something I embrace:<br />
I no longer see it as a negative<br />
thing or something I should be<br />
embarrassed about. In many<br />
ways being disabled has worked<br />
to my advantage and created<br />
opportunities that might never<br />
have been available to me –<br />
like writing this article.<br />
Every child’s experience is<br />
different. I come from a lowermiddle-class<br />
family in the United<br />
Kingdom, where I had access<br />
to free health care and a good<br />
education. But I strongly believe<br />
that the issues of belonging,<br />
self-esteem and aspiration<br />
transcend such distinctions as<br />
gender, class and nationality.<br />
To develop a greater sense of<br />
self-worth, children <strong>with</strong><br />
disabilities need the opportunity<br />
to participate and contribute in<br />
all aspects of their lives.<br />
People <strong>with</strong> disabilities are<br />
becoming more visible in many<br />
walks of life – in politics and<br />
the media, for example. This<br />
is instrumental in improving<br />
children’s perceptions of what<br />
they can achieve. When I was<br />
growing up, the only role model<br />
I had was Stevie Wonder.<br />
I admired him because he was<br />
a successful and respected<br />
musician despite being blind.<br />
However, it would have helped<br />
me to see people <strong>with</strong> disabilities<br />
doing everyday jobs – as<br />
teachers, doctors or shopkeepers.<br />
I think that would also have<br />
helped my parents. My mum<br />
said that when I was a child,<br />
she tried not to think about<br />
my future because it made her<br />
scared. She knew that I was<br />
capable but feared that my<br />
options would be limited.<br />
As it turns out, my disability has<br />
not prevented me from achieving<br />
any of the important things.<br />
I am a qualified social worker,<br />
passed my driving test when<br />
I was 16, left home when I was<br />
19 and have lived and worked<br />
in Asia and Africa. In the future<br />
I hope to be an advocate for<br />
children <strong>with</strong> disabilities on an<br />
international level, as I passionately<br />
believe in the inalienable<br />
human rights and untapped<br />
potential of these children.<br />
INTRODUCTION<br />
5
PERSPECTIVE<br />
Living <strong>with</strong> albinism,<br />
discrimination and superstition<br />
By Michael Hosea<br />
Michael Hosea was born in 1995.<br />
He is the eldest of six children and<br />
one of three persons <strong>with</strong> albinism<br />
in his immediate family. He lives<br />
in Dodoma, United Republic of<br />
Tanzania, and is about to graduate<br />
from school. He advocates for<br />
the rights of young people <strong>with</strong><br />
disabilities, particularly those <strong>with</strong><br />
albinism, through the Leonard<br />
Cheshire Disability Young Voices<br />
network.<br />
I was born in Mwanza, the<br />
second largest city in the<br />
United Republic of Tanzania.<br />
I am the eldest son and live<br />
<strong>with</strong> my siblings and parents in<br />
Dodoma, the capital. There are<br />
six children in our family; one<br />
of my sisters and one of my<br />
brothers are also albinos.<br />
The impairments caused by<br />
my condition make life very<br />
difficult. I always have trouble<br />
<strong>with</strong> the sun and have to cover<br />
up <strong>with</strong> heavy, long-sleeved<br />
clothing and wear sunglasses<br />
6 THE STATE OF THE WORLD’S CHILDREN 2013: <strong>Children</strong> <strong>with</strong> <strong>Disabilities</strong><br />
to protect my eyes. I also have<br />
troubles at school. Sometimes<br />
I can’t see the blackboard, and<br />
I always have to sit in the<br />
shade. This country does<br />
not have sufficient visionenhancing<br />
technology, such<br />
as glasses, magnifiers and<br />
special computer equipment,<br />
and <strong>with</strong>out it children <strong>with</strong><br />
albinism have a hard time<br />
graduating from school and<br />
finding employment. My family<br />
is poor, so getting money for<br />
school fees is also difficult.<br />
Life is complicated even more<br />
by the way people treat us.<br />
There is a lot of discrimination<br />
against people <strong>with</strong> albinism,<br />
and I sometimes lack the company<br />
of friends. Some people<br />
also believe horrible myths<br />
about us: that we are not<br />
human and never die, that<br />
albinism is a curse from the<br />
gods and that anyone who<br />
touches us will be cursed.<br />
Worst of all, practitioners of<br />
witchcraft hunt and kill us to<br />
use our hair, body parts and<br />
organs in charms and potions.<br />
For centuries some people<br />
have believed that if they go<br />
to a witch doctor <strong>with</strong> albino
Education is the key to stopping the murder, abuse and<br />
discrimination. It is important that others – even members of<br />
my extended family – learn that we are people just like them.<br />
body parts, they will become<br />
rich and prosperous. Even<br />
though it is illegal to kill people<br />
<strong>with</strong> albinism, it still happens –<br />
it’s greed that makes people<br />
do it. But it’s all based on lies:<br />
There are people who have<br />
done these terrible things, yet<br />
their lives have remained<br />
the same.<br />
A few months ago, thanks to a<br />
friend of my father, my siblings<br />
and I escaped being the victims<br />
of murder for witchcraft. My<br />
father’s friend came to warn him<br />
that his three albino children<br />
were in danger of being hunted,<br />
and he begged my father to<br />
leave Mwanza. This wasn’t easy<br />
because my parents’ financial<br />
situation was not good, but we<br />
packed up everything and left<br />
at 3 a.m. that night.<br />
We travelled over 500 kilometres<br />
to Dodoma and after two<br />
days received news from home<br />
that people had broken into our<br />
house in Mwanza looking to<br />
kill us.<br />
When these people found that<br />
we had escaped, they went<br />
to our next-door neighbour’s<br />
house. He was our local albino<br />
representative and had done so<br />
much to help us and advocate<br />
for albino rights in our community.<br />
They cut off his genitals<br />
and arms, and left him there to<br />
die. We later received a phone<br />
call from another neighbour<br />
telling us what they did to him.<br />
This news hurt me so much<br />
that I cried a lot, but what<br />
could I do? This is the way<br />
things are.<br />
I don’t understand why people<br />
do such things to fellow human<br />
beings. But I think education is<br />
the key to stopping the murder,<br />
abuse and discrimination. It is<br />
important that others – even<br />
members of my extended<br />
family – learn that we are<br />
people just like them. We<br />
are all the same.<br />
To escape life’s difficulties, I love<br />
to write songs and sing. I have<br />
just written a song about albinos<br />
and our struggle. My dream is<br />
to one day be able to record my<br />
music in a studio and spread<br />
my message. I pray that people<br />
around the world can one day<br />
understand that albinos are no<br />
different from them. We are all<br />
human beings and deserve to be<br />
treated <strong>with</strong> love and respect.<br />
Note:<br />
Albinism is a rare, genetically<br />
inherited condition found in all<br />
ethnicities. People <strong>with</strong> albinism<br />
have little or no pigmentation in<br />
their eyes, hair and skin owing to a<br />
lack of melanin. They are sensitive to<br />
bright light and have a higher than<br />
average risk of skin cancer from sun<br />
exposure. Most people <strong>with</strong> albinism<br />
are also visually impaired. Under<br />
the Same Sun, a Canadian nongovernmental<br />
organization, estimates<br />
that albinism affects 1 in 2,000<br />
Tanzanians. Although the medical<br />
condition itself does not affect life<br />
expectancy, in the United Republic<br />
of Tanzania the average lifespan<br />
of a person <strong>with</strong> albinism is around<br />
30 years.<br />
INTRODUCTION 7
PERSPECTIVE<br />
I want good memories<br />
By Nicolae Poraico<br />
Nicolae Poraico and his brother<br />
Grisha spent several years in a<br />
residential home for children <strong>with</strong><br />
mental disabilities in the Republic<br />
of Moldova. Nicolae was diagnosed<br />
<strong>with</strong> a moderate intellectual<br />
disability and his brother <strong>with</strong> a<br />
severe intellectual disability. In<br />
2010 Nicolae and Grisha reunited<br />
<strong>with</strong> their mother in the village<br />
of Lapusna. This was made<br />
possible <strong>with</strong> the assistance of<br />
the Community for All – Moldova<br />
programme, which is implemented<br />
by the Keystone Human Services<br />
International Moldova Association<br />
<strong>with</strong> financial support from the<br />
Open Society Mental Health<br />
Initiative and the Soros Foundation<br />
Moldova.<br />
I was 11 when I went to the institution<br />
<strong>with</strong> my brother Grisha. I<br />
am now 16. Our mother sent us<br />
there because we did not have<br />
enough money to buy or rent<br />
a house, and she had to work<br />
nights. She came to see us often.<br />
I do not remember the day I<br />
went to the institution. I even<br />
forgot some of my memories of<br />
being there, and I hope in time I<br />
will forget the other ones. I want<br />
new memories, good memories.<br />
At holidays the food was good. It<br />
was also good on other days; we<br />
were fed four times a day. After<br />
eating I cleaned the kitchen.<br />
The teachers taught us to recite<br />
poems and sing songs and<br />
showed us different games.<br />
I know a poem about Gigel<br />
and two about Mother.<br />
We had naptime from 1 to<br />
4 p.m. I would not sleep:<br />
I laughed, talked to other boys.<br />
I put my head on the pillow, kept<br />
my eyes open and looked at the<br />
boys. We were all living in one<br />
room, all 16 boys from my class.<br />
There was one boy, Victor. He<br />
worked in the kitchen. We went<br />
to the stadium nearby. He took<br />
just me to the stadium; he had<br />
bread and sour milk, and we ate<br />
together. When my mother took<br />
8 THE STATE OF THE WORLD’S CHILDREN 2013: <strong>Children</strong> <strong>with</strong> <strong>Disabilities</strong><br />
me and my brother home, Victor<br />
did not know as he was sleeping.<br />
He gave me his picture so I<br />
would not forget him, but I forgot<br />
it there.<br />
Sometimes the staff beat us. I<br />
do not know why. They beat me<br />
so much <strong>with</strong> different sticks<br />
that my back was injured. I was<br />
not the only one. Other boys<br />
were injured, too. And some<br />
boys had knives. Some boys hit<br />
others, and sometimes I fought<br />
<strong>with</strong> them, <strong>with</strong> fists. What<br />
could I do? If I did not defend<br />
myself, they could kill me. They<br />
beat Grisha, but I defended him.<br />
I didn’t want to stay there. If my<br />
mother had left us there, the<br />
administration could have sent<br />
us to different families and my<br />
mother would never find us. But<br />
I want to visit the institution, just<br />
to see Victor and take his phone<br />
number.<br />
At home, it is very good.<br />
I now play <strong>with</strong> Colea, Igor<br />
and Dima. Here, nobody beats<br />
me. Sometimes we discuss<br />
problems <strong>with</strong> our mother<br />
and ask for advice. We get<br />
along very well and I go to<br />
school every day. I like physical<br />
education and Romanian<br />
language classes. I am glad<br />
I came here. I am happy that<br />
I am in Lapusna.
(continued from p. 3)<br />
the right to express their views and participate<br />
in making decisions, and the right to enjoy equal<br />
protection under the law. They belong at the<br />
centre of efforts to build inclusive and equitable<br />
societies – not only as beneficiaries, but as<br />
agents of change. After all, who is in a better<br />
position to comprehend their needs and evaluate<br />
the response?<br />
In any effort to promote inclusion and fairness,<br />
children <strong>with</strong> disabilities should be able to enlist<br />
the support of their families, disabled people’s<br />
organizations, parents’ associations and community<br />
groups. They should also be able to<br />
count on allies further afield. Governments have<br />
the power to help by aligning their policies and<br />
programmes <strong>with</strong> the spirit and stipulations of<br />
the CRPD, CRC and other international instruments<br />
that address or affect child disability.<br />
International partners can provide assistance<br />
compatible <strong>with</strong> the Conventions. Corporations<br />
and other entities in the private sector can<br />
advance inclusion – and attract the best talent<br />
– by embracing diversity in hiring.<br />
The research community is working to improve<br />
data collection and analysis. Their work will help<br />
to overcome ignorance and the discrimination<br />
that often stems from it. Furthermore, because<br />
data help to target interventions and gauge their<br />
effects, better collection and analysis helps in<br />
ensuring an optimal allocation of resources and<br />
services. But decision-makers need not wait for<br />
better data to begin building more inclusive infrastructure<br />
and services: As some have already<br />
found, inclusion involves and benefits entire<br />
communities, and its elements can be applied to<br />
new projects across the board. All that is needed<br />
is for these efforts to remain flexible so they can<br />
be adapted as new data come to light.<br />
The next chapter of this report discusses exclusion<br />
and the factors that propagate it, along <strong>with</strong><br />
some philosophical and practical fundamentals<br />
of inclusion. Subsequent chapters – each of<br />
which applies the same approach of exploring<br />
barriers as well as solutions that show<br />
promise – are dedicated to specific aspects of<br />
the lives of children <strong>with</strong> disabilities. Chapter 3<br />
examines the health, nutritional and educational<br />
services that can provide a strong foundation<br />
on which children <strong>with</strong> disabilities can build<br />
full and fulfilling lives. Chapter 4 explores the<br />
opportunities and challenges of ensuring legal<br />
recognition and protection against exploitation<br />
or abuse. Chapter 5 discusses inclusion in the<br />
context of humanitarian crises.<br />
Many of the deprivations endured by children<br />
<strong>with</strong> disabilities stem from and are perpetuated<br />
by their invisibility. Research on child disability<br />
is woefully inadequate, especially in low- and<br />
middle-income countries. The resulting lack of<br />
evidence hinders good policymaking and service<br />
delivery for children who are among the most<br />
vulnerable. Therefore, Chapter 6 of this report<br />
examines the challenges and opportunities<br />
confronting researchers – and ways in which<br />
children <strong>with</strong> disabilities can be rendered visible<br />
through sound data collection and analysis.<br />
Chapter 7, which concludes this edition of The<br />
State of the World’s <strong>Children</strong>, outlines necessary<br />
and feasible actions that will enable governments,<br />
their international partners, civil society<br />
and the private sector to advance equity through<br />
the inclusion of children <strong>with</strong> disabilities.<br />
Wenjun, 9, walks <strong>with</strong> her foster mother in China.<br />
© UNICEF/China/2010/Liu<br />
INTRODUCTION<br />
9
<strong>Children</strong> <strong>with</strong> and <strong>with</strong>out disabilities participate in school festivities in Bangladesh. © UNICEF/BANA2007-00655/Siddique
FUNDAMENTALS OF<br />
INCLUSION<br />
Adopting an approach grounded in respect for the rights,<br />
aspirations and potential of all children can reduce the<br />
vulnerability of children <strong>with</strong> disabilities to discrimination,<br />
exclusion and abuse.<br />
The Convention on the Rights of the Child (CRC)<br />
and the Convention on the Rights of Persons <strong>with</strong><br />
<strong>Disabilities</strong> (CRPD) challenge charitable approaches<br />
that regard children <strong>with</strong> disabilities as passive<br />
recipients of care and protection. Instead, the<br />
Conventions demand recognition of each child<br />
as a full member of her or his family, community<br />
and society. This entails a focus not on traditional<br />
notions of ‘rescuing’ the child, but on investment<br />
in removing the physical, cultural, economic, communication,<br />
mobility and attitudinal barriers that<br />
impede the realization of the child’s rights – including<br />
the right to active involvement in the making<br />
of decisions that affect children’s daily lives.<br />
It is often said that when you change, the world<br />
changes. Underestimation of the abilities of<br />
people <strong>with</strong> disabilities is a major obstacle to<br />
their inclusion. It exists not only in society at<br />
large but also in the minds of professionals,<br />
politicians and other decision-makers. It can also<br />
occur in families, among peers and in individuals<br />
<strong>with</strong> a disability, especially in the absence of evidence<br />
that they are valued and supported in their<br />
development. Negative or ill-informed attitudes,<br />
from which stem such deprivations as the lack of<br />
reasonable accommodation for children <strong>with</strong><br />
disabilities, remain among the greatest obstacles<br />
to achieving equality of opportunity.<br />
Negative social perceptions may result in children<br />
<strong>with</strong> disabilities having fewer friends and<br />
CHAPTER 2<br />
being isolated or bullied, their families experiencing<br />
additional stress, and their communities<br />
treating them as outsiders. Early studies<br />
of the way children <strong>with</strong> disabilities are treated<br />
by their peers have found that even at the preschool<br />
level, they may be overlooked as friends<br />
or playmates, sometimes because other children<br />
believe that they are not interested or able<br />
to play and interact. 4 A survey of families of<br />
children <strong>with</strong> disabilities in the United Kingdom<br />
found that 70 per cent thought that understanding<br />
and acceptance of disability among their<br />
community was poor or unsatisfactory, and<br />
almost half encountered problems in accessing<br />
such support services as childcare. 5 According<br />
to a 2007 UK study involving children <strong>with</strong> special<br />
educational needs, 55 per cent said that<br />
they had been treated unfairly because of their<br />
disability. 6 In Madagascar, one study found that<br />
ignorance about disability was common among<br />
parents – and that even among the presidents<br />
of parents’ associations, 48 per cent believed,<br />
mistakenly, that disability is contagious. 7 A<br />
2009 study in the Vietnamese city of Da Nang<br />
reported that although the community adopted<br />
generally tolerant attitudes towards children<br />
<strong>with</strong> disabilities and their families, instances<br />
of stigmatization and discrimination persisted.<br />
The appearance of children <strong>with</strong> disabilities in<br />
public on such holidays as Tet, which marks the<br />
new lunar year, was considered detrimental to<br />
good fortune. 8<br />
FUNDAMENTALS OF INCLUSION<br />
11
12<br />
It is no wonder, then, that children <strong>with</strong> disabilities<br />
are among the most vulnerable to low selfesteem<br />
and feelings of isolation. No child should<br />
be defined by a disability. Each child is unique<br />
and has the right to be respected as such. When<br />
societies embrace inclusive principles and demonstrate<br />
this support for equity in practice, children<br />
<strong>with</strong> disabilities are able to enjoy the same<br />
rights and choices as other children. Enabling<br />
participation in the community and providing<br />
educational, cultural and recreational options is<br />
of paramount importance for the healthy physical<br />
and intellectual development of every child.<br />
Where specialized support – for communications<br />
or mobility, for example – is needed to facilitate<br />
interaction and promote self-reliant participation<br />
in everyday activities, access should be free and<br />
available to all.<br />
Changing attitudes<br />
Little will change in the lives of children <strong>with</strong><br />
disabilities until attitudes among communities,<br />
professionals, media and governments begin to<br />
Estimated rates of primary<br />
school completion<br />
<strong>with</strong><br />
disability<br />
<strong>with</strong>out<br />
disability<br />
<strong>with</strong><br />
disability<br />
<strong>with</strong>out<br />
disability<br />
42%<br />
51%<br />
53%<br />
Source: World Health Organization, based on surveys in 51 countries.<br />
61%<br />
THE STATE OF THE WORLD’S CHILDREN 2013: <strong>Children</strong> <strong>with</strong> <strong>Disabilities</strong><br />
change. Ignorance about the nature and causes<br />
of impairments, invisibility of the children themselves,<br />
serious underestimation of their potential<br />
and capacities, and other impediments to equal<br />
opportunity and treatment all conspire to keep<br />
children <strong>with</strong> disabilities silenced and marginalized.<br />
Major public awareness campaigns that<br />
are sponsored by governments, include children<br />
as key presenters and are supported by all civil<br />
society stakeholders can inform, challenge and<br />
expose these barriers to the realization of rights.<br />
Furthermore, parents and disabled persons’ organizations<br />
can – and often do – play pivotal roles<br />
in campaigning for acceptance and inclusion.<br />
Bringing disability into political and social discourse<br />
can help to sensitize decision-makers and<br />
service providers, and demonstrate to society at<br />
large that disability is ‘part of the human condition’.<br />
9 The importance of involving children <strong>with</strong><br />
disabilities cannot be overstated. Prejudice can<br />
be effectively reduced through interaction, and<br />
activities that bring together children <strong>with</strong> and<br />
<strong>with</strong>out disabilities have been shown to foster<br />
more positive attitudes. 10 Social integration benefits<br />
everyone. It follows that if societies seek<br />
to reduce inequalities, they should start <strong>with</strong><br />
children who are best fitted to build an inclusive<br />
society for the next generation. <strong>Children</strong> who<br />
have experienced inclusive education, for<br />
example, can be society’s best teachers.<br />
Inclusive media also have a key part to play.<br />
When children’s literature includes children and<br />
adults <strong>with</strong> disabilities, it sends out positive messages<br />
that they are members of families and<br />
neighbourhoods. It is important for members<br />
of all groups, and especially those that may be<br />
discriminated against on the grounds of race,<br />
gender, ethnicity or disability, to be included in<br />
stories and textbooks for children – not necessarily<br />
as the main protagonists but simply to<br />
note their presence and participation. Books, film<br />
and media portrayal play an important role in<br />
teaching children about social norms. Just as the<br />
portrayal of girl characters in mainstream children’s<br />
media carries implicit notions of gender
hierarchy and traditional expectations of gender,<br />
so the routine absence, misrepresentation or<br />
stereotyping of people <strong>with</strong> disabilities creates<br />
and reinforces social prejudices and leads to the<br />
underestimation of the roles and place of people<br />
<strong>with</strong> disabilities in society.<br />
Similarly, participation in social activities helps<br />
to promote a positive view of disability. Sport, in<br />
particular, has helped overcome many societal<br />
prejudices. Physical activity can be a powerful<br />
means of promoting respect – it is inspirational<br />
to see a child surmount the physical and psychological<br />
barriers to participation, including lack<br />
of encouragement and support or limited adaptive<br />
equipment. In one study, physically active<br />
children <strong>with</strong> disabilities were rated as more<br />
competent than their non-disabled counterparts. 11<br />
However, care must be taken not to create an<br />
artificial atmosphere in which children <strong>with</strong> disabilities<br />
who demonstrate physical heroism are<br />
deemed worthy and those who do not are made<br />
to feel inferior.<br />
Sport has also been helpful in campaigns to<br />
reduce stigma. Athletes <strong>with</strong> disabilities are<br />
often among the most recognized representatives<br />
of people <strong>with</strong> disabilities, and many use<br />
such platforms as the Paralympics and Special<br />
Olympics to campaign and to become role<br />
models for children <strong>with</strong> physical or intellectual<br />
impairments. Moreover, experiences in Bosnia<br />
and Herzegovina, the Lao People’s Democratic<br />
Republic, Malaysia and the Russian Federation<br />
show that access to sport and recreation is not<br />
only of direct benefit to children <strong>with</strong> disabilities<br />
but also helps to raise their standing in the community<br />
as they are seen to participate alongside<br />
other children in activities valued by society. 12<br />
Encouraging children <strong>with</strong> disabilities to take<br />
part in sport and recreation in company <strong>with</strong> all<br />
their peers is more than a matter of changing<br />
attitudes. It is a right and a specific requirement<br />
of the CRPD, which instructs States parties to<br />
“ensure that children <strong>with</strong> disabilities have equal<br />
access <strong>with</strong> other children to participation in play,<br />
It’s about ability<br />
Montenegro’s ‘It’s About Ability’ campaign was<br />
launched in September 2010 and has had an impact on<br />
the public’s knowledge of and attitudes and practices<br />
towards children <strong>with</strong> disabilities. The campaign brings<br />
together a broad coalition of 100 national and international<br />
organizations ranging from the Government<br />
of Montenegro to the European Union, the Council of<br />
Europe, the Organization for Security and Co-operation<br />
in Europe, United Nations agencies, embassies, associations<br />
of parents of children <strong>with</strong> disabilities, print<br />
and electronic media, the private sector, local officials<br />
and children <strong>with</strong> and <strong>with</strong>out disabilities. One of the<br />
campaign’s strategies involved the use of billboards all<br />
over the country to show children <strong>with</strong> disabilities as<br />
active members of society, portraying them as athletes,<br />
friends, musicians, dancers, students, daughters, sons,<br />
brothers and sisters.<br />
A November 2011 survey measuring the impact of the<br />
campaign reported that it contributed to an 18 per<br />
cent increase in the number of people who consider<br />
children <strong>with</strong> disabilities as equal members of society.<br />
Behaviour toward children <strong>with</strong> disabilities and<br />
communication between them and people <strong>with</strong>out<br />
disabilities were also seen to improve.<br />
recreation and leisure and sporting activities,<br />
including those activities in the school system.”<br />
Supporting children and<br />
their families<br />
The CRPD underlines the role of the family as the<br />
natural unit of society and the role of the State<br />
in supporting the family. It says that “persons<br />
<strong>with</strong> disabilities and their family members should<br />
receive the necessary protection and assistance<br />
to enable families to contribute towards the full<br />
and equal enjoyment of the rights of persons<br />
<strong>with</strong> disabilities.” 13<br />
The process of fulfilling the rights of a child <strong>with</strong><br />
a disability – of including that child in community<br />
FUNDAMENTALS OF INCLUSION<br />
13
14<br />
Marmane, 8, looks over her shoulder in a rehabilitation<br />
centre run by the international non-governmental<br />
organization Médecins sans Frontières in Port-au-Prince,<br />
Haiti. © UNICEF/HQ2005-1970/LeMoyne<br />
life – begins <strong>with</strong> establishing a home setting<br />
conducive to early intervention. It involves stimulation<br />
and interaction <strong>with</strong> parents and caregivers<br />
from the first days and weeks of life through the<br />
different stages of the child’s educational and<br />
recreational development. Inclusion is important<br />
at all ages but the earlier children <strong>with</strong> disabilities<br />
are given the chance to interact <strong>with</strong> peers and<br />
the larger society, the greater the likely benefits<br />
for all children.<br />
Under the CRPD, children <strong>with</strong> disabilities and<br />
their families have the right to an adequate standard<br />
of living, including adequate food, clothing<br />
and housing. <strong>Children</strong> <strong>with</strong> disabilities and those<br />
responsible for their care are also entitled to such<br />
subsidized or free support services as day care,<br />
respite care and access to self-help groups.<br />
THE STATE OF THE WORLD’S CHILDREN 2013: <strong>Children</strong> <strong>with</strong> <strong>Disabilities</strong><br />
Social protection for children <strong>with</strong> disabilities<br />
and their families is especially important because<br />
these families often face a higher cost of living<br />
and lost opportunities to earn income.<br />
Estimates of the additional costs of disability<br />
borne by families range from 11–69 per cent<br />
of income in the United Kingdom to 29–37 per<br />
cent in Australia, 20–37 per cent in Ireland, 9 per<br />
cent in Viet Nam and 14 per cent in Bosnia and<br />
Herzegovina. 14 Costs associated <strong>with</strong> disability<br />
include such direct expenses as medical treatment,<br />
travel, rehabilitation or assistance <strong>with</strong><br />
care, and such opportunity costs as the income<br />
forgone when parents or family members give<br />
up or limit their employment to care for a child or<br />
children <strong>with</strong> disabilities. 15<br />
The International Labour Organization has estimated<br />
that in 10 low- and middle-income countries,<br />
the economic costs of disability amount to<br />
3–5 per cent of gross domestic product. 16 A review<br />
of 14 developing countries found that people<br />
<strong>with</strong> disabilities were more likely to experience<br />
poverty than those <strong>with</strong>out disabilities. 17 People<br />
<strong>with</strong> disabilities tended to be less well off in terms<br />
of education, employment, living conditions,<br />
consumption and health. In Malawi and Uganda,<br />
households <strong>with</strong> members who have disabilities<br />
have been found more likely to be poorer than<br />
similar households <strong>with</strong>out disabled members. 18<br />
Households <strong>with</strong> members <strong>with</strong> disabilities generally<br />
have lower incomes than other households<br />
and are at greater risk of living below the poverty<br />
line. 19 In developing countries, households <strong>with</strong> a<br />
member or members who have disabilities spend<br />
considerably more on health care. 20 This means<br />
that even a household that technically stands<br />
above the poverty line but includes a member<br />
or members <strong>with</strong> disabilities can actually have<br />
a standard of living equivalent to that of a household<br />
below the poverty line but <strong>with</strong>out members<br />
<strong>with</strong> disabilities.<br />
The evidence is clear that childhood disability<br />
diminishes a person’s life chances. <strong>Children</strong> <strong>with</strong><br />
disabilities grow up poorer, have less access
to education and health-care services, and are<br />
worse off on a host of measures including the<br />
likelihood of family break-up and abuse.<br />
States can tackle the consequent, increased risk of<br />
child poverty <strong>with</strong> such social protection initiatives<br />
as cash transfer programmes. These programmes<br />
are relatively easy to administer and provide for<br />
flexibility in meeting the particular needs of parents<br />
and children. They also respect the decisionmaking<br />
rights of parents and children.<br />
Cash transfer programmes have been shown<br />
to benefit children, 21 although it can be difficult<br />
to gauge the extent to which they are used<br />
by and useful to children <strong>with</strong> disabilities and<br />
those who care for them. 22 A growing number of<br />
low- and middle-income countries are building<br />
on promising results from these broader efforts<br />
and have launched targeted social protection<br />
initiatives that include cash transfers specifically<br />
for children <strong>with</strong> disabilities. These countries<br />
include Bangladesh, Brazil, Chile, India, Lesotho,<br />
Mozambique, Namibia, Nepal, South Africa,<br />
Turkey and Viet Nam, among others. The type<br />
of allowances and criteria for receiving them<br />
vary greatly. Some are tied to the severity of<br />
the child’s impairment. Routine monitoring and<br />
evaluation of the transfers’ effects on the health,<br />
educational and recreational attainment of children<br />
<strong>with</strong> disabilities will be essential to make<br />
sure these transfers achieve their objectives.<br />
Another tool governments can use is disabilityspecific<br />
budgeting. For instance, a government<br />
that has committed to ensuring that all children<br />
receive free, high-quality education would include<br />
specific goals regarding children <strong>with</strong> disabilities<br />
from the outset and take care to allocate a sufficient<br />
portion of the available resources to covering<br />
such things as training teachers, making infrastructure<br />
and curricula accessible, and procuring<br />
and fitting assistive devices.<br />
Effective access to services including education,<br />
health care, habilitation (training and treatment<br />
to carry out the activities of daily living), rehabilitation<br />
(products and services to help restore<br />
A young boy <strong>with</strong> albinism reads Braille at school in the town of Moshi, United Republic of Tanzania.<br />
© UNICEF/HQ2008-1786/Pirozzi<br />
FUNDAMENTALS OF INCLUSION<br />
15
16<br />
function after an impairment is acquired) and<br />
recreation should be provided free of charge and<br />
be consistent <strong>with</strong> promoting the fullest possible<br />
social integration and individual development of<br />
the child, including cultural and spiritual development.<br />
Such measures can promote inclusion in<br />
society, in the spirit of Article 23 of the CRC, which<br />
states that a child <strong>with</strong> a disability “should enjoy<br />
a full and decent life, in conditions which ensure<br />
dignity, promote self-reliance and facilitate the<br />
child’s active participation in the community.” 23<br />
States parties to the CRPD have obligated<br />
themselves to take action to eliminate discrimination<br />
against children <strong>with</strong> disabilities and<br />
to make their inclusion in society a priority.<br />
Comprehensive national strategies <strong>with</strong> measurable<br />
outcomes will make it more likely for<br />
all children to realize their rights. International<br />
cooperation and exchange of information and<br />
technical assistance – including advances in<br />
teaching or community-based approaches to<br />
Community-based rehabilitation<br />
CBR<br />
MATRIX<br />
THE STATE OF THE WORLD’S CHILDREN 2013: <strong>Children</strong> <strong>with</strong> <strong>Disabilities</strong><br />
early intervention – could further these aims.<br />
Development assistance programmes focusing<br />
on children can help by taking into account the<br />
needs of children <strong>with</strong> disabilities and their families,<br />
particularly in low-income settings where<br />
systems to protect and promote the rights of<br />
children <strong>with</strong> disabilities may be weak.<br />
Services for children <strong>with</strong> disabilities are<br />
delivered by a range of government and<br />
non-governmental institutions. Appropriate<br />
multi-sectoral coordination involving family<br />
members would help to avoid gaps in provision<br />
and should be attuned to changes in the child’s<br />
capacities and needs as she or he grows and<br />
experiences life.<br />
Community-based rehabilitation<br />
Community-based rehabilitation (CBR) programmes<br />
are designed and run by local communities.<br />
CBR seeks to ensure that people <strong>with</strong><br />
HEALTH EDUCATION LIVELIHOOD SOCIAL EMPOWERMENT<br />
PROMOTION<br />
PREVENTION<br />
MEDICAL CARE<br />
REHABILITATION<br />
ASSISTIVE<br />
DEVICES<br />
Source: World Health Organization.<br />
EARLY<br />
CHILDHOOD<br />
PRIMARY<br />
SECONDARY &<br />
HIGHER<br />
NON-FORMAL<br />
LIFELONG<br />
LEARNING<br />
SKILLS<br />
DEVELOPMENT<br />
SELF-<br />
EMPLOYMENT<br />
WAGE<br />
EMPLOYMENT<br />
FINANCIAL<br />
SERVICES<br />
SOCIAL<br />
PROTECTION<br />
PERSONAL<br />
ASSISTANCE<br />
RELATIONSHIPS<br />
MARRIAGE &<br />
FAMILY<br />
CULTURE &<br />
ARTS<br />
RECREATION,<br />
LEISURE &<br />
SPORTS<br />
JUSTICE<br />
ADVOCACY &<br />
COMMUNICATION<br />
COMMUNITY<br />
MOBILIZATION<br />
POLITICAL<br />
PARTICIPATION<br />
SELF-HELP<br />
GROUPS<br />
RECREATION,<br />
LEISURE &<br />
SPORTS
An inclusive kindergarten in Nizhny Novgorod, Russian Federation. © UNICEF/RUSS/2011/Kochineva<br />
disabilities have equal access to rehabilitation<br />
and other services and opportunities – health,<br />
education, livelihoods. Developed by the World<br />
Health Organization (WHO) in the late 1970s and<br />
early 1980s, it is practised in more than 90 countries<br />
and represents a move away from the concentration<br />
of care in institutions and at the hands<br />
of specialists towards community self-reliance,<br />
collaboration and ownership in addressing the<br />
particular needs of people <strong>with</strong> disabilities –<br />
critically, <strong>with</strong> their own active participation. 24<br />
CBR can prove effective in addressing multiple<br />
deprivations. <strong>Children</strong> <strong>with</strong> disabilities who live<br />
in rural and indigenous communities contend<br />
<strong>with</strong> multiple disadvantages: They have disabilities,<br />
they belong to a marginalized group<br />
and they live in remote locations. They have<br />
little or no access to services that could ensure<br />
their development, protection and participation<br />
in community life. 25 An outreach initiative led<br />
by the Centre for Research and Post-Secondary<br />
Studies in Social Anthropology (CIESAS) in<br />
Oaxaca, Mexico, provides an example of CBR<br />
for indigenous children <strong>with</strong> disabilities, their<br />
families and community. In collaboration <strong>with</strong><br />
UNICEF and <strong>with</strong> financing from the state welfare<br />
agency DIF-Oaxaca, CIESAS used CBR to advance<br />
the inclusion of children <strong>with</strong> disabilities in four<br />
remote rural communities26 <strong>with</strong> large indigenous<br />
populations and low Human Development Index<br />
scores. Teams – made up of a doctor, a physical<br />
or occupational therapist, an educator and two<br />
community activists fluent in local indigenous<br />
languages – were trained and sent into the communities<br />
to conduct workshops on discrimination,<br />
inclusion and children’s rights. They promoted<br />
the formation of local support networks<br />
among the families of children <strong>with</strong> disabilities<br />
and, where appropriate, provided referrals to medical<br />
treatment or therapy. During the three-year<br />
period 2007–2010, the initiative led to increased<br />
FUNDAMENTALS OF INCLUSION<br />
17
18<br />
acceptance of indigenous children <strong>with</strong> disabilities<br />
by their own families and communities. Benefits<br />
also included improved provision of social services,<br />
community-led construction of wheelchair<br />
ramps to make public spaces accessible, agreement<br />
by state and federal hospitals to provide<br />
services free of charge to children <strong>with</strong> disabilities<br />
referred by the project – and 32 new enrolments of<br />
children <strong>with</strong> disabilities in mainstream schools. 27<br />
Assistive technology<br />
Depending on the type of disability, a child may<br />
need any of a number of assistive devices and<br />
services (see next page). According to the World<br />
Health Organization, however, in many lowincome<br />
countries only 5–15 per cent of the people<br />
who need assistive technology are able to obtain<br />
it. 28 Reasons for this include costs, which can be<br />
especially prohibitive in the case of children, who<br />
need their assistive devices replaced or adjusted<br />
from time to time as they grow. 29 <strong>Children</strong> are<br />
often less likely than adults to access assistive<br />
THE STATE OF THE WORLD’S CHILDREN 2013: <strong>Children</strong> <strong>with</strong> <strong>Disabilities</strong><br />
technology. 30 The provision and uses of assistive<br />
technology are discussed in a Focus article published<br />
online at .<br />
Universal design<br />
Inclusive approaches are built around the concept<br />
of accessibility, <strong>with</strong> the aim of making the<br />
mainstream work for everyone rather than creating<br />
parallel systems. An accessible environment<br />
is essential if children <strong>with</strong> disabilities are to<br />
enjoy their right to participate in the community.<br />
For instance, access to all schools is necessary<br />
if children <strong>with</strong> disabilities are to take part in<br />
education. <strong>Children</strong> who are educated alongside<br />
their peers have a much better chance of<br />
becoming productive members of their societies<br />
and of being integrated in the lives of their<br />
communities. 31<br />
Accessibility can refer to the design of an<br />
environment, product or structure. Universal<br />
design is defined as the design of products<br />
Liban, 8, uses crutches after losing a leg to a bomb explosion in Mogadiscio, Somalia. © UNICEF/HQ2011-2423/Grarup
Assistive technology products<br />
Category Examples of products<br />
Mobility • Walking stick, crutch, walking frame, manual and powered wheelchair, tricycle<br />
• Artificial leg or hand, caliper, hand splint, club foot brace<br />
• Corner chair, special seat, standing frame<br />
• Adapted cutlery and cooking utensils, dressing stick, shower seat, toilet seat, toilet frame, feeding robot<br />
Vision • Eyeglasses, magnifier, magnifying software for computer<br />
• White cane, GPS-based navigation device<br />
• Braille systems for reading and writing, screen reader for computer, talking book player, audio recorder and player<br />
• Braille chess, balls that emit sound<br />
Hearing • Headphone, hearing aid<br />
• Amplified telephone, hearing loop<br />
Communication • Communication cards <strong>with</strong> texts, communication board <strong>with</strong> letters, symbols or pictures<br />
• Electronic communication device <strong>with</strong> recorded or synthetic speech<br />
Cognition • Task lists, picture schedule and calendar, picture-based instructions<br />
• Timer, manual or automatic reminder, smartphone <strong>with</strong> adapted task lists, schedules, calendars and audio recorder<br />
• Adapted toys and games<br />
Source: Johan Borg; International Organization for Standardization (2008), .<br />
and environments to be usable by all people,<br />
to the greatest extent possible, <strong>with</strong>out the<br />
need for adaptation or specialized design.<br />
The approach focuses on design that works<br />
for all people regardless of age, ability or<br />
situation.<br />
The principles of universal design were developed<br />
by architects, product designers, engineers<br />
and environmental design researchers.<br />
They cut across design disciplines and may be<br />
applied to guide the design process or evaluate<br />
existing designs. There are seven principles:<br />
equitable use; flexibility in use; simple and<br />
intuitive use; perceptible information; tolerance<br />
for error; low physical effort; and size<br />
and space for approach and use.<br />
In practice, universal design can be found in<br />
the form of curb cuts or sidewalk ramps, audio<br />
books, Velcro fastenings, cabinets <strong>with</strong> pull-out<br />
shelves, automatic doors and low-floor buses.<br />
The cost of integrating accessibility into new<br />
buildings and infrastructure can be negligible,<br />
amounting to less than 1 per cent of the capital<br />
development cost. 32 However, the cost of making<br />
adaptations to completed buildings can be much<br />
higher, especially for smaller buildings, where<br />
it can reach 20 per cent of the original cost. 33 It<br />
makes sense to integrate accessibility considerations<br />
into projects at the early stages of the<br />
design process. Accessibility should also be a<br />
consideration when funding development<br />
projects.<br />
FUNDAMENTALS OF INCLUSION<br />
19
20<br />
PERSPECTIVE<br />
For deaf young people,<br />
language is the key<br />
By Krishneer Sen<br />
Krishneer Sen, a deaf youth activist<br />
from Suva, Fiji, and recipient of the<br />
World Deaf Leadership scholarship,<br />
is studying information technology<br />
at Gallaudet University, United<br />
States. In 2012, he served as an<br />
intern <strong>with</strong> UNICEF Fiji.<br />
Access to information and<br />
means of communication are<br />
essential for anyone to realize<br />
their rights as a citizen. Without<br />
ways to gather knowledge,<br />
express opinions and voice<br />
demands, it is impossible to<br />
obtain an education, find a job<br />
or participate in civic affairs.<br />
In my country, Fiji, lack of<br />
access to information and<br />
means of communication are<br />
the biggest issue facing deaf<br />
children. Information and<br />
communication technology<br />
(ICT), which I am studying<br />
at university, is helping deaf<br />
people around the world, creating<br />
opportunities that simply<br />
would not have been possible<br />
a generation ago. Where available,<br />
ICT provides deaf people<br />
<strong>with</strong> the chance to communicate<br />
and connect <strong>with</strong> friends,<br />
reduces their isolation and<br />
opens up avenues for their participation<br />
in political, economic,<br />
social and cultural life. Those<br />
who lack access – because they<br />
live in rural areas, are poor or<br />
lack education, or for whom<br />
appropriately adapted devices<br />
are not yet available – experience<br />
frustration and exclusion.<br />
Deaf Fijians like me have<br />
limited access to the media,<br />
THE STATE OF THE WORLD’S CHILDREN 2013: <strong>Children</strong> <strong>with</strong> <strong>Disabilities</strong><br />
emergency services – and even<br />
simple telephone conversations.<br />
In the absence of such<br />
assistive technology as captioned<br />
telephones, we must<br />
rely on people who can hear to<br />
serve as interpreters, or resort<br />
to text messaging. This will not<br />
change until ICT and media<br />
policy for people <strong>with</strong> disabilities<br />
become a top government<br />
priority.<br />
Deaf people can succeed and<br />
contribute to society just like<br />
hearing people. Developing<br />
their abilities begins <strong>with</strong> education<br />
and language. Because<br />
deaf children grow up in a<br />
hearing world, quality education<br />
necessarily means bilingual<br />
education. In Fiji, deaf<br />
children should be taught Fiji<br />
Sign Language in addition<br />
to the languages commonly<br />
taught to hearing Fijian children<br />
(English, Fijian and Hindi),<br />
and this should start at birth.<br />
Bilingual education helps deaf<br />
children develop their ability<br />
to communicate using the languages<br />
of hearing people: Deaf<br />
children who can communicate<br />
effectively in sign language will<br />
find it easier to learn other languages,<br />
like English. I believe<br />
that bilingualism will give deaf<br />
children better access to the
We need to make media more accessible to deaf children<br />
by captioning or interpreting television programmes and<br />
developing children’s programmes that use sign language.<br />
education they need to function<br />
as equal citizens.<br />
As a kid, I used to watch cartoon<br />
programmes on Fijian TV<br />
<strong>with</strong> no subtitles or sign language<br />
interpreters. My family<br />
didn’t know sign language well.<br />
Later on, I realized that the reason<br />
I was still struggling <strong>with</strong><br />
my English was that I had not<br />
been exclusively taught using<br />
signs at home. Parents have<br />
an important role in facilitating<br />
deaf children’s ability to communicate<br />
and access information;<br />
along <strong>with</strong> other people<br />
who interact <strong>with</strong> deaf children,<br />
they need to take the initiative<br />
and use sign language to communicate<br />
in their daily lives, at<br />
home and school.<br />
We need to make media more<br />
accessible to deaf children by<br />
captioning or interpreting television<br />
programmes and developing<br />
children’s programmes<br />
that use sign language. We<br />
need an environment free<br />
of communication barriers. I<br />
would like to see Fijian Sign<br />
Language used in a range of<br />
programmes, from news to<br />
cartoons. In addition to television,<br />
social media can provide<br />
powerful tools to enhance<br />
knowledge about Fiji and<br />
international affairs and ensure<br />
that everyone, including people<br />
<strong>with</strong> disabilities, has access to<br />
information about the political<br />
situation and can cast an<br />
informed vote during elections.<br />
Making ICT available to deaf<br />
children can facilitate their<br />
social and emotional development,<br />
help them learn in<br />
mainstream schools and prepare<br />
them for future employment.<br />
I took a basic computer<br />
class at a special school, and<br />
it changed my life for the better:<br />
It was through the Internet<br />
that I learned about Gallaudet<br />
University, where I now study.<br />
In addition to enhancing education,<br />
ICT provides deaf and<br />
other young people <strong>with</strong> disabilities<br />
to learn about their<br />
rights and band together to<br />
campaign for their realization.<br />
By facilitating activism, ICT<br />
may thus help increase the<br />
profile of persons <strong>with</strong> disabilities<br />
<strong>with</strong>in society at large<br />
and allow them to participate<br />
actively.<br />
My dream is to see deaf people<br />
communicate freely <strong>with</strong> hearing<br />
people through the use of<br />
assistive technologies. Once<br />
I graduate, I plan to start a<br />
project to set up communication<br />
technologies in Fiji in order<br />
to facilitate communication<br />
between hearing and deaf people,<br />
using sign language interpreters<br />
as well as video calling.<br />
I will be working <strong>with</strong> the Fiji<br />
Association for the Deaf, of<br />
which I have been a member<br />
for many years, to advocate<br />
for human rights, opportunities<br />
and equality.<br />
If the government is to consider<br />
the needs of deaf people<br />
a priority, deaf people must<br />
advocate on our own behalf.<br />
To facilitate activism among<br />
deaf people, we must educate<br />
deaf children to use both sign<br />
language and the languages of<br />
the hearing communities they<br />
live in, and we must work to<br />
expand access to technologies<br />
through which they can find<br />
information and communicate<br />
<strong>with</strong> others, deaf and hearing.<br />
FUNDAMENTALS OF INCLUSION<br />
21
A teacher <strong>with</strong> a hearing impairment teaches a class of hearing-impaired children in Gulu, Uganda. © UNICEF/UGDA2012-00108/Sibiloni
Inclusive health<br />
Under the Convention on the Rights of the<br />
Child (CRC) and the Convention on the Rights<br />
of Persons <strong>with</strong> <strong>Disabilities</strong> (CRPD), all children<br />
have the right to the highest attainable standard<br />
of health. It follows that children <strong>with</strong> disabilities<br />
are equally entitled to the full spectrum of care<br />
– from immunization in infancy to proper nutrition<br />
and treatment for the ailments and injuries<br />
of childhood, to confidential sexual and reproductive<br />
health information and services during<br />
adolescence and into early adulthood. Equally<br />
critical are such basic services as water,<br />
sanitation and hygiene.<br />
Ensuring that children <strong>with</strong> disabilities actually<br />
enjoy these rights on a par <strong>with</strong> others is the<br />
objective of an inclusive approach to health. This<br />
is a matter of social justice and of respecting the<br />
inherent dignity of all human beings. It is also<br />
an investment in the future: Like other children,<br />
those <strong>with</strong> disabilities are tomorrow’s adults.<br />
They need good health for its own sake, for<br />
the crucial role it plays in facilitating a happy<br />
childhood and for the boost it can give their<br />
prospects as future producers and parents.<br />
Immunization<br />
Immunizations are a critical component of<br />
global efforts to reduce childhood illness and<br />
death. They are among the most successful and<br />
A STRONG<br />
FOUNDATION<br />
Good health, nutrition and a solid education: These are<br />
the building blocks of life that children and their parents<br />
want, and to which all children are entitled.<br />
CHAPTER 3<br />
cost-effective of all public health interventions,<br />
<strong>with</strong> the strong potential to reduce the burden of<br />
morbidity and mortality, particularly for children<br />
under 5 years of age. For this reason, immunization<br />
has been a cornerstone of national and international<br />
health initiatives. More children than ever<br />
before are being reached. One consequence has<br />
been that the incidence of polio – which can lead<br />
to permanent muscle paralysis – fell from more<br />
than 350,000 cases in 1988 to 221 cases in 2012. 34<br />
There is still a considerable way to go. In 2008,<br />
for example, over a million children under<br />
5 died from pneumococcal disease, rotavirus<br />
diarrhoea and Haemophilus influenzae type B.<br />
Vaccination can actually prevent a large number<br />
of these deaths. 35<br />
The inclusion of children <strong>with</strong> disabilities in<br />
immunization efforts is not only ethical but<br />
imperative for public health and equity: Goals<br />
of universal coverage can only be achieved if<br />
children who have disabilities are included in<br />
immunization efforts. 36<br />
While immunization is an important means of<br />
pre-empting diseases that lead to disabilities, it<br />
is no less important for a child who already has a<br />
disability to be immunized. Unfortunately, many<br />
children <strong>with</strong> disabilities are still not benefiting<br />
from increased immunization coverage, though<br />
they are at the same risk of childhood diseases<br />
as all children. If they are left unimmunized or<br />
A STRONG FOUNDATION<br />
23
24<br />
only partially immunized, the results can include<br />
delays in reaching developmental milestones,<br />
avoidable secondary conditions and, at worst,<br />
preventable death. 37<br />
It will help to bring children <strong>with</strong> disabilities<br />
into the immunization fold if efforts to promote<br />
immunization include them. Showing children<br />
<strong>with</strong> disabilities alongside others on campaign<br />
posters and promotional materials, for example,<br />
can help to promote awareness. Enhancing<br />
popular understanding of the importance of<br />
immunizing each child also involves reaching<br />
out to parents through public health campaigns,<br />
civil society and disabled peoples’ organizations,<br />
schools and mass media.<br />
Nutrition<br />
About 870 million people worldwide are thought<br />
to be undernourished. Among them, some 165<br />
million under-fives are believed to be stunted,<br />
Doing homework in Bangladesh. © Broja Gopal Saha/Centre for Disability in Development<br />
THE STATE OF THE WORLD’S CHILDREN 2013: <strong>Children</strong> <strong>with</strong> <strong>Disabilities</strong><br />
or chronically malnourished, and more than 100<br />
million are considered underweight. Insufficient<br />
food or a poorly balanced diet short of certain<br />
vitamins and minerals (iodine, vitamin A, iron<br />
and zinc, for example) can leave infants and<br />
children vulnerable to specific conditions or<br />
a host of infections that can lead to physical,<br />
sensory or intellectual disabilities. 38<br />
Between 250,000 and 500,000 children are considered<br />
to be at risk of becoming blind each year<br />
from vitamin A deficiency, a syndrome easily<br />
prevented by oral supplementation costing just<br />
a few cents per child. 39 For a similarly minute<br />
amount – five cents per person per year – salt<br />
iodization remains the most cost-effective way<br />
of delivering iodine and preventing cognition<br />
damage in children in iodine-deficient areas. 40<br />
These low-cost measures help not only children<br />
<strong>with</strong> disabilities but also their mothers as they<br />
labour to raise infants and children in strained<br />
circumstances.
Early childhood stunting, which is measured as<br />
low height for age, is caused by poor nutrition<br />
and diarrhoea. A multi-country study showed<br />
that each episode of diarrhoea in the first two<br />
years of life contributes to stunting, 41 which is<br />
estimated to affect some 28 per cent of children<br />
younger than 5 in low- and middle-income<br />
countries. 42 The consequences of stunting, such<br />
as poor cognitive and educational performance,<br />
begin when children are very young but affect<br />
them through the rest of their lives. However,<br />
community-based efforts to improve basic health<br />
practices have been shown to reduce stunting<br />
among young children. 43<br />
Malnutrition in mothers can lead to a number of<br />
preventable childhood disabilities. Approximately<br />
42 per cent of pregnant women in low- and<br />
middle-income countries are anaemic, and more<br />
than one in two pregnant women in these countries<br />
suffer iron deficiency anaemia. 44 Anaemia<br />
also affects more than half of pre-school aged<br />
children in developing countries. It is one of the<br />
most prevalent causes of disability in the world<br />
– and therefore a serious global public health<br />
problem. 45 Malnutrition in lactating mothers can<br />
also contribute to poorer infant health, 46 increasing<br />
the risk of diseases that can cause disability.<br />
Healthy mothers can help reduce the incidence<br />
of some disabilities and are better prepared to<br />
minister to their children’s needs.<br />
While malnutrition can be a cause of disability,<br />
it can also be a consequence. Indeed, children<br />
<strong>with</strong> disabilities are at heightened risk of malnutrition.<br />
For example, an infant <strong>with</strong> cleft palate<br />
may not be able to breastfeed or consume<br />
food effectively. <strong>Children</strong> <strong>with</strong> cerebral palsy<br />
may have difficulty chewing or swallowing. 47<br />
Certain conditions, such as cystic fibrosis, may<br />
impede nutrient absorption. Some infants and<br />
children <strong>with</strong> disabilities may need specific diets<br />
or increased calorie intake in order to maintain a<br />
healthy weight. 48 Yet they may be hidden away<br />
from community screening and feeding initiatives.<br />
<strong>Children</strong> <strong>with</strong> disabilities who do not attend<br />
school miss out on school feeding programmes.<br />
A combination of physical factors and attitudes<br />
may adversely affect child nutrition. In some<br />
societies, mothers may not be encouraged to<br />
breastfeed a disabled child. Stigma and discrimination<br />
may also result in a child <strong>with</strong> a disability<br />
being fed less, denied food or provided <strong>with</strong> less<br />
nutritious food than siblings <strong>with</strong>out disabilities.<br />
49 <strong>Children</strong> <strong>with</strong> some types of physical or<br />
intellectual disabilities may also have difficulty<br />
in feeding themselves, or need additional time<br />
or assistance to eat. It is probable that in some<br />
cases what is assumed to be disability-associated<br />
ill health and wasting may in fact be connected<br />
<strong>with</strong> feeding problems. 50<br />
Water, sanitation and hygiene<br />
It is a widely acknowledged but little documented<br />
fact that throughout the developing world, persons<br />
<strong>with</strong> disabilities routinely face particular<br />
difficulties in accessing safe drinking water and<br />
basic sanitation. <strong>Children</strong> <strong>with</strong> physical impairments<br />
may be unable to collect water or carry<br />
it for long distances; others may find well walls<br />
and water taps too high. Hardware and washroom<br />
doors can be difficult to manipulate and<br />
there may be nowhere to rest the water container<br />
while filling it, or there may be nothing to hold<br />
on to for balance to avoid falling into a well,<br />
pond or toilet. Long or slippery paths and poor<br />
lighting also limit the use of latrines by children<br />
<strong>with</strong> disabilities.<br />
Barriers to persons <strong>with</strong> disabilities extend beyond<br />
physical and design issues. Social barriers vary in<br />
different cultures. <strong>Children</strong> <strong>with</strong> disabilities often<br />
face stigma and discrimination when using household<br />
and public facilities. Wholly inaccurate fears<br />
that children <strong>with</strong> disabilities will contaminate<br />
water sources or soil latrines are frequently reported.<br />
When children or adolescents, and particularly<br />
girls, <strong>with</strong> disabilities are forced to use different<br />
facilities than other members of their households,<br />
or are compelled to use them at different times,<br />
they are at increased risk of accidents and physical<br />
attack, including rape. Issues preventing disabled<br />
children from accessing water and sanitation in<br />
A STRONG FOUNDATION<br />
25
26<br />
such settings may vary depending on cultural and<br />
geographical context, as well as by the type of<br />
disability a child may have: A child <strong>with</strong> a physical<br />
impairment may face significant difficulties in<br />
using a hand pump or an outdoor latrine; a child<br />
who is deaf or who has an intellectual disability<br />
may have little physical difficulty but be vulnerable<br />
to teasing or abuse, which can render these<br />
facilities inaccessible.<br />
<strong>Children</strong> <strong>with</strong> disabilities might not attend school<br />
for want of an accessible toilet. <strong>Children</strong> <strong>with</strong> disabilities<br />
often report that they try to drink and eat<br />
less to cut down the number of times they need<br />
to go to the toilet, especially if they have to ask<br />
someone to help them. This adds to the risk that<br />
these children will be poorly nourished. It is also<br />
cause for concern that in some places, new water,<br />
sanitation and hygiene (WASH) facilities are still<br />
being designed and built <strong>with</strong>out adequate concern<br />
for children <strong>with</strong> disabilities. Low-tech, lowcost<br />
interventions for persons <strong>with</strong> disabilities<br />
Beatriz, a 10-year-old girl <strong>with</strong> cerebral palsy, blows soap<br />
bubbles in Brazil. © Andre Castro/2012<br />
THE STATE OF THE WORLD’S CHILDREN 2013: <strong>Children</strong> <strong>with</strong> <strong>Disabilities</strong><br />
are increasingly available – new step latrines<br />
and easy-to-use water pumps, for example. This<br />
information has yet to be widely disseminated<br />
among WASH professionals or incorporated into<br />
WASH policies and practice. 51<br />
Sexual and reproductive health and<br />
HIV/AIDS<br />
<strong>Children</strong> and young people who live <strong>with</strong> a<br />
physical, sensory, intellectual or psychosocial<br />
disability have been almost entirely overlooked<br />
in sexual and reproductive health and HIV/AIDS<br />
programmes. They are often – and incorrectly –<br />
believed to be sexually inactive, unlikely to use<br />
drugs or alcohol, and at less risk of abuse, violence<br />
or rape than their non-disabled peers, and<br />
therefore to be at low risk of HIV infection. 52<br />
In consequence, children and young people<br />
who have disabilities are at increased risk of<br />
becoming HIV-positive.<br />
People <strong>with</strong> disabilities of all ages who are<br />
HIV-positive are less likely to receive appropriate<br />
services than peers <strong>with</strong>out disabilities.<br />
Treatment, testing and counselling centres are<br />
very rarely adapted to their needs, and healthcare<br />
personnel are seldom trained to deal <strong>with</strong><br />
children and adolescents <strong>with</strong> disabilities. 53<br />
Many young people <strong>with</strong> disabilities do not<br />
receive even basic information about how their<br />
bodies develop and change. Structured education<br />
about sexual and reproductive health and relationships<br />
is seldom a part of the curriculum and<br />
even where it is, children <strong>with</strong> disabilities may<br />
be excluded. Many have been taught to be silent<br />
and obedient and have no experience of setting<br />
limits <strong>with</strong> others regarding physical contact. 54<br />
The risk of abuse is thus increased, as illustrated<br />
by a study in South Africa that suggests deaf<br />
youth are at heightened risk of HIV infection. 55<br />
Early detection and intervention<br />
<strong>Children</strong> develop rapidly during the first three<br />
years of life, so early detection and intervention
are particularly important. Developmental<br />
screening is an effective means of detecting disability<br />
in children. 56 It can take place in primaryhealth-care<br />
settings, for example, during immunization<br />
visits or growth monitoring check-ups<br />
at community health centres. The purpose of<br />
screening is to identify children at risk, to refer<br />
them for further assessment and intervention<br />
as needed, and to provide family members <strong>with</strong><br />
vital information on disability. Screening involves<br />
vision and hearing examinations as well as<br />
assessments of children’s progress against such<br />
developmental milestones as sitting, standing,<br />
crawling, walking, talking or handling objects.<br />
Health-care systems in high-income countries<br />
provide numerous opportunities to identify and<br />
manage developmental difficulties early in a<br />
child’s life. But interventions to improve young<br />
children’s development are becoming increasingly<br />
available in low- and middle-income countries.<br />
These include such interventions as treating iron<br />
deficiency, training caregivers and providing<br />
community-based rehabilitation. 57<br />
Recent studies in high- and low-income countries<br />
have shown that up to 70 per cent of children<br />
and adults newly diagnosed <strong>with</strong> epilepsy<br />
can be successfully treated (i.e., their seizures<br />
completely controlled) <strong>with</strong> anti-epileptic drugs.<br />
After two to five years of successful treatment,<br />
drugs can be <strong>with</strong>drawn <strong>with</strong>out danger of<br />
relapse in about 70 per cent of children and<br />
60 per cent of adults. However, approximately<br />
three quarters of people <strong>with</strong> epilepsy in lowincome<br />
countries do not get the treatment<br />
they need. 58 The treatments exist – efficient<br />
dissemination is often lacking.<br />
The detection and treatment of impairments is<br />
not a separate area of medicine but an integral<br />
aspect of public health. Nevertheless, policymakers<br />
and researchers typically characterize these<br />
measures as being in competition for resources<br />
<strong>with</strong> measures to promote the health of people<br />
<strong>with</strong>out disabilities. 59 This merely serves to<br />
perpetuate discrimination and inequity.<br />
<strong>Children</strong> <strong>with</strong> disabilities who overcome the<br />
discrimination and other obstacles that stand<br />
between them and health care may yet find that<br />
the services they access are of poor quality.<br />
<strong>Children</strong>’s feedback should be invited so facilities<br />
and services can be improved to meet their<br />
needs. In addition, health workers and other professionals<br />
dealing <strong>with</strong> children stand to benefit<br />
from being educated about the multiple issues<br />
of child development and child disability and<br />
from being trained to deliver integrated services<br />
– where possible, <strong>with</strong> the participation of the<br />
extended family. International cooperation can<br />
play an important role in efforts to make higherquality<br />
services available to children identified as<br />
having or at risk of developing disabilities, and in<br />
changing the competitive approach to allocating<br />
resources described in the preceding paragraph.<br />
Inclusive education<br />
Education is the gateway to full participation<br />
in society. It is particularly important for children<br />
<strong>with</strong> disabilities, who are often excluded.<br />
Many of the benefits of going to school accrue<br />
over the long run – securing a livelihood in<br />
adult life, for example – but some are almost<br />
immediately evident. Taking part at school is an<br />
important way for children <strong>with</strong> disabilities to<br />
correct misconceptions that prevent inclusion.<br />
And when these children are able to attend<br />
school, parents and caregivers are able to find<br />
time for other activities including earning a<br />
living and resting.<br />
In principle, all children have the same right to<br />
education. In practice, children <strong>with</strong> disabilities<br />
are disproportionately denied this right. In consequence,<br />
their ability to enjoy the full rights<br />
of citizenship and take up valued roles in society<br />
– chiefly, through gainful employment – is<br />
undermined.<br />
Household survey data from 13 low- and middleincome<br />
countries show that children <strong>with</strong> disabilities<br />
aged 6–17 years are significantly less<br />
likely to be enrolled in school than peers <strong>with</strong>out<br />
A STRONG FOUNDATION<br />
27
28<br />
disabilities. 60 A 2004 study in Malawi found that<br />
a child <strong>with</strong> a disability was twice as likely to<br />
have never attended school as a child <strong>with</strong>out a<br />
disability. Similarly, a 2008 survey in the United<br />
Republic of Tanzania found that children <strong>with</strong> disabilities<br />
who attended primary school progressed<br />
to higher levels of education at only half the rate<br />
of children <strong>with</strong>out disabilities. 61<br />
As long as children <strong>with</strong> disabilities are denied<br />
equal access to their local schools, governments<br />
cannot reach the Millennium Development Goal<br />
of achieving universal primary education (MDG<br />
2), and States parties to the Convention on the<br />
Rights of Persons <strong>with</strong> <strong>Disabilities</strong> cannot fulfil<br />
their responsibilities under Article 24. 62 A recent<br />
monitoring report of the Convention on the Rights<br />
of the Child acknowledged that “the challenges<br />
faced by children <strong>with</strong> disabilities in realizing their<br />
right to education remain profound” and that they<br />
are “one of the most marginalized and excluded<br />
groups in respect of education.” 63<br />
THE STATE OF THE WORLD’S CHILDREN 2013: <strong>Children</strong> <strong>with</strong> <strong>Disabilities</strong><br />
Although the Conventions make a powerful case<br />
for inclusive education, they can also sometimes<br />
be misused to justify the perpetuation of segregated<br />
education. For example, children in residential<br />
special schools may be said to be accessing<br />
their right to be ‘included’ in education – even<br />
though their right to live <strong>with</strong> their families and<br />
to be a part of their own community is being<br />
violated.<br />
Inclusive education entails providing meaningful<br />
learning opportunities to all students <strong>with</strong>in the<br />
regular school system. Ideally, it allows children<br />
<strong>with</strong> and <strong>with</strong>out disabilities to attend the same<br />
age-appropriate classes at the local school, <strong>with</strong><br />
additional, individually tailored support as needed.<br />
It requires physical accommodation – ramps<br />
instead of stairs and doorways wide enough for<br />
wheelchair users, for example – as well as a new,<br />
child-centred curriculum that includes representations<br />
of the full spectrum of people found in society<br />
(not just persons <strong>with</strong> disabilities) and reflects<br />
Students learning mathematics use Braille in West Bengal, India. © UNICEF/INDA2009-00026/Khemka
the needs of all children. In an inclusive school,<br />
students are taught in small classes in which<br />
they collaborate and support one another rather<br />
than compete. <strong>Children</strong> <strong>with</strong> disabilities are not<br />
segregated in the classroom, at lunchtime or on<br />
the playground.<br />
Studies across countries show a strong link<br />
between poverty and disability 64 – one that is in<br />
turn linked to gender, health and employment<br />
issues. <strong>Children</strong> <strong>with</strong> disabilities are often caught<br />
in a cycle of poverty and exclusion: Girls become<br />
caregivers to their siblings rather than attend<br />
school, for example, or the whole family may be<br />
stigmatized, leading to their reluctance to report<br />
that a child has a disability or to take the child<br />
out in public. 65 The education of those who are<br />
excluded or marginalized, however, brings about<br />
poverty reduction. 66<br />
Inclusive approaches to education have received<br />
numerous global endorsements, including at<br />
the 1994 World Conference on Special Needs<br />
Education67 and, since 2002, through the global<br />
Education for All initiative on the right to education<br />
for persons <strong>with</strong> disabilities. 68 These<br />
approaches are by no means luxuries available<br />
only to the privileged or in high-income countries.<br />
Examples of inclusion in education are to<br />
be found in all regions of the world. To optimize<br />
the potential to include the excluded, all such<br />
efforts should apply the principles of universal<br />
design to learning systems and environments.<br />
An example of this is provided by the infographic<br />
published online at .<br />
Starting early<br />
The first steps towards inclusion are taken at<br />
home during the early years. If children <strong>with</strong> disabilities<br />
do not receive the love, sensory stimulation,<br />
health care and social inclusion to which<br />
they are entitled, they can miss important developmental<br />
milestones and their potential may be<br />
unfairly limited, <strong>with</strong> significant social and economic<br />
implications for themselves, their families<br />
and the communities in which they live.<br />
Ashiraff plays <strong>with</strong> friends at school in Togo after a<br />
local disabled people’s organization and international<br />
partners helped to realize his right to education.<br />
© UNICEF/Togo/2012/Brisno<br />
A child whose disability or developmental delay<br />
is identified at an early stage will have a much<br />
better chance of reaching her or his full capacity.<br />
Early childhood education, whether it is public,<br />
private or provided by the community, should<br />
be designed to respond to the child’s individual<br />
needs. Early childhood is important precisely<br />
because approximately 80 per cent of the brain’s<br />
capacity develops before the age of 3 and<br />
because the period between birth and primary<br />
school provides opportunities to tailor developmental<br />
education to the child’s needs. Studies<br />
suggest that the children who are at greatest<br />
disadvantage stand to benefit the most. 69<br />
Early childhood education is not limited to preschools<br />
and other childcare facilities – the home<br />
environment plays a fundamental role in stimulating<br />
and facilitating the development of the<br />
child. Studies from Bangladesh, 70 China, 71 India72 and South Africa73 have shown that enhanced<br />
interaction between mother and child and<br />
increased developmental activities benefit cognitive<br />
development in young children across a<br />
variety of settings, from home to health centre. 74<br />
(continued on p. 32)<br />
A STRONG FOUNDATION<br />
29
30<br />
PERSPECTIVE<br />
My son Hanif<br />
By Mohammad Absar<br />
Mohammad Absar lives in the<br />
village of Maddhyam Sonapahar in<br />
Mirershorai Province, Bangladesh.<br />
He has three sons and three<br />
daughters and supports his family<br />
by running a small tea stall.<br />
My son Hanif is 9 years old<br />
and attends the second grade.<br />
When he was 4, he got injured<br />
while playing. He started complaining<br />
about pain in his leg,<br />
which became red and swollen.<br />
We took him to Chittagong<br />
Medical Hospital. The doctors<br />
there tried to save Hanif’s leg,<br />
but it was severely infected,<br />
and eventually they decided to<br />
amputate it.<br />
After Hanif lost his leg, other<br />
children used to torment him:<br />
They called him ‘lame’ or ‘legless<br />
creep’ and pushed him to<br />
the ground when he tried to<br />
play <strong>with</strong> them. They also used<br />
to tease his brother, who suffers<br />
from mental illness. This always<br />
made me sad, and it used to<br />
drive my wife crazy. She would<br />
quarrel <strong>with</strong> people who said bad<br />
things about her children. As for<br />
Hanif – he became very reluctant<br />
to go out. He was miserable.<br />
Things began to improve after<br />
the local, non-governmental<br />
Organization for the Poor<br />
Community Advancement<br />
(OPCA) started conducting meetings<br />
in our area to raise awareness<br />
about disability and encourage<br />
people to have a positive<br />
approach towards those <strong>with</strong><br />
special needs.<br />
A rehabilitation worker from<br />
OPCA visited our home along<br />
<strong>with</strong> a teacher from the primary<br />
school. They encouraged us to<br />
enrol Hanif in school. Because<br />
the local primary school is half a<br />
kilometre away from our home,<br />
I had to carry my son to school<br />
every morning. I started a small<br />
shop near the school so I could<br />
be there to carry him home at<br />
the end of the day. At first, Hanif<br />
had a lot of trouble at school. His<br />
classmates, just like his peers in<br />
the neighbourhood, mocked him<br />
and called him names.<br />
One day, the rehabilitation worker<br />
informed us that the Centre<br />
for Disability in Development<br />
THE STATE OF THE WORLD’S CHILDREN 2013: <strong>Children</strong> <strong>with</strong> <strong>Disabilities</strong><br />
(CDD), a nationwide nongovernmental<br />
organization<br />
based in Dhaka, would provide<br />
my son <strong>with</strong> an artificial leg.<br />
We travelled to the capital,<br />
where Hanif was fitted for<br />
the prosthesis and given several<br />
days of training. He also<br />
received a pair of crutches. His<br />
stump is quite small and this<br />
makes it a bit difficult for him to<br />
climb stairs. Other than that, he<br />
can now do almost everything<br />
on his own.<br />
When he first got the new leg,<br />
people stared – it was very<br />
surprising to see him walking<br />
again. I myself had never imagined<br />
it would be possible. Some<br />
of our neighbours came to<br />
visit our home just to see the<br />
prosthesis.<br />
Now that my son can walk<br />
again and participate in all sorts<br />
of activities, other children have<br />
stopped calling him names.<br />
They don’t push him to the<br />
ground anymore. I no longer<br />
have to carry Hanif to school –<br />
he walks himself, and his classmates<br />
are eager to walk <strong>with</strong><br />
him. The most important thing<br />
is that Hanif is happier and<br />
more confident. His artificial leg<br />
allows him to be independent,<br />
and he no longer feels inferior<br />
to the other children. He is<br />
doing better in his classes and
Look at Hanif and you will see that <strong>with</strong> proper support<br />
and encouragement, people <strong>with</strong> disabilities can be<br />
effective in society.<br />
can now enjoy sports like cricket<br />
and soccer along <strong>with</strong> his peers.<br />
A rehabilitation worker has<br />
visited Hanif’s school several<br />
times to conduct awareness<br />
meetings on disability and the<br />
importance of inclusive education.<br />
Hanif’s surrounding<br />
environment is more disabilityfriendly<br />
than ever before. His<br />
school works to accommodate<br />
his needs. For example, Hanif<br />
has trouble climbing stairs, so<br />
when one of his classes was<br />
scheduled on the first floor,<br />
the principal agreed to move it<br />
downstairs to make it easier for<br />
Hanif to attend.<br />
While he’s in school, Hanif<br />
enjoys drawing pictures.<br />
Outside of school and during<br />
breaks, he loves to play. He<br />
wants to be a teacher when<br />
he grows up, just like his role<br />
models – his schoolteachers Mr.<br />
Arup and Mr. Shapan. They love<br />
Hanif very much and support<br />
him in every way they can.<br />
Because our family is very<br />
poor, my son’s artificial limb<br />
and associated expenses were<br />
provided by CDD through the<br />
Promoting Rights for Persons<br />
<strong>with</strong> <strong>Disabilities</strong> project funded<br />
by the Manusher Jonno<br />
Foundation. If Hanif has any<br />
problem <strong>with</strong> the prosthesis,<br />
rehabilitation workers visit our<br />
home and take care of it. As<br />
Hanif has grown, they have<br />
adjusted his artificial limb.<br />
Hanif also receives a disability<br />
allowance of 300 Bangladesh<br />
taka each month from our<br />
district’s Department of Social<br />
Services. I take him to the local<br />
bank to receive his allowance.<br />
Hanif will need additional support<br />
to ensure that he can<br />
continue his education <strong>with</strong>out<br />
interruption.<br />
Above all, I want my son to be<br />
well educated. An education<br />
will empower him and help<br />
guide him so that he can build a<br />
meaningful life. I think it would<br />
be best for Hanif to get a desk<br />
job so he doesn’t have to walk<br />
or stand too much. Perhaps he<br />
might work in an organization<br />
like CDD, where the environment<br />
is very disability-friendly.<br />
I saw people <strong>with</strong> various disabilities<br />
working there. Such<br />
an environment would help<br />
my son work to the best of his<br />
capacity, while at the same time<br />
securing an honourable position<br />
for him. He can become<br />
an example: Look at Hanif and<br />
you will see that <strong>with</strong> proper<br />
support and encouragement,<br />
people <strong>with</strong> disabilities can be<br />
effective in society.<br />
Hanif taking part in class. © Centre for Disability in Development<br />
A STRONG FOUNDATION<br />
31
32<br />
(continued from p. 29)<br />
Age-old biases and low expectations <strong>with</strong> regard<br />
to children <strong>with</strong> disabilities should not stand in<br />
the way of early childhood development. It is<br />
clear that <strong>with</strong> family and community support<br />
from the earliest days of their lives, children <strong>with</strong><br />
disabilities are better placed to make the most of<br />
their school years and to prepare themselves for<br />
adulthood.<br />
Working <strong>with</strong> teachers<br />
Teachers are a – and perhaps the – key element<br />
in a child’s learning environment, so it is important<br />
that they have a clear understanding of<br />
inclusive education and a strong commitment<br />
to teaching all children.<br />
All too often, however, teachers lack appropriate<br />
preparation and support in teaching children<br />
<strong>with</strong> disabilities in regular schools. This is a<br />
factor in the stated unwillingness of educators<br />
in many countries to support the inclusion of<br />
children <strong>with</strong> disabilities in their classes. 75 For<br />
example, one study of prospective teachers<br />
of special education in Israel found they held<br />
unhelpful preconceptions about people <strong>with</strong> disabilities,<br />
and that some discriminated between<br />
different types of disability. 76 Resources for<br />
children <strong>with</strong> disabilities tend to be allocated to<br />
segregated schools rather than to an inclusive<br />
mainstream education system. This can prove<br />
costly as well as inappropriate: In Bulgaria, the<br />
budget per child educated in a special school<br />
can be up to three times higher than that for a<br />
similar child in a regular school. 77<br />
A review of the situation of children <strong>with</strong> intellectual<br />
disabilities in 22 European countries<br />
highlighted the lack of training of regular teachers<br />
to work <strong>with</strong> children <strong>with</strong> disabilities as a<br />
major concern. Most of the time, these students<br />
were taught by support staff rather than certified<br />
teachers. Teacher training has proved effective in<br />
fostering commitment to inclusion. A 2003 study<br />
found that school principals who had taken more<br />
courses on disability expressed more inclusive<br />
views. And shifting attitudes benefit students:<br />
THE STATE OF THE WORLD’S CHILDREN 2013: <strong>Children</strong> <strong>with</strong> <strong>Disabilities</strong><br />
Positive views on inclusion translated into less<br />
restrictive placements for specific students <strong>with</strong><br />
disabilities. 78 Another study from 2001 found that<br />
a course on inclusion for those studying to be<br />
teachers was effective in changing their attitudes,<br />
so that they favoured including children <strong>with</strong><br />
mild disabilities in the classroom. 79<br />
The greatest opportunity appears to exist among<br />
teachers who are still fresh in the profession. A<br />
recent systematic literature review of countries as<br />
diverse as China, Cyprus, India, Iran, the Republic<br />
of Korea, the State of Palestine, the United Arab<br />
Emirates and Zimbabwe found that teachers <strong>with</strong><br />
the least general teaching experience had more<br />
positive attitudes than those <strong>with</strong> longer service.<br />
Teachers who had received training in inclusive<br />
education had more positive attitudes than those<br />
who had received no training, and those who had<br />
the most positive attitudes were those <strong>with</strong> actual<br />
experience of inclusion. 80<br />
Yet pre-service training rarely prepares teachers<br />
to teach inclusively. Where training exists,<br />
it is of variable quality. Although numerous<br />
toolkits exist, these are not always geared to a<br />
specific context, and so will frequently contain<br />
foreign concepts. Group learning is one example.<br />
Teachers have responded negatively to pictures<br />
of children <strong>with</strong> and <strong>with</strong>out disabilities seated in<br />
groups, as this is at odds <strong>with</strong> the way students<br />
interact in more traditional classrooms. 81<br />
Another challenge is the lack of diversity among<br />
teaching personnel. Teachers <strong>with</strong> disabilities<br />
are quite rare and in some settings considerable<br />
obstacles exist for adults <strong>with</strong> disabilities to qualify<br />
as teachers. In Cambodia, for example, the law<br />
states that teachers must be “free of disabilities.” 82<br />
Partnerships <strong>with</strong> civil society are providing<br />
encouraging examples of ways to enhance<br />
teacher training and diversity. In Bangladesh, the<br />
Centre for Disability in Development (CDD), a<br />
national non-governmental organization (NGO),<br />
employs a group of inclusive education trainers<br />
who run 10-day training sessions during school
terms for 20 schools at a time, <strong>with</strong> training provided<br />
to one teacher from each school. 83 Several<br />
of the CDD trainers are visually impaired or have<br />
other disabilities, so they are important role<br />
models for teachers and students <strong>with</strong> and <strong>with</strong>out<br />
disabilities. And in Mozambique, Ajuda de<br />
Desenvolvimento de Povo para Povo, a national<br />
NGO, has worked closely <strong>with</strong> the national disabled<br />
people’s organization known as ADEMO to<br />
train student teachers to work <strong>with</strong> children <strong>with</strong><br />
disabilities and to train student teachers who<br />
have disabilities. 84<br />
Teachers tend to work in isolation, which means<br />
they are often unsupported in the classroom,<br />
and are often under pressure to complete a narrow<br />
syllabus imposed from above. Inclusive<br />
education requires a flexible approach to school<br />
organization, curriculum development and pupil<br />
assessment. Such flexibility would allow for<br />
the development of a more inclusive pedagogy,<br />
shifting the focus from teacher-centred to childcentred<br />
to embrace diverse learning styles.<br />
Teachers need to be able to call on specialist help<br />
from colleagues who have greater expertise and<br />
experience of working <strong>with</strong> children <strong>with</strong> disabilities,<br />
especially children <strong>with</strong> sensory or intellectual<br />
impairments. For example, specialists can<br />
advise on the use of Braille or computer-based<br />
instruction. 85 Where such specialists are relatively<br />
few, they can travel between schools as needed.<br />
Even these itinerant specialist teachers can be in<br />
short supply in such low-income areas as sub-<br />
Saharan Africa. 86 This presents an opportunity for<br />
appropriate support from providers of financial<br />
and technical assistance from the international<br />
to the local level.<br />
Involving parents, communities<br />
and children<br />
Inclusive education programmes that focus only<br />
on classroom practices fail to harness parents’<br />
potential to contribute to inclusive education –<br />
and to prevent such violations as the confinement<br />
of children <strong>with</strong> disabilities to separate rooms.<br />
Parents can play many roles, from providing<br />
accessible transport to raising awareness, getting<br />
involved in civil society organizations and<br />
liaising <strong>with</strong> the health sector so that children<br />
have access to appropriate equipment and support<br />
and <strong>with</strong> the social sectors to access grants<br />
and credit schemes to reduce poverty. In many<br />
countries, schools have community committees<br />
that are engaged in a wide range of activities<br />
to support inclusion. For example, in Viet Nam,<br />
Community Steering Committees have been<br />
involved in advocacy, local training, securing<br />
assistive devices, providing financial support<br />
and developing accessible environments. 87 It is<br />
important that parents and community members<br />
realize that they have contributions to make and<br />
that their contributions are used.<br />
Although the importance of child participation<br />
and child agency is well documented, they sit<br />
uncomfortably <strong>with</strong>in the existing structures and<br />
(continued on p. 36)<br />
Boys play football at the Nimba Centre in Conakry, Guinea.<br />
The centre provides training for people <strong>with</strong> physical<br />
disabilities. © UNICEF/HQ2010-1196/Asselin<br />
A STRONG FOUNDATION<br />
33
34<br />
PERSPECTIVE<br />
The new normal<br />
By Claire Halford<br />
Claire Halford lives in Melbourne,<br />
Australia, <strong>with</strong> her partner and<br />
their two children. She worked in<br />
fashion and the visual arts before<br />
becoming a full-time caregiver for<br />
her son Owen.<br />
Everybody hopes for a healthy<br />
baby when expecting a child.<br />
When asked, “What are you having?”<br />
expectant mums and dads<br />
respond, “Oh, we don’t mind, as<br />
long as it’s healthy.”<br />
I remember the first-trimester<br />
milestone <strong>with</strong> my first-born son,<br />
Owen: I told the midwife that I<br />
had stopped smoking and drinking,<br />
ate a healthy diet, exercised<br />
moderately and felt pretty good<br />
about carrying a child. “That’s<br />
great,” she said in a reassuring<br />
tone. “After all, what can go<br />
wrong <strong>with</strong> a healthy female in<br />
a first-world country in professional<br />
medical care?” Little did<br />
I know that in about six months<br />
I would find out exactly what<br />
could go wrong.<br />
My son’s birth, at full term, was<br />
incredibly traumatic. When he<br />
finally entered the world, he<br />
could not breathe. His brain was<br />
deprived of oxygen. He was<br />
resuscitated and ventilated, and<br />
for two weeks he was swapped<br />
between intensive care and<br />
special care. He had his first<br />
seizure at 1 day old. Until he was<br />
2 years old, epilepsy invaded our<br />
lives all day, every day.<br />
My son was diagnosed <strong>with</strong><br />
cerebral palsy (CP) at 5 months.<br />
Cerebral palsy is a broad term<br />
describing a brain injury that can<br />
occur in utero, during birth or in<br />
early childhood. In Australia, CP<br />
is the most common cause of<br />
physical disability in childhood,<br />
and it is a disability that affects<br />
children in all countries whether<br />
they are affluent or poor. The<br />
condition mostly affects movement<br />
and muscle tone. Owen<br />
has severe CP: He cannot sit,<br />
roll, walk or speak.<br />
Following his diagnosis, correspondence<br />
from doctors arrived<br />
in the post on an almost weekly<br />
basis. Initial letters delivered<br />
brutal realities, using medicalspeak<br />
like ‘spastic quadriplegic’,<br />
‘cortical visual impairment’<br />
and ‘globally developmentally<br />
delayed’ – terms that were completely<br />
foreign. Every online<br />
search ended in ‘prognosis poor’.<br />
THE STATE OF THE WORLD’S CHILDREN 2013: <strong>Children</strong> <strong>with</strong> <strong>Disabilities</strong><br />
In those early days, the only<br />
shining light in all this shocking<br />
darkness was Owen’s beautiful<br />
personality, infectious laugh,<br />
obvious engagement <strong>with</strong> the<br />
world around him and emerging<br />
handsome looks.<br />
The first year was very hard.<br />
Anger – no, rage – and disappointment,<br />
devastation, loneliness<br />
and disbelief lurked at<br />
every corner. As the midwife had<br />
suggested, this wasn’t supposed<br />
to happen to me, to him, to<br />
us – this was a mistake! Friends<br />
and family could say or do nothing<br />
right, so I sought out others<br />
who were in a similar position,<br />
through support groups in my<br />
area and on the Internet.<br />
Around the time of Owen’s diagnosis,<br />
I received a phone call<br />
from the university at which<br />
I had once worked, asking if I’d<br />
like to return to teach life drawing<br />
and design part-time. This<br />
job was to have been my ticket<br />
out of employment in retail; it<br />
was to have been something<br />
meaningful I could sink my teeth<br />
into. I declined. I had new work:<br />
Now I was a full-time caregiver.<br />
It turned out that Owen had<br />
intractable seizures that did not<br />
respond to epilepsy medication.<br />
So we started 2-year-old<br />
Owen on a medical diet for
epilepsy. The ketogenic diet is<br />
an incredibly strict high-fat, lowcarbohydrate<br />
diet. In a bizarre,<br />
unexpected stroke of grace, it<br />
worked. My poor suffering son<br />
went from having up to 200<br />
seizures a day to almost none<br />
in the first three months. He has<br />
been virtually seizure-free since.<br />
My partner and I have since had<br />
another son, a healthy toddler<br />
whom we love as dearly as we<br />
do Owen. He has brought us<br />
another perspective on life. Our<br />
family life has come to define<br />
us. The connection we have<br />
makes us stronger – to us, our<br />
lifestyle is normal; we carry on.<br />
It’s normal to drive all over town<br />
to do physical therapy many<br />
times a week; it’s normal to haul<br />
heavy equipment like standing<br />
frames and bath chairs from<br />
room to room every day. We<br />
know the children’s hospital like<br />
the backs of our hands and are<br />
familiar <strong>with</strong> many of the top<br />
specialists in various fields of<br />
paediatric medicine.<br />
I call myself my son’s<br />
‘personal assistant’ because<br />
he has a never-ending<br />
stream of paperwork,<br />
funding applications, doctor’s<br />
appointments, therapy sessions,<br />
check-ups and blood tests. I<br />
do most of his personal care,<br />
such as feeding and bathing.<br />
My partner helps when he can,<br />
but he works very long hours to<br />
keep us all afloat financially – so<br />
that I can care for Owen and<br />
we can have a comfortable<br />
life. We try to keep busy on the<br />
weekends, doing family things<br />
like visiting the farmer’s market,<br />
going out for Vietnamese food<br />
or checking out a kids’ show.<br />
Owen has a pretty fun and<br />
busy life for a 5-year-old. Yet<br />
no matter how good things can<br />
be, he has a long and difficult<br />
journey ahead of him.<br />
We are hoping to place Owen<br />
in a mainstream primary school<br />
<strong>with</strong> the support of the Cerebral<br />
Palsy Education Centre, an early<br />
intervention programme. Owen<br />
has shown vast improvement<br />
in communication and movement<br />
since he started going<br />
there. He also attends activities<br />
at the Riding for the Disabled<br />
Association, which we both<br />
love. Over the years we have<br />
spent so much money and time<br />
on therapies and services –<br />
some of them good, others not<br />
that helpful. We’re learning as<br />
we go, and we’re getting better<br />
at making practical rather than<br />
emotional decisions. It’s still<br />
hard for us, though; I’m always<br />
fighting or waiting for something<br />
he desperately needs,<br />
sometimes for years.<br />
The hardest battles have to do<br />
<strong>with</strong> people’s perceptions of<br />
Owen. I just want him to be<br />
treated and spoken to like a<br />
regular kid – but I also want him<br />
to receive special attention, and<br />
for people to be more patient.<br />
I want my friends and family to<br />
help him and engage <strong>with</strong> him<br />
more. Many of them tend to<br />
focus on how I am doing or on<br />
something else that’s less challenging<br />
than Owen’s very real<br />
problems. It’s hard for them,<br />
too – <strong>with</strong> everything he has<br />
going on, I sometimes think<br />
he should come <strong>with</strong> an<br />
instruction manual.<br />
I’ve often feared that the<br />
things that defined me before<br />
I became a caregiver – work,<br />
creative interests and a social<br />
life – have been lost down a<br />
well of grief and exhaustion.<br />
More often than not, however,<br />
I feel like my life before Owen<br />
was born was comparatively<br />
superficial. Becoming a caregiver<br />
for my own child has been<br />
an overwhelmingly profound<br />
and joyful experience. We celebrate<br />
small accomplishments<br />
feverishly, and my expectations<br />
of what success entails have<br />
been smashed and rebuilt into<br />
something beautifully simple:<br />
Owen sitting unaided for five<br />
seconds, or, as he watches the<br />
Paralympics on television, hearing<br />
the words ‘cerebral palsy’<br />
and ‘champion’ in the same<br />
sentence. I have grown through<br />
caring for Owen – above all,<br />
perhaps, in my ability to<br />
empathize.<br />
I have learned that no matter<br />
what a child can’t do, she or he<br />
will still always have an identity<br />
and a character that will leave<br />
a distinctive brushstroke on<br />
this world. If we want to be an<br />
enlightened society, our job is<br />
to believe and encourage. Only<br />
then can children who have<br />
such difficult limitations grow.<br />
And then we can all come to<br />
see that things that ‘go wrong’<br />
are sometimes just different –<br />
and often amazing.<br />
A STRONG FOUNDATION<br />
35
36<br />
(continued from p. 33)<br />
system of education. This is true for all children,<br />
<strong>with</strong> or <strong>with</strong>out disabilities: Few are involved<br />
in making decisions about their education and<br />
lives. Involving children <strong>with</strong> disabilities in such<br />
decisions can be particularly challenging, not<br />
least because of ingrained thinking and behaviour<br />
that perceives them as passive victims. As<br />
the 2011 Report of the Secretary-General on the<br />
Status of the Convention on the Rights of the<br />
Child noted, “It remains difficult for children <strong>with</strong><br />
disabilities to have their voices heard. Initiatives<br />
such as school councils and children’s parliaments,<br />
consultative processes to elicit children’s<br />
views, as well as judicial proceedings, commonly<br />
fail to ensure the inclusion of children <strong>with</strong> disabilities,<br />
or acknowledge their capacities for<br />
participation.” 88<br />
The most underused resource in schools and<br />
communities all over the world is the children<br />
themselves. The Child-to-Child Trust in the United<br />
Kingdom has worked for many years to promote<br />
children’s involvement in health education, and<br />
in some countries this approach has been used<br />
to good effect as part of inclusive education and<br />
community-based rehabilitation programmes. 89<br />
In participatory research, for example, children<br />
frequently highlight the importance of a clean<br />
environment and hygienic toilets, and for children<br />
<strong>with</strong> disabilities, the issues of privacy and<br />
accessibility are paramount. 90 It stands to reason<br />
that children <strong>with</strong> disabilities can and must guide<br />
and evaluate efforts to advance accessibility and<br />
inclusion. After all, who better to understand the<br />
means and impact of exclusion?<br />
Lines of responsibility<br />
As in other fields of endeavour, it will help to<br />
realize aspirations for inclusive education if governments<br />
and their partners are clear about who<br />
is to do what and how, and to whom they are<br />
expected to report. Otherwise, the promise of<br />
inclusion risks becoming a matter of lip service.<br />
One study of countries engaged in what was<br />
once known as the Education For All Fast Track<br />
THE STATE OF THE WORLD’S CHILDREN 2013: <strong>Children</strong> <strong>with</strong> <strong>Disabilities</strong><br />
Initiative (FTI) and is now called the Global<br />
Partnership for Education found that ‘‘a number<br />
of FTI-endorsed countries, particularly those<br />
which are approaching universal primary education,<br />
do now have national education sector<br />
plans which address the inclusion of disabled<br />
children. […] However, in a number of countries,<br />
policies and provision for disabled children<br />
remain cursory or have not been implemented.”<br />
91 The report notes that in five FTI-endorsed<br />
countries there was no mention at all of children<br />
<strong>with</strong> disabilities.<br />
Sometimes, the problem is one of divided or<br />
unclear mandates: In Bangladesh there is some<br />
confusion about which ministries are responsible<br />
for children <strong>with</strong> disabilities of school age. The<br />
mandate for implementing Education For All lies<br />
<strong>with</strong> the Ministry of Education and the Ministry of<br />
Primary and Mass Education, but the education<br />
of children <strong>with</strong> disabilities is managed by the<br />
Ministry of Social Welfare and is seen as a<br />
matter of charity, not a human rights issue. 92<br />
Since 2002, children <strong>with</strong> disabilities and those<br />
<strong>with</strong> special educational needs have been included<br />
in primary education through the Primary<br />
Education Development Programme93 under<br />
the Ministry of Education. But managing integrated<br />
educational provision for children <strong>with</strong><br />
visual impairments and running primary schools<br />
for children <strong>with</strong> hearing, visual or intellectual<br />
impairments remains the responsibility the<br />
Ministry of Social Welfare. 94<br />
Ministries of Education should be encouraged to<br />
take responsibility for all children of school age.<br />
Coordination <strong>with</strong> partners and stakeholders can<br />
play a strong supporting role in this process. In<br />
Bangladesh, the National Forum of Organizations<br />
Working <strong>with</strong> the Disabled promotes networking<br />
between the government and NGOs, and<br />
has been instrumental in encouraging greater<br />
educational inclusion as well as a gradual shift<br />
of ministerial responsibility from social welfare<br />
to education. As a consequence, the Campaign<br />
for Popular Education, a national network, has<br />
committed to ensuring that all children <strong>with</strong>
Reading Braille at a school in Uganda. © UNICEF/UGDA2012-00112/Sibiloni<br />
disabilities have access to basic and quality education,<br />
and the non-governmental Bangladesh<br />
Rural Advancement Committee, which is committed<br />
to achieving Education For All and poverty<br />
reduction, now includes learners <strong>with</strong> disabilities<br />
in its schools.<br />
Exclusion denies children <strong>with</strong> disabilities the<br />
lifelong benefits of education: a better job, social<br />
and economic security, and opportunities for<br />
full participation in society. In contrast, investment<br />
in the education of children <strong>with</strong> disabilities<br />
can contribute to their future effectiveness as<br />
members of the labour force. Indeed, a person’s<br />
potential income can increase by as much as 10<br />
per cent <strong>with</strong> each additional year of schooling. 95<br />
But inclusive education can also reduce current<br />
and future dependence, freeing other household<br />
members from some of their caring responsibilities,<br />
and allowing them to resume productive<br />
activity – or simply to rest. 96<br />
Basic reading and writing skills also improve<br />
health: A child born to a mother who can read is<br />
50 per cent more likely to survive past the age of<br />
5. 97 Lower maternal education has been linked<br />
to higher rates of stunting among children in<br />
the urban slums of Kenya, 98 Roma settlements<br />
in Serbia, 99 and in Cambodia. 100 Better-educated<br />
Bangladeshi parents decreased their child’s risk<br />
of stunting by up to 5.4 per cent (4.6 per cent in<br />
the case of mothers, and between 2.9 and 5.4 per<br />
cent for fathers), and better-educated Indonesian<br />
parents accounted for up to a 5 per cent decrease<br />
(between 4.4 and 5 per cent for mothers, and 3 per<br />
cent for fathers) in their child’s odds of stunting. 101<br />
Education is both a useful instrument and a right,<br />
the purpose of which, as stated in the Convention<br />
on the Rights of the Child, is to promote “the<br />
development of the child’s personality, talents<br />
and mental and physical abilities to their<br />
fullest potential.” 102<br />
A STRONG FOUNDATION<br />
37
38<br />
PERSPECTIVE<br />
Adjusting, adapting and empowering<br />
By Yahia J. Elziq<br />
Yahia J. Elziq is a Technical Advisor<br />
for Handicap International in<br />
Ramallah, State of Palestine.<br />
Saja was 7 years old when<br />
I met her.<br />
At that time I was working<br />
in one of the three national<br />
rehabilitation centres in the<br />
West Bank as an occupational<br />
therapist. Although this centre<br />
is not set up to handle Saja’s<br />
needs and demands as a child<br />
<strong>with</strong> cerebral palsy, we were<br />
able to provide therapy sessions<br />
to prevent deterioration<br />
in her condition. The two main<br />
obstacles that still prevent<br />
her from reaching appropriate<br />
rehabilitation services<br />
are the absence of referral<br />
mechanisms and coordination<br />
between services in the West<br />
Bank, and the restrictions on<br />
movement that are imposed<br />
on Palestinians under occupation.<br />
The specialized rehabilitation<br />
centre for such conditions<br />
is based in East Jerusalem, but<br />
Saja’s family was refused permission<br />
to enter the city.<br />
In addition, children <strong>with</strong> disabilities<br />
in the West Bank, as<br />
elsewhere, confront a general<br />
lack of knowledge and skills<br />
about disability throughout<br />
the public and private sec-<br />
THE STATE OF THE WORLD’S CHILDREN 2013: <strong>Children</strong> <strong>with</strong> <strong>Disabilities</strong><br />
tors. They are also faced <strong>with</strong><br />
a dominant perspective that<br />
regards people <strong>with</strong> disabilities<br />
as pitiable and as worthy<br />
to receive charity – but not as<br />
individuals <strong>with</strong> rights who<br />
have the same entitlements as<br />
others, and who can and do<br />
contribute to society.<br />
In this context Saja has been<br />
lucky. After an extensive evaluation,<br />
our team developed a<br />
plan to support and improve<br />
her participation in the community.<br />
The priority for her<br />
and her family was to have<br />
her enrolled in regular school.<br />
However, in order to attend<br />
a mainstream school, she<br />
needed various environmental<br />
changes – among them,<br />
the school premises had to<br />
be physically accessible, and<br />
she needed to have a suitable<br />
wheelchair. Full collaboration<br />
from her family, school<br />
and community were absolute<br />
necessities. Saja needed<br />
integrated activities involving<br />
many stakeholders, starting<br />
from her own parents,<br />
who tended to use available<br />
resources in favour of her<br />
brother, who has the same
Saja opened my eyes to my own ability to adjust and adapt as<br />
a professional – and to the positive impact that we therapeutic<br />
professionals can have if we adopt empowering attitudes.<br />
condition, leaving her <strong>with</strong>out<br />
the opportunity to develop to<br />
her full potential.<br />
Tackling all these issues was<br />
made difficult because of the<br />
absence of adequate national<br />
policy. There is no inclusive<br />
education programme for<br />
children <strong>with</strong> disabilities, for<br />
example, and disabilityinclusive<br />
policies are not priorities<br />
for decision-makers.<br />
For these reasons, the fate of<br />
children <strong>with</strong> disabilities relies<br />
heavily on the willingness of<br />
community members to recognize<br />
that these children have<br />
the same rights as all children.<br />
When these rights are<br />
recognized, many issues can<br />
be solved – often simply by<br />
mobilizing existing community<br />
resources.<br />
Fortunately, in Saja’s case,<br />
negotiations <strong>with</strong> the school<br />
principal succeeded and her<br />
classroom was moved from<br />
the second to the ground floor.<br />
The teachers accepted the idea<br />
of having her in their class.<br />
By using our own networks<br />
of professional and personal<br />
contacts, we were able to get<br />
her a suitable wheelchair and,<br />
thanks to some local doctors<br />
and a health centre, her family<br />
was able to obtain free treatment<br />
to improve her eyesight.<br />
Social workers helped raise<br />
awareness of her particular<br />
situation <strong>with</strong>in her family, and<br />
a psychologist supported her<br />
in overcoming her experience<br />
of discrimination.<br />
Over just a couple of years,<br />
Saja’s situation improved<br />
dramatically as some of her<br />
health issues were addressed,<br />
her mobility improved and her<br />
self-esteem and confidence<br />
improved along <strong>with</strong> her social<br />
interactions, knowledge and<br />
life skills. As a person, I was<br />
overjoyed at seeing Saja’s<br />
progress. As a rehabilitation<br />
professional, it was highly<br />
rewarding.<br />
Saja opened my eyes to my<br />
own ability to adjust and adapt<br />
as a professional – and to the<br />
positive impact that we therapeutic<br />
professionals can have<br />
if we adopt empowering attitudes.<br />
More importantly, she<br />
helped me to understand the<br />
value and importance of taking<br />
a holistic view of the individual<br />
child and of taking a comprehensive<br />
approach in working<br />
<strong>with</strong> persons <strong>with</strong> disabilities<br />
and their community. This is<br />
the only way to ensure that<br />
children <strong>with</strong> disabilities can<br />
have the same opportunities<br />
as other children to participate<br />
in community life.<br />
I want to share this realization<br />
<strong>with</strong> policymakers so they<br />
can take a more empowering,<br />
holistic approach to their work.<br />
Good policies – made <strong>with</strong> the<br />
involvement of children <strong>with</strong><br />
disabilities and disabled persons’<br />
organizations, and properly<br />
implemented – will help<br />
to ensure that when the next<br />
Saja comes to us, she and her<br />
family will know what she is<br />
entitled to, and what she might<br />
expect to achieve – which is<br />
what every other girl of her<br />
age in her community can<br />
expect to achieve. This is the<br />
message that the Convention<br />
on the Rights of Persons <strong>with</strong><br />
<strong>Disabilities</strong> and the Convention<br />
on the Rights of the Child<br />
give us, and that we want<br />
to promote every day.<br />
A STRONG FOUNDATION<br />
39
A teacher trained in inclusive education checks on 5-year-old Sok Chea, who is deaf and mute, at a preschool in Cambodia.<br />
© UNICEF/Cambodia/2011/Mufel
Obtaining protection can be a particular challenge<br />
for children <strong>with</strong> disabilities. In societies<br />
where they are stigmatized and their families<br />
are exposed to social or economic exclusion,<br />
many children <strong>with</strong> disabilities are not even able<br />
to obtain an identity document. Their births go<br />
unregistered: They might not be expected to<br />
survive, 103 their parents might not want to admit<br />
to them, or they might be considered a potential<br />
drain on public resources. This is a flagrant violation<br />
of these children’s human rights and a fundamental<br />
barrier to their participation in society.<br />
It can seal their invisibility and increase their vulnerability<br />
to the many forms of exploitation that<br />
result from not having an official identity.<br />
States parties to the Convention on the Rights of<br />
Persons <strong>with</strong> <strong>Disabilities</strong> (CRPD) have given themselves<br />
the clear obligation to guarantee effective<br />
legal protection for children <strong>with</strong> disabilities. They<br />
have also embraced the principle of ‘reasonable<br />
accommodation’, which requires that necessary<br />
and appropriate adaptations be made so that<br />
children <strong>with</strong> disabilities can enjoy their rights on<br />
an equal basis <strong>with</strong> others. For resulting legislation<br />
and efforts to change discriminatory social<br />
norms to be meaningful, it is also necessary to<br />
make certain that laws are enforced and children<br />
<strong>with</strong> disabilities are informed about their right to<br />
protection from discrimination and about how to<br />
exercise this right. Separate systems for children<br />
<strong>with</strong> disabilities would be inappropriate. As <strong>with</strong><br />
ESSENTIALS OF<br />
PROTECTION<br />
<strong>Children</strong> <strong>with</strong> disabilities are among the most vulnerable<br />
members of society. They stand to benefit the most from<br />
measures to count them, protect them against abuse<br />
and guarantee them access to justice.<br />
the other aspects of life and society discussed in<br />
this report, equity through inclusion is the goal.<br />
Abuse and violence<br />
CHAPTER 4<br />
Discrimination against and exclusion of children<br />
<strong>with</strong> disabilities renders them disproportionately<br />
vulnerable to violence, neglect and abuse. Studies<br />
from the United States have shown that children<br />
<strong>with</strong> disabilities who are in preschool or younger<br />
are more likely to be abused than peers <strong>with</strong>out<br />
disabilities. 104 A national survey of deaf adults in<br />
Norway found that girls were twice as likely to<br />
experience sexual abuse, and boys three times as<br />
likely, as peers who had no disability. 105 <strong>Children</strong><br />
who may already be suffering stigma and isolation<br />
have also been shown to be more likely to<br />
suffer physical abuse.<br />
Some forms of violence are specific to children<br />
<strong>with</strong> disabilities. For example, they may be subject<br />
to violence administered under the guise of treatment<br />
for behaviour modification, including electroconvulsive<br />
treatment, drug therapy or electric<br />
shocks. 106 Girls <strong>with</strong> disabilities endure particular<br />
abuses, and in many countries are subject to forced<br />
sterilization or abortion. 107 Such procedures are<br />
defended on grounds of avoidance of menstruation<br />
or unwanted pregnancy, or even ascribed to a<br />
mistaken notion of ‘child protection’, given the disproportionate<br />
vulnerability of girls <strong>with</strong> disabilities<br />
to sexual abuse and rape. 108 As of the beginning of<br />
ESSENTIALS OF PROTECTION<br />
41
42<br />
2013, the World Health Organization was developing<br />
guidance designed to combat the human<br />
rights abuse of forced sterilization.<br />
Institutions and inappropriate care<br />
In many countries, children <strong>with</strong> disabilities continue<br />
to be placed in institutions. It is rare for<br />
these facilities to provide the individual attention<br />
that children need to develop to their full capacity.<br />
The quality of educational, medical and rehabilitative<br />
care provided in institutions is often insufficient<br />
because standards of appropriate care for<br />
children <strong>with</strong> disabilities are lacking or, where<br />
such standards exist, because they are not monitored<br />
and enforced.<br />
Under the Convention on the Rights of the Child<br />
(CRC), children <strong>with</strong> and <strong>with</strong>out disabilities have<br />
the right to be cared for by their parents (Article<br />
7) and to not be separated from their parents<br />
unless this is deemed by a competent authority<br />
to be in the child’s best interest (Article 9). The<br />
<strong>Children</strong> <strong>with</strong> disabilities who live <strong>with</strong> their families<br />
generally obtain their secondary education in<br />
mainstream schools. <strong>Children</strong> <strong>with</strong> disabilities who<br />
live in orphanages tend to not attend secondary<br />
school at all.<br />
70% 71%<br />
67%<br />
General<br />
school<br />
12% 12% 12%<br />
Special<br />
school<br />
18%<br />
21%<br />
17%<br />
No<br />
school<br />
<strong>Children</strong> <strong>with</strong> disabilities in the<br />
care of families<br />
5%<br />
8%<br />
2%<br />
General<br />
school<br />
23% 21% 21%<br />
Special<br />
school<br />
72% 72% 72%<br />
No<br />
school<br />
<strong>Children</strong> <strong>with</strong> disabilities in the<br />
care of orphanages<br />
THE STATE OF THE WORLD’S CHILDREN 2013: <strong>Children</strong> <strong>with</strong> <strong>Disabilities</strong><br />
CRPD reinforces this in Article 23, which states<br />
that where the immediate family is unable to care<br />
for a child <strong>with</strong> disabilities, States parties must<br />
take every measure to provide alternative care<br />
<strong>with</strong>in the extended family or community.<br />
In many countries, foster families are a frequent<br />
form of alternative care. Foster families may feel<br />
reluctant to take on the care of a child <strong>with</strong> a disability<br />
because of the perceived extra burden of<br />
care and additional physical and psychological<br />
demands. Organizations tasked <strong>with</strong> placing children<br />
in families can encourage them to consider<br />
fostering children <strong>with</strong> disabilities, and provide<br />
them <strong>with</strong> appropriate training and support.<br />
Where authorities have come to see the perils<br />
of institutional care and have moved to return<br />
children to their families or communities, children<br />
<strong>with</strong> disabilities have been among the last<br />
to be removed from institutions and transferred<br />
to alternative care. In many countries of Central<br />
and Eastern Europe and the Commonwealth of<br />
<strong>Children</strong> <strong>with</strong> disabilities and secondary education<br />
uArmenia, 2011<br />
Total Male Female Total Male Female<br />
The main reason children <strong>with</strong> disabilities who are<br />
in the care of their families do not attend school is<br />
because their parents think their children cannot<br />
study at school.<br />
4% 4% 3%<br />
Refused<br />
admission<br />
6% 4% 9% 7% 8% 4%<br />
Distance/<br />
transportation<br />
Parents see<br />
no need<br />
for school<br />
26%<br />
19%<br />
14%<br />
Insufficient<br />
conditions<br />
at school<br />
34% 37%<br />
29%<br />
Health<br />
condition<br />
48%47% 57%<br />
Parents think<br />
child cannot<br />
study at school<br />
Source: Ministry of Labour and Social Issues of the Republic of Armenia and UNICEF, It’s About Inclusion: Access to education, health and social protection services<br />
for children <strong>with</strong> disabilities in Armenia. UNICEF/Yerevan, 2012, .<br />
Sample sizes: 5,707 children in total sample; 5,322 children <strong>with</strong> disabilities in the care of families; 385 children <strong>with</strong> disabilities in the care of orphanages.<br />
Age range: Total sample: 0–18 years old. Secondary education questions: 6–18 years old.
Independent States, institutionalized care is being<br />
reformed and children are being moved from<br />
large facilities to smaller group homes or familybased<br />
care. Serbia, for example, began wholesale<br />
reforms in 2001. Deinstitutionalization was given<br />
priority and fostering, which had an established<br />
history in the country, was given a boost. A new<br />
family law was adopted and a fund was established<br />
to help develop community-based social<br />
services. Progress ensued, but close examination<br />
revealed that children <strong>with</strong>out disabilities had<br />
been released from institutions at a much faster<br />
rate than children <strong>with</strong> disabilities – about 70<br />
per cent of whom had been committed to care<br />
directly from a maternity ward. This revelation<br />
served to demonstrate the importance of ensuring<br />
that reforms are designed and implemented<br />
so no children are excluded from progress, and<br />
it has since led to a renewed commitment to<br />
deinstitutionalization. 109<br />
Inclusive justice<br />
A State’s responsibility to protect the rights of all<br />
children under its jurisdiction extends equally to<br />
children <strong>with</strong> disabilities who are in contact <strong>with</strong><br />
the law – whether as victims, witnesses, suspects<br />
or convicts. Specific measures can help: <strong>Children</strong><br />
<strong>with</strong> disabilities can be interviewed in appropriate<br />
languages, whether spoken or signed. Law<br />
enforcement officers, social workers, lawyers,<br />
judges and other relevant professionals can be<br />
trained to work <strong>with</strong> children who have disabilities.<br />
Systematic and continuous training of all<br />
professionals involved in the administration of<br />
justice for children is vital, as is the establishment<br />
of regulations and protocols that enhance<br />
equal treatment of children <strong>with</strong> disabilities.<br />
It is also important to develop alternative solutions<br />
to formal judicial proceedings, taking into<br />
account the range of individual capacities of<br />
children who have disabilities. Formal legal<br />
procedures should only be used as a measure<br />
of last resort, where this is in the interest of<br />
public order, and care should be taken to<br />
explain the process and the child’s rights.<br />
Last to benefit<br />
Under Serbia’s welfare reforms, children <strong>with</strong><br />
disabilities were released from institutions at a<br />
slower rate than children <strong>with</strong>out disabilities.<br />
100%<br />
37%<br />
DECREASE<br />
100%<br />
63%<br />
DECREASE<br />
91%<br />
79%<br />
83%<br />
63%<br />
2000 2005 2008 2011 2000 2005 2008 2011<br />
<strong>Children</strong> and youth (0–26 years old)<br />
<strong>with</strong> disabilities in institutions<br />
49%<br />
37%<br />
<strong>Children</strong> and youth (0–26 years old)<br />
<strong>with</strong>out disabilities in institutions<br />
Source: Republican Institute for Social Protection, Serbia.<br />
Sample sizes: <strong>Children</strong> and youth (0–26 years old) <strong>with</strong> disabilities: 2,020 in<br />
2000, 1,280 in 2011. <strong>Children</strong> and youth (0–26 years old) <strong>with</strong>out disabilities:<br />
1,534 in 2000, 574 in 2011.<br />
<strong>Children</strong> <strong>with</strong> disabilities should not be placed in<br />
regular juvenile detention facilities, neither when<br />
awaiting nor following a trial. Any decisions resulting<br />
in deprivation of liberty should be aimed at<br />
appropriate treatment to address the issues that led<br />
the child to commit a crime. Such treatment should<br />
be carried out in the context of appropriate facilities<br />
<strong>with</strong> adequately trained staff, <strong>with</strong> human rights<br />
and legal safeguards fully respected. 110<br />
A child learns the Dutch alphabet at a school for children<br />
<strong>with</strong> learning disabilities in Curaçao, Netherlands.<br />
© UNICEF/HQ2011-1955/LeMoyne<br />
ESSENTIALS OF PROTECTION<br />
43
44<br />
FOCUS<br />
Violence against children<br />
<strong>with</strong> disabilities<br />
By Lisa Jones, Mark A. Bellis, Sara<br />
Wood, Karen Hughes, Ellie McCoy,<br />
Lindsay Eckley, Geoff Bates<br />
Centre for Public Health, Liverpool<br />
John Moores University<br />
Christopher Mikton, Alana Officer,<br />
Tom Shakespeare<br />
Department of Violence and Injury<br />
Prevention and Disability, World<br />
Health Organization<br />
<strong>Children</strong> <strong>with</strong> disabilities are<br />
three to four times more likely<br />
to be victims of violence.<br />
<strong>Children</strong> and adults <strong>with</strong> disabilities<br />
often face a wide<br />
range of physical, social and<br />
environmental barriers to full<br />
participation in society, including<br />
reduced access to health<br />
care, education and other support<br />
services. They are also<br />
thought to be at significantly<br />
greater risk of violence than<br />
their peers <strong>with</strong>out disabilities.<br />
Understanding the extent of<br />
violence against children <strong>with</strong><br />
disabilities is an essential first<br />
step in developing effective programmes<br />
to prevent them from<br />
becoming victims of violence<br />
and to improve their health<br />
and the quality of their lives.<br />
To this end, research teams<br />
at Liverpool John Moores<br />
University and the World Health<br />
Organization conducted the first<br />
systematic review, including<br />
meta-analysis, of existing studies<br />
on violence against children<br />
<strong>with</strong> disabilities (aged 18 years<br />
and under).<br />
Seventeen studies, all from<br />
high-income countries, met<br />
the criteria for inclusion in the<br />
review. Prevalence estimates<br />
of violence against children<br />
<strong>with</strong> disabilities ranged from<br />
26.7 per cent for combined<br />
THE STATE OF THE WORLD’S CHILDREN 2013: <strong>Children</strong> <strong>with</strong> <strong>Disabilities</strong><br />
measures of violence to 20.4<br />
per cent for physical violence<br />
and 13.7 per cent for sexual<br />
violence. Estimates of risk<br />
indicated that children <strong>with</strong> disabilities<br />
were at a significantly<br />
greater risk of experiencing<br />
violence than peers <strong>with</strong>out<br />
disabilities: 3.7 times more<br />
likely for combined measures<br />
of violence, 3.6 times more<br />
likely for physical violence<br />
and 2.9 times more likely for<br />
sexual violence. The type of<br />
disability appeared to affect the<br />
prevalence and risk of violence,<br />
although the evidence on this<br />
point was not conclusive. For<br />
instance, children <strong>with</strong> mental<br />
or intellectual disabilities were<br />
4.6 times more likely to be<br />
victims of sexual violence than<br />
their non-disabled peers.<br />
This review demonstrated that<br />
violence is a major problem<br />
for children <strong>with</strong> disabilities. It<br />
also highlighted the absence of<br />
high-quality studies on the topic<br />
from low- and middle-income<br />
countries, which generally have<br />
higher population rates of disability,<br />
higher levels of violence<br />
and fewer support services for<br />
those living <strong>with</strong> a disability.<br />
This gap in the research urgently<br />
needs to be filled.<br />
A number of explanations have<br />
been put forward to account
<strong>Children</strong> <strong>with</strong> disabilities are at greater risk of experiencing physical<br />
or sexual violence than peers <strong>with</strong>out disabilities.<br />
for why children <strong>with</strong> disabilities<br />
are at much greater risk of<br />
violence than children <strong>with</strong>out<br />
disabilities. Having to care for<br />
a child <strong>with</strong> a disability can<br />
put extra strain on parents<br />
or households and increase<br />
the risk of abuse. Significant<br />
numbers of children <strong>with</strong> disabilities<br />
continue to be placed<br />
into residential care, which is<br />
a major risk factor for sexual<br />
and physical abuse. <strong>Children</strong><br />
<strong>with</strong> disabilities that affect<br />
communication may be particularly<br />
vulnerable to abuse, since<br />
communication barriers can<br />
hamper their ability to disclose<br />
abusive experiences.<br />
The Convention on the Rights<br />
of Persons <strong>with</strong> <strong>Disabilities</strong><br />
aims to protect the rights of<br />
individuals <strong>with</strong> disabilities<br />
and guarantee their full and<br />
equal participation in society.<br />
In the case of children <strong>with</strong> disabilities,<br />
this includes ensuring<br />
a safe and stable progression<br />
through childhood and into<br />
adulthood. As <strong>with</strong> all children,<br />
a safe and secure childhood<br />
provides the best chance of<br />
achieving a healthy, welladjusted<br />
adulthood. Adverse<br />
childhood experiences, including<br />
violence, are known to<br />
be related to a wide range of<br />
negative health and social outcomes<br />
in later life. The extra<br />
demands placed on children<br />
<strong>with</strong> disabilities – who must<br />
cope <strong>with</strong> their disabilities and<br />
overcome societal barriers that<br />
increase their risk of poorer<br />
outcomes in later life – mean<br />
that a safe and secure childhood<br />
is particularly important.<br />
<strong>Children</strong> placed away from<br />
home need increased care and<br />
protection, and institutional<br />
cultures, regimes and structures<br />
that exacerbate the risk<br />
of violence and abuse should<br />
be addressed as a matter of<br />
urgency. Whether they live<br />
in institutions or <strong>with</strong> their<br />
families or other caregivers,<br />
all children <strong>with</strong> disabilities<br />
should be viewed as a highrisk<br />
group in which it is critical<br />
to identify violence. They<br />
may benefit from interventions<br />
such as home visiting<br />
and parenting programmes,<br />
which have been demonstrated<br />
to be effective for preventing<br />
violence and mitigating its consequences<br />
in children <strong>with</strong>out<br />
disabilities. The effectiveness of<br />
such interventions for children<br />
<strong>with</strong> disabilities should be evaluated<br />
as a matter of priority.<br />
ESSENTIALS OF PROTECTION<br />
45
46<br />
PERSPECTIVE<br />
Segregation and abuse<br />
in institutions<br />
By Eric Rosenthal and Laurie Ahern<br />
Eric Rosenthal, JD, is founder and<br />
Executive Director of Disability Rights<br />
International (DRI). Laurie Ahern is its<br />
President. Through investigations of<br />
orphanages and other institutions in<br />
more than two dozen countries, DRI<br />
has brought international attention<br />
to the human rights of people <strong>with</strong><br />
disabilities.<br />
Throughout the world, millions<br />
of children <strong>with</strong> disabilities are<br />
separated from their families<br />
and placed in orphanages,<br />
boarding schools, psychiatric<br />
facilities and social care<br />
homes. <strong>Children</strong> who survive<br />
institutions face the prospect<br />
of lifetime segregation from<br />
society in facilities for adults.<br />
According to the Convention<br />
on the Rights of Persons <strong>with</strong><br />
<strong>Disabilities</strong> (CRPD), segregating<br />
children on the basis of their<br />
disability violates the rights of<br />
every such child. Article 19 of<br />
the Convention requires governments<br />
to establish the laws,<br />
social policies and community<br />
support services needed to prevent<br />
isolation or segregation<br />
from the community.<br />
Over the course of 20 years,<br />
Disability Rights International<br />
(DRI) has documented the<br />
conditions of children <strong>with</strong><br />
disabilities in institutions in 26<br />
countries around the world. Our<br />
findings are surprisingly consistent.<br />
We have interviewed<br />
heartbroken mothers and fathers<br />
who wish to keep their children<br />
at home but receive inadequate<br />
support from governments and<br />
cannot afford to stay home from<br />
work to take care of a child.<br />
Doctors often tell parents to<br />
place their daughter or son in an<br />
orphanage before they become<br />
too attached to the child.<br />
Raising children in congregate<br />
settings is inherently dangerous.<br />
Even in clean, well-managed and<br />
well-staffed institutions, children<br />
encounter greater risks to their<br />
life and health compared to<br />
those who grow up in families.<br />
<strong>Children</strong> who grow up in institutions<br />
are likely to acquire developmental<br />
disabilities, and the<br />
youngest among them also face<br />
potentially irreversible psychological<br />
damage.<br />
Even in institutions <strong>with</strong> adequate<br />
food, we often observe<br />
THE STATE OF THE WORLD’S CHILDREN 2013: <strong>Children</strong> <strong>with</strong> <strong>Disabilities</strong><br />
children who are emaciated<br />
because they simply stop eating<br />
– a condition called ‘failure to<br />
thrive’. Infants and children <strong>with</strong><br />
disabilities may starve or lack<br />
adequate nutrients because staff<br />
do not or cannot take the extra<br />
time to feed them. Sometimes<br />
staff will prop a bottle on the<br />
chest of a bedridden child, in<br />
theory allowing her to grasp it<br />
and drink – but in practice, the<br />
child may be unable to pick it up.<br />
Many children are left to languish.<br />
A DRI investigator came<br />
to the horrific realization, in<br />
2007, that a child who looked to<br />
be 7 or 8 years old was, according<br />
to a nurse, 21 years old and<br />
had never been out of his crib in<br />
11 years.<br />
Without any movement, physical<br />
disabilities worsen, and children<br />
can develop life-threatening<br />
medical complications. Some<br />
children’s arms and legs atrophy<br />
and have to be amputated.<br />
Without emotional attention<br />
and support, many children<br />
become self-abusive, rocking<br />
back and forth, banging their<br />
heads against walls, biting themselves<br />
or poking their own eyes.<br />
Most facilities lack trained staff<br />
who can help children stop such<br />
behaviour. Instead, children are<br />
sometimes tied permanently to
It is much harder to protect children and provide them <strong>with</strong> an<br />
opportunity for a life in society when their ties to family have<br />
already been broken.<br />
beds or held in cages – whether<br />
to prevent self-abuse or to help<br />
overwhelmed staff cope <strong>with</strong><br />
the demands of the many children<br />
in their care. The United<br />
Nations Committee against<br />
Torture and the United Nations<br />
Special Rapporteur on Torture<br />
have said that the prolonged<br />
use of restraints may constitute<br />
torture.<br />
For a child who has already<br />
been institutionalized, falling ill<br />
can be a death sentence. Staff<br />
members at facilities in more<br />
than one country have said<br />
that children <strong>with</strong> disabilities<br />
are routinely denied medical<br />
treatment. Institution staff have<br />
also told us – incorrectly – that<br />
children <strong>with</strong> developmental<br />
disabilities lack the ability to<br />
feel pain. So, in some cases,<br />
medical procedures are conducted<br />
<strong>with</strong>out anaesthesia.<br />
In one facility, children’s teeth<br />
were extracted <strong>with</strong> pliers;<br />
elsewhere, children received<br />
electro-convulsive therapy<br />
<strong>with</strong> no anaesthesia or<br />
muscle relaxants.<br />
<strong>Children</strong> have been given electric<br />
shocks, physically restrained<br />
for long periods and isolated<br />
<strong>with</strong> the express purpose of<br />
causing pain, on the theory that<br />
this ‘aversive therapy’ would<br />
extinguish behaviour deemed<br />
inappropriate. A teacher in the<br />
United States described one girl<br />
– blind, deaf and non-verbal –<br />
who was shocked for moaning.<br />
It turned out she had a broken<br />
tooth.<br />
Without oversight and human<br />
rights protections, children have,<br />
in effect, disappeared in institutions.<br />
Human rights monitoring<br />
and enforcement programmes to<br />
protect against violence, exploitation<br />
and abuse – as required by<br />
Article 16 of CRPD – are absent in<br />
most of the facilities we have visited.<br />
In some cases, authorities<br />
do not keep track of the names<br />
or numbers of children detained<br />
in these places.<br />
Official statistics are unreliable<br />
and often understate reliance<br />
upon segregated service systems.<br />
The numbers are often<br />
limited to orphanages and do<br />
not include children detained in<br />
other types of institutions, such<br />
as boarding schools, health-care<br />
or psychiatric facilities, criminal<br />
justice systems or homeless<br />
shelters. Private or religious<br />
institutions, which may be much<br />
larger than government orphanages,<br />
are often not counted.<br />
The entrances to some orphanages<br />
and other institutions are<br />
emblazoned <strong>with</strong> the logos of<br />
governments, corporate donors,<br />
churches or private charities.<br />
Even when financial assistance<br />
from international donors or<br />
technical assistance agencies<br />
makes up a small portion of an<br />
institution’s operating budget,<br />
this support can provide an<br />
apparent ‘seal of approval’. DRI<br />
has found bilateral and multilateral<br />
support – both official<br />
and from voluntary donations<br />
by staff – for such amenities<br />
as playgrounds at orphanages<br />
where children die for want of<br />
medical care and where they<br />
are tied to beds. These donors<br />
may be well intentioned but<br />
this support runs counter to the<br />
intent of the CRPD and other<br />
rights instruments that protect<br />
people from segregation.<br />
No child should ever be taken<br />
away from her or his family on<br />
the basis of disability. DRI is<br />
calling on every government<br />
and international donor agency<br />
to commit to preventing any<br />
new placements in orphanages.<br />
It is much harder to protect children<br />
and provide them <strong>with</strong> an<br />
opportunity for a life in society<br />
when their ties to family have<br />
already been broken. The detention<br />
of children in institutions<br />
is a fundamental human rights<br />
violation. We can bring it to<br />
an end, on a worldwide scale,<br />
through a moratorium on new<br />
placements.<br />
ESSENTIALS OF PROTECTION<br />
47
Fadi, 12, walks past houses destroyed by airstrikes in Rafah, State of Palestine, where ongoing violence has<br />
had substantial psychological impact, especially on children. © UNICEF/HQ2012-1583/El Baba
Armed conflict and war affect children in direct<br />
and indirect ways: directly in the form of physical<br />
injuries from attack, artillery fire and landmine<br />
explosions or in the form of psychological<br />
conditions derived from these injuries or from<br />
witnessing traumatic events; indirectly through,<br />
for example, the breakdown of health services,<br />
which leaves many illnesses untreated, and<br />
food insecurity, which leads to malnutrition. 111<br />
<strong>Children</strong> are also separated from their families,<br />
their homes or their schools, sometimes<br />
for years.<br />
The nature of armed conflict, a major cause<br />
of disabilities among children, is changing.<br />
Fighting is increasingly taking the form of recurring<br />
civil wars and fragmented violence characterized<br />
by the indiscriminate use of force and<br />
weapons. At the same time, natural disasters<br />
are expected to affect increasing numbers of<br />
children and adults in coming years, especially<br />
in hazardous regions such as low-lying coastal<br />
zones, particularly as climate change-related<br />
disasters grow in frequency and severity. 112<br />
<strong>Children</strong> <strong>with</strong> disabilities face particular challenges<br />
in emergencies. They may be unable to<br />
escape during a crisis because of inaccessible<br />
evacuation routes; for example, a child in a<br />
wheelchair may be unable to flee a tsunami or<br />
gunfire and may be abandoned by her or his<br />
family. They may be dependent on assistive<br />
CHAPTER 5<br />
HUMANITARIAN<br />
RESPONSE<br />
Humanitarian crises, such as those stemming from<br />
warfare or natural disasters, pose particular risks for<br />
children <strong>with</strong> disabilities. Inclusive humanitarian response<br />
is urgently needed – and feasible.<br />
devices or caregivers, and in the face of the loss<br />
of a caregiver, may be extremely vulnerable to<br />
physical violence or to sexual, emotional and<br />
verbal abuse. <strong>Children</strong> <strong>with</strong> disabilities may<br />
also be made invisible by family and community<br />
beliefs – for example, a child <strong>with</strong> a mental<br />
impairment might be kept in the house because<br />
of stigma surrounding her or his condition.<br />
In addition, children <strong>with</strong> disabilities may be<br />
excluded from or unable to access mainstream<br />
support services and assistance programmes<br />
such as health services or food distribution<br />
because of the physical barriers posed by inaccessible<br />
buildings or because of negative attitudes.<br />
Or they may be forgotten in the establishment<br />
of targeted services. For example, landmine<br />
survivors may not be able to access physical<br />
rehabilitation services because of distance, the<br />
high cost of transport or criteria for admission to<br />
treatment programmes. Furthermore, children<br />
<strong>with</strong> disabilities may be disregarded in early<br />
warning systems, which often do not take into<br />
account the communication and mobility requirements<br />
of those <strong>with</strong> disabilities.<br />
Disability-inclusive humanitarian action is<br />
informed by and grounded in:<br />
• A rights-based approach, based on the<br />
Convention on the Rights of the Child (CRC)<br />
and the Convention on the Rights of Persons<br />
<strong>with</strong> <strong>Disabilities</strong> (CRPD). Article 11 of the CRPD<br />
HUMANITARIAN RESPONSE<br />
49
50<br />
specifically calls on duty bearers to take all necessary<br />
measures to ensure the protection and<br />
safety of persons <strong>with</strong> disabilities in situations<br />
of conflict, emergency and disaster, signifying<br />
the importance of the issue.<br />
• An inclusive approach that recognizes that<br />
children <strong>with</strong> disabilities, in addition to their<br />
disability-specific needs, have the same needs<br />
as other children, disability being only one<br />
aspect of their situation: They are children who<br />
happen to have disabilities. Such an inclusive<br />
approach also addresses the social, attitudinal,<br />
informational and physical barriers that impede<br />
participation and decision-making by children<br />
<strong>with</strong> disabilities in regular programmes.<br />
• Ensuring accessibility and universal design of<br />
infrastructure and information. This includes<br />
making the physical environment, all facilities,<br />
health centres, shelters and schools, and<br />
THE STATE OF THE WORLD’S CHILDREN 2013: <strong>Children</strong> <strong>with</strong> <strong>Disabilities</strong><br />
the organization of health and other services,<br />
including communication and information systems,<br />
accessible for children <strong>with</strong> disabilities.<br />
• Promoting independent living so that children<br />
<strong>with</strong> disabilities can live as independently as<br />
possible and participate as fully as possible<br />
in all aspects of life.<br />
• Integrating age, gender and diversity awareness,<br />
including paying special attention to<br />
the double or triple discrimination faced by<br />
women and girls <strong>with</strong> disabilities.<br />
Disability-inclusive humanitarian response<br />
ensures that children and adults <strong>with</strong> disabilities,<br />
as well as their families, survive and live<br />
<strong>with</strong> dignity, even as it benefits the population<br />
as a whole. This approach calls for holistic and<br />
inclusive programmes, rather than just isolated<br />
projects and policies targeting disabilities. Key<br />
Vijay, 12, survived a landmine explosion and has gone on to become a mine risk educator in Sri Lanka.<br />
© UNICEF/Sri Lanka/2012/Tuladar
Explosive remnants of war (ERW) on display at a school in Ajdabiya, Libya. Students collected the objects from around<br />
the city. © UNICEF/HQ2011-1435/Diffidenti<br />
intervention areas for disability-inclusive humanitarian<br />
action include:<br />
• Improving data and assessments in order to<br />
have an evidence base for the distinct needs<br />
and priorities of children <strong>with</strong> disabilities.<br />
• Making mainstream humanitarian services<br />
accessible for children <strong>with</strong> disabilities and<br />
involving them in planning and design.<br />
• Designing specialized services for children <strong>with</strong><br />
disabilities and ensuring that recovery and reintegration<br />
proceed in environments that foster<br />
well-being, health, self-respect and dignity.<br />
• Putting measures in place to prevent injuries<br />
and abuse and promote accessibility.<br />
• Partnering <strong>with</strong> community, regional and<br />
national actors, including disabled persons’<br />
organizations, to challenge discriminatory<br />
attitudes and perceptions and promote equity.<br />
• Promoting participation of children <strong>with</strong><br />
disabilities by consulting them and creating<br />
opportunities for their voices to be heard.<br />
Parties to conflict have an obligation to protect<br />
children from the effects of armed violence<br />
and to provide them <strong>with</strong> access to appropriate<br />
health and psychosocial care to aid their recovery<br />
and reintegration. The Committee on the Rights<br />
of the Child has recommended that States parties<br />
to the CRC add explicit reference to children<br />
<strong>with</strong> disabilities as part of their broader commitment<br />
not to recruit children into armed forces. 113<br />
Governments should also take care to address<br />
the recovery and social reintegration of children<br />
who acquire disabilities as a result of armed<br />
conflict. This is explored in greater detail in the<br />
following Focus article.<br />
HUMANITARIAN RESPONSE<br />
51
52<br />
FOCUS<br />
Risk, resilience and inclusive<br />
humanitarian action<br />
By Maria Kett<br />
Assistant Director, Department of<br />
Epidemiology and Public Health,<br />
Leonard Cheshire Disability and<br />
Inclusive Development Centre,<br />
University College London<br />
Article 11 of the Convention<br />
on the Rights of Persons <strong>with</strong><br />
<strong>Disabilities</strong> compels States<br />
parties to “ensure the protection<br />
and safety of persons <strong>with</strong><br />
disabilities in situations of risk,<br />
including situations of armed<br />
conflict, humanitarian emergencies<br />
and the occurrence<br />
of natural disasters.”<br />
In an emergency – whether<br />
armed conflict or a natural or<br />
human-made disaster – children<br />
are among those most<br />
vulnerable to the loss of food,<br />
shelter, health care, education<br />
and age-appropriate psychosocial<br />
support services. This<br />
vulnerability can be even more<br />
acute for children <strong>with</strong> disabilities:<br />
Even where basic supplies<br />
and relief services are available,<br />
they may not be inclusive<br />
or accessible.<br />
Knowing how many children<br />
<strong>with</strong> disabilities live in an area<br />
affected by an emergency is<br />
extremely challenging, because<br />
accurate numbers may not<br />
have existed even before the<br />
emergency. Parents or communities<br />
may hide such children<br />
because of stigma, for example.<br />
The resulting exclusion is of particular<br />
concern because even the<br />
most rudimentary reporting systems<br />
can unravel in humanitarian<br />
situations, since registration<br />
and reporting points or centres<br />
may not be accessible.<br />
At the same time, increasing<br />
numbers of children may sustain<br />
disabling injuries as a result of<br />
chronic or sudden emergencies.<br />
In an earthquake, children may<br />
be disabled by falling objects or<br />
when buildings collapse. They<br />
may receive crushing injuries<br />
and undergo psychological<br />
trauma during floods and landslides.<br />
Conflict increases the likelihood<br />
that children will become<br />
disabled as a result of fighting,<br />
because of landmines, or<br />
through exposure to other explosive<br />
remnants of war (ERW).<br />
Because children are smaller and<br />
at earlier stages in their development,<br />
they often sustain more<br />
seriously disabling injuries than<br />
adults and require continuing<br />
physiotherapy, prostheses and<br />
psychological support.<br />
The challenges facing children<br />
<strong>with</strong> disabilities and their families<br />
are rarely acknowledged<br />
when the impact of an emergency<br />
is assessed. These challenges<br />
include new environmental barriers<br />
such as collapsed ramps;<br />
THE STATE OF THE WORLD’S CHILDREN 2013: <strong>Children</strong> <strong>with</strong> <strong>Disabilities</strong><br />
damaged or lost assistive<br />
devices; and the loss of previously<br />
established services (sign<br />
language interpreters or visiting<br />
nurses) or support systems<br />
(social security payments or<br />
social protection schemes).<br />
There are other risks. If family<br />
members die, there may be<br />
no one left who knows how to<br />
care for a child <strong>with</strong> a physical<br />
disability or who can communicate<br />
<strong>with</strong> a child <strong>with</strong> a<br />
sensory impairment. If families<br />
are forced to flee, especially if<br />
they face a long journey by foot,<br />
they may leave behind children<br />
who are unable to walk or are<br />
in frail health. Families may<br />
also leave behind children <strong>with</strong><br />
disabilities because they fear<br />
they will be refused asylum in<br />
another country if one of their<br />
family members has a disability.<br />
Several countries practise such<br />
discrimination. Institutions and<br />
residential schools may close or<br />
be abandoned by staff, leaving<br />
few people – or no one – to help<br />
the children in their charge.<br />
<strong>Children</strong> <strong>with</strong> disabilities, especially<br />
those <strong>with</strong> learning disabilities,<br />
can also be directly<br />
involved in conflict. They may<br />
be pressed into service as fighters,<br />
cooks or porters precisely<br />
because they are considered to<br />
be less valuable, or less likely to
esist, than children <strong>with</strong>out disabilities.<br />
In theory disarmament,<br />
demobilization and reintegration<br />
programmes include all child<br />
ex-combatants, but resources<br />
or programmes for children<br />
<strong>with</strong> disabilities are often nonexistent.<br />
These children therefore<br />
remain marginalized and<br />
excluded, leaving them poor,<br />
vulnerable and often having to<br />
beg, as has been the case in<br />
Liberia and Sierra Leone.<br />
The risk of violence, including<br />
sexual violence, increases when<br />
family protection and social<br />
structures break down as they<br />
do during conflict and disasters.<br />
While girls <strong>with</strong> disabilities are<br />
at particular risk in such situations,<br />
boys <strong>with</strong> disabilities<br />
are also at risk and are even<br />
less likely to be helped in the<br />
aftermath of violence.<br />
Recovery and reconstruction<br />
come <strong>with</strong> their own challenges<br />
for children <strong>with</strong> disabilities. As<br />
is the case <strong>with</strong> all crisis-affected<br />
children, those <strong>with</strong> disabilities<br />
require a range of services,<br />
including but not limited to targeted<br />
ones. Disability-specific<br />
needs are extremely important,<br />
but they are only part of the picture.<br />
During recovery operations<br />
after the 2004 Indian Ocean tsunami,<br />
for example, one girl <strong>with</strong><br />
a disability was given five wheelchairs<br />
– but no one asked her if<br />
she needed food or clothes.<br />
Resilience and inclusion<br />
<strong>Children</strong> have repeatedly<br />
demonstrated their resilience.<br />
Measures can be taken to<br />
support their participation and<br />
inclusion. These measures<br />
should be specific to particular<br />
groups and contexts: Boys and<br />
girls have different experiences<br />
of conflict, as do young children<br />
and adolescents. Similarly,<br />
emergencies can affect urban<br />
and rural areas differently.<br />
As a starting point, children <strong>with</strong><br />
disabilities should be given the<br />
opportunity to take part in the<br />
planning and implementation of<br />
disaster risk reduction and peacebuilding<br />
strategies as well as in<br />
recovery processes. Ignorance<br />
and incorrect assumptions that<br />
they are unable to contribute<br />
have often barred them from<br />
doing so, but this has begun to<br />
change. In Bangladesh, for example,<br />
Plan International learned<br />
to challenge such misconceptions<br />
through partnerships <strong>with</strong><br />
disability organizations and by<br />
working directly <strong>with</strong> communities<br />
in undertaking child-centred<br />
disaster risk reduction.<br />
Similarly, provision for children<br />
<strong>with</strong> disabilities is increasing in<br />
disaster response. In Pakistan,<br />
Handicap International (HI) and<br />
Save the <strong>Children</strong> built childfriendly<br />
inclusive spaces and<br />
developed sector-wide guidance<br />
on inclusion of persons <strong>with</strong> disabilities,<br />
especially in protection<br />
projects. In Haiti, HI and the faithbased<br />
development organization<br />
CBM lobbied the government to<br />
increase the inclusion of persons<br />
<strong>with</strong> disabilities in food distribution<br />
and other efforts. The United<br />
Nations often uses emergencies<br />
as an opportunity to ‘build back<br />
better’, an approach that can<br />
yield opportunities for children<br />
<strong>with</strong> disabilities because it<br />
offers all stakeholders a<br />
chance to work together.<br />
Disability is also being mainstreamed<br />
in such guidelines<br />
as the Sphere Project’s<br />
Humanitarian Charter and<br />
Minimum Standards in<br />
Humanitarian Response,<br />
framed by a group of international<br />
organizations to improve<br />
the quality and accountability<br />
of humanitarian response.<br />
The availability of emergency<br />
guidelines on how to include<br />
people <strong>with</strong> disabilities – and<br />
children in particular – is<br />
increasing. These gains need to<br />
be consolidated and extended<br />
to such areas as child nutrition<br />
and protection.<br />
Also needed is a unified<br />
approach to data collection.<br />
Collaboration <strong>with</strong> local and<br />
national disabled people’s<br />
organizations should be<br />
emphasized, and these groups’<br />
capacity to address issues<br />
specific to children should be<br />
built up where necessary. And<br />
the extent to which children<br />
<strong>with</strong> disabilities are included in<br />
humanitarian response must<br />
be audited to monitor and<br />
improve results.<br />
Clear standards and inclusion<br />
checklists that can be applied<br />
across the range of emergencies<br />
will be essential – but to<br />
be put into practice, they must<br />
be accompanied by resource<br />
allocations.<br />
HUMANITARIAN RESPONSE<br />
53
54<br />
FOCUS<br />
Explosive remnants of war<br />
By the Victim Assistance Editorial<br />
Team at the Landmine and Cluster<br />
Munition Monitor.<br />
The Landmine and Cluster Munition<br />
Monitor provides research for the<br />
International Campaign to Ban<br />
Landmines and the Cluster Munition<br />
Coalition. It is the de facto monitoring<br />
regime for the Mine Ban Treaty<br />
and the Convention on Cluster<br />
Munitions.<br />
Explosive remnants of war<br />
(ERW) and anti-personnel<br />
landmines have a devastating<br />
impact on children and represent<br />
a significant contributing<br />
factor to child disability. Since<br />
the signing of the 1997 Mine<br />
Ban Treaty, however, vast tracts<br />
of land have been cleared of<br />
these munitions and returned<br />
to productive use.<br />
The 1997 treaty; the 1996<br />
Amended Protocol II and<br />
2003 Protocol V to the 1980<br />
Convention on Certain<br />
Conventional Weapons; and<br />
the 2008 Convention on Cluster<br />
Munitions have all had a positive<br />
impact in terms of protecting<br />
the lives of people living<br />
in areas contaminated by ERW<br />
and landmines. The global<br />
movement to ban landmines<br />
and cluster munitions is a testament<br />
to the importance of<br />
strong political will among<br />
key stakeholders in fostering<br />
global change.<br />
Mine action programming,<br />
which seeks to address the<br />
impact of landmines and ERW,<br />
is understood to be made up<br />
of five pillars – clearance, ERW/<br />
mine risk education, victim<br />
assistance, stockpile destruction<br />
and advocacy. Despite the<br />
great successes in many of<br />
these pillars, as indicated by<br />
a significant global decline in<br />
ERW and landmine casualties,<br />
victim assistance continues<br />
to stand out as a key area of<br />
weakness. This is especially so<br />
in the case of children affected<br />
by ERW or landmines.<br />
In contrast <strong>with</strong> the other four<br />
pillars of mine action, victim<br />
assistance requires a crosscutting<br />
response that includes<br />
medical and paramedical interventions<br />
to ensure physical<br />
rehabilitation, as well as social<br />
and economic interventions to<br />
promote reintegration and the<br />
livelihood of victims.<br />
To date the bulk of mine<br />
action assistance and funding<br />
has been dedicated to clearance<br />
activities. In 2010, 85 per<br />
cent of global funds related<br />
to mine action were allocated<br />
to clearance, while only 9 per<br />
cent were allocated to victim<br />
assistance interventions. While<br />
the International Mine Action<br />
Standards – the standards in<br />
THE STATE OF THE WORLD’S CHILDREN 2013: <strong>Children</strong> <strong>with</strong> <strong>Disabilities</strong><br />
force for all UN mine action<br />
operations – address the mine<br />
action programming pillars of<br />
clearance, ERW/mine risk education<br />
and stockpile destruction,<br />
they do not tackle the issue of<br />
victim assistance. Moreover, the<br />
right to age- and gender-appropriate<br />
physical rehabilitation<br />
and social and economic reintegration<br />
for survivors of landmines<br />
and ERW is enshrined in<br />
international human rights and<br />
humanitarian law. However,<br />
few survivor assistance programmes<br />
have taken into consideration<br />
the specific needs<br />
of children, whether they are<br />
direct survivors or victims in the<br />
broader sense.<br />
The impact on children<br />
There has been a significant<br />
decrease in the numbers of<br />
people killed or injured by<br />
landmine blasts. Between 2001<br />
and 2010, the number of new<br />
landmine and ERW casualties<br />
reported through the Landmine<br />
and Cluster Munitions Monitor,<br />
the monitoring arm of the Mine<br />
Ban Treaty and the Convention<br />
on Cluster Munitions, fell from<br />
7,987 to 4,191. The chart on<br />
the next page demonstrates<br />
a significant reduction in the<br />
total number of civilian deaths<br />
and injuries from landmines<br />
and ERW in the five-year period<br />
between 2005 and 2010.
Since monitoring began in 1999, there have been at least 1,000<br />
child casualties every year. Many casualties go unrecorded, so the<br />
real number is likely much higher.<br />
Nevertheless, the percentage<br />
of total casualties represented<br />
by child casualties<br />
has increased. Annually, since<br />
2005, children have accounted<br />
for approximately 20–30 per<br />
cent of all casualties from<br />
landmines, remnants of cluster<br />
munitions and other ERW.<br />
Since monitoring began in<br />
1999, there have been at least<br />
1,000 child casualties every<br />
year. The number of child<br />
casualties of landmines and<br />
ERW in 2010 surpassed 1,200,<br />
and children accounted for 55<br />
per cent of all civilian deaths<br />
– children are now the civilian<br />
group for whom landmines<br />
and ERW are most deadly.<br />
Given that numerous casualties<br />
go unrecorded in many<br />
countries, the total number<br />
of child casualties annually<br />
is likely much higher, and<br />
in some of the world’s most<br />
mine-affected countries, the<br />
percentage of casualties represented<br />
by children is higher<br />
still: In 2011, children constituted<br />
61 per cent of all civilian<br />
casualties in Afghanistan. In<br />
the same year, they were 58<br />
per cent of civilian casualties<br />
in the Lao People’s Democratic<br />
Republic, 50 per cent in Iraq<br />
and 48 per cent in the Sudan.<br />
If children now constitute the<br />
majority of casualties caused<br />
by landmines, remnants of<br />
cluster munitions and other<br />
ERW, since 2008, boys have<br />
made up the single largest<br />
casualty group, approximately<br />
50 per cent of all civilian casualties.<br />
In 2006, the first year in<br />
which the Landmine Monitor<br />
began disaggregating casualty<br />
data by both age and gender,<br />
boys represented 83 per cent<br />
of child casualties and made<br />
up the largest single casualty<br />
group among civilians in 17<br />
countries. In 2008, boys represented<br />
73 per cent of child<br />
casualties, and were the largest<br />
casualty group in 10 countries.<br />
In many contaminated countries,<br />
boys are more likely than<br />
girls to come across mines or<br />
ERW, because they are more<br />
involved in outdoor activities<br />
such as herding livestock, gathering<br />
wood and food, or collecting<br />
scrap metal. <strong>Children</strong> in<br />
general are more likely to deliberately<br />
handle explosive devices<br />
than adults, often unknowingly,<br />
out of curiosity or by mistaking<br />
them for toys. Boys are<br />
more likely than girls to tamper<br />
<strong>with</strong> the explosive devices they<br />
come across. These factors,<br />
Monica and Luis, both 14 in this 2004 photograph from Colombia, sit at poolside.<br />
Monica lost a foot when a younger cousin brought home a grenade. It exploded,<br />
killing the cousin. © UNICEF/HQ2004-0793/DeCesare<br />
HUMANITARIAN RESPONSE<br />
55
56<br />
FOCUS<br />
(continued)<br />
as well as a tendency towards<br />
engaging in risk-taking behaviour,<br />
make well-planned risk<br />
education especially important<br />
for children.<br />
Assistance for child<br />
survivors<br />
ERW and landmine incidents<br />
affect children differently than<br />
they do adults, whether they<br />
are directly killed or injured,<br />
or become victims as a result<br />
of the death or injury of family<br />
and community members.<br />
Child survivors who are injured<br />
have specific needs that must<br />
be taken into consideration, in<br />
terms of both physical rescue<br />
and rehabilitation and social<br />
and economic reintegration.<br />
Smaller than adults, children<br />
are more likely to die or suffer<br />
serious injuries from a blast,<br />
including severe burns, shrapnel<br />
wounds, damaged limbs<br />
and other injuries that can<br />
lead to blindness or deafness.<br />
Child casualties in countries heavily<br />
affected by mines and explosive<br />
remnants of war, 2011*<br />
Country Total civilian<br />
casualties<br />
Their height means that their<br />
vital organs are closer to the<br />
detonation, and children have<br />
a lower threshold for substantial<br />
blood loss than adults. If<br />
an anti-personnel landmine is<br />
stepped on, its blast will invariably<br />
cause foot and leg injuries,<br />
<strong>with</strong> secondary infections that<br />
usually result in amputation,<br />
causing lifelong disabilities and<br />
requiring long-term rehabilitation<br />
support.<br />
More than one third of all<br />
survivors require amputation,<br />
and while data concerning the<br />
exact percentage of affected<br />
children requiring amputation<br />
are lacking, the percentage can<br />
be expected to be higher for<br />
children, given their smaller<br />
size. When children survive<br />
their injuries, their physical<br />
rehabilitation is more complex<br />
than that of adult survivors.<br />
<strong>Children</strong> whose injuries result<br />
in amputated limbs require<br />
Child<br />
casualties<br />
Child casualties<br />
as percentage<br />
of total<br />
casualties<br />
Afghanistan 609 373 61%<br />
Democratic Republic of the Congo 22 15 68%<br />
Iraq 100 50 50%<br />
Lao People’s Democratic Republic 97 56 58%<br />
Sudan 62 30 48%<br />
* Includes only casualties for which the civilian/security status and the age was known.<br />
Source: Landmine and Cluster Munition Monitor.<br />
THE STATE OF THE WORLD’S CHILDREN 2013: <strong>Children</strong> <strong>with</strong> <strong>Disabilities</strong><br />
more complicated rehabilitation<br />
and, because their bones grow<br />
more quickly than their soft<br />
tissue, several re-amputations<br />
may be required. They also<br />
need to have prostheses made<br />
as they grow. Few countries<br />
affected by landmines and<br />
ERW have the capacity necessary<br />
to address the specific,<br />
complex medical and physical<br />
rehabilitation needs of child<br />
survivors.<br />
In addition to the physical<br />
trauma, the psychological<br />
consequences of surviving<br />
an ERW or landmine blast<br />
are often devastating for the<br />
development of the child. They<br />
include a sense of guilt, loss<br />
of self-esteem, phobias and<br />
fear, sleep disorders, inability<br />
to speak and trauma that if left<br />
untreated can result in longterm<br />
mental disorder. Such<br />
psychological effects of war on<br />
children are difficult to document,<br />
and they are not limited<br />
to children who have sustained<br />
physical injuries.<br />
The social and economic<br />
reintegration needs of child<br />
survivors also vary considerably<br />
from the needs of adults.<br />
Addressing the psychosocial<br />
impacts outlined above relies<br />
heavily on age-appropriate<br />
psychosocial support and<br />
access to education. In many<br />
countries, child survivors are<br />
forced to cut short their education<br />
because of the time needed<br />
for recovery, and because
Child casualties in the most affected countries*<br />
Percentage of children among civilian casualties (1999–2011)<br />
100%<br />
90%<br />
80%<br />
70%<br />
60%<br />
50%<br />
40%<br />
30%<br />
20%<br />
10%<br />
Afghanistan<br />
Cambodia<br />
Colombia<br />
0%<br />
1999 2000 2001 2002 2003 2004 2005 2006 2007 2008 2009 2010 2011<br />
* The three States parties to the Mine Ban Treaty <strong>with</strong> the highest annual casualty rates.<br />
Source: Landmine and Cluster Munition Monitor.<br />
rehabilitation represents a<br />
financial burden for families.<br />
Access to free education for<br />
children <strong>with</strong> disabilities as a<br />
result of a landmine or ERW<br />
injury is necessary both to<br />
promote a sense of normalcy<br />
in their lives, enabling them to<br />
recover from the psychosocial<br />
distress of their injury, and to<br />
reintegrate them <strong>with</strong> their<br />
peer group and allow them to<br />
fully participate in society. Yet<br />
children left <strong>with</strong> a disability<br />
following a landmine or ERW<br />
blast are more vulnerable than<br />
others to the denial of this<br />
right: They may no longer be<br />
able to walk to school, and<br />
other transportation alternatives<br />
are seldom in place. Even<br />
when they are able to get to<br />
school, classrooms may not be<br />
accessible for children <strong>with</strong> disabilities,<br />
and their teachers may<br />
not be trained<br />
in adapting to the needs of<br />
children <strong>with</strong> disabilities.<br />
Opportunities for income<br />
generation and livelihood<br />
support are especially necessary<br />
to support children and<br />
adolescents left <strong>with</strong> a disability<br />
as a result of landmines<br />
or ERW. Unfortunately, such<br />
FOCUS<br />
(continued)<br />
opportunities seldom if ever<br />
take age considerations into<br />
account. Where age has been<br />
considered, as it was during a<br />
2008–2010 project in Cambodia,<br />
the challenges to ensuring ageappropriate<br />
interventions for<br />
children and adolescents were<br />
such as to exclude those under<br />
18 from victim assistance livelihood<br />
interventions altogether.<br />
This failure to address the<br />
specific needs of and risks to<br />
children and adolescents is<br />
reflected in the livelihood and<br />
economic strengthening sector<br />
more generally: A 2011 review<br />
HUMANITARIAN RESPONSE<br />
57
58<br />
FOCUS<br />
(continued)<br />
of 43 studies on the impact of<br />
economic strengthening programmes<br />
in crisis contexts in<br />
low-income countries found<br />
that some of these efforts had,<br />
paradoxically, increased the risk<br />
that children would be pulled<br />
out of school and put to work<br />
or that girls would be subject<br />
to violence. The programmes<br />
studied featured such initiatives<br />
as microcredit, skills training,<br />
and agricultural interventions.<br />
The review called on economic<br />
strengthening practitioners to<br />
“build children’s protection<br />
and well-being into the assessment,<br />
design, implementation,<br />
monitoring and evaluation of<br />
economic strengthening programs.”<br />
In addition, livelihood<br />
and income generation opportunities<br />
for children and adolescents<br />
must take into account<br />
not only their age but also their<br />
sex and the cultural context<br />
in which they live. Because<br />
children <strong>with</strong> disabilities are<br />
among those most vulnerable<br />
to deprivation, violence, abuse<br />
and exploitation, there is an<br />
urgent need to ensure that<br />
victim assistance programmes<br />
take the specific needs of child<br />
survivors into consideration.<br />
Meanwhile, children who are<br />
victims of landmines and other<br />
ERW as a result of the death or<br />
injury of caregivers and family<br />
members, including family<br />
breadwinners, also have needs<br />
that differ from those of adults.<br />
Like child survivors, they too<br />
may be more vulnerable to the<br />
loss of education opportunities,<br />
separation from their families,<br />
child labour and other forms of<br />
exploitation or neglect.<br />
Despite the particular victim<br />
assistance needs of children,<br />
few victim assistance<br />
programmes take age- and<br />
gender-specific considerations<br />
into account. While research<br />
has been conducted on victim<br />
assistance in general, and guidance<br />
has been developed on<br />
what such programmes should<br />
look like, to date there has been<br />
little if any focus on children<br />
and adolescents. Meanwhile,<br />
while States parties to the Mine<br />
Ban Treaty, Protocols II and V<br />
of the Convention on Certain<br />
Conventional Weapons, and<br />
the Convention on Cluster<br />
Munitions must regularly report<br />
on national-level implementation<br />
of these international<br />
instruments, they do not report<br />
on their efforts to address the<br />
specific needs of survivors<br />
according to their age. It is not<br />
surprising then that in a 2009<br />
survey of more than 1,600 survivors<br />
from 25 affected countries<br />
conducted by Handicap<br />
International, almost two thirds<br />
of respondents reported that<br />
services for children were<br />
“never” or “almost never”<br />
adapted to address their specific<br />
needs or ensure that services<br />
were age appropriate.<br />
Child victims, including those<br />
directly and indirectly affected,<br />
have specific and additional<br />
THE STATE OF THE WORLD’S CHILDREN 2013: <strong>Children</strong> <strong>with</strong> <strong>Disabilities</strong><br />
needs in all aspects of assistance.<br />
However, the information<br />
available about efforts to<br />
address these needs is limited.<br />
Most children involved in mine<br />
or ERW incidents are injured.<br />
Yet most data collection systems<br />
do not record their needs.<br />
As children account for an<br />
increasing percentage of the<br />
total civilian casualties from<br />
ERW and landmines, it is<br />
essential to implement specific<br />
policy and programmatic recommendations<br />
on victim assistance<br />
that meets the needs of<br />
child survivors. These recommendations<br />
include:<br />
• Supporting and promoting<br />
the establishment of<br />
national injury surveillance<br />
systems able to provide<br />
systematic and continuous<br />
information on the magnitude<br />
and nature of ERW and<br />
landmine injuries (and other<br />
types of injuries if appropriate),<br />
including age- and<br />
gender-disaggregated data<br />
about child casualties.<br />
• Integrating a victim assistance<br />
component into the<br />
International Mine Action<br />
Standards, including through<br />
technical notes and bestpractices<br />
guidelines, <strong>with</strong><br />
specific guidance and considerations<br />
on child-specific survivor<br />
and victim assistance.<br />
• Developing and promoting<br />
the establishment of victim<br />
assistance databases able<br />
to provide systematic data
Child casualties by type of explosive*<br />
Undefined mine<br />
5%<br />
Anti-personnel mine<br />
21%<br />
Anti-vehicle mine<br />
4%<br />
Victim-activated improvised<br />
explosive device<br />
3%<br />
*Not including unknown explosive item types.<br />
Source: Landmine and Cluster Munition Monitor.<br />
to monitor the rehabilitation,<br />
psychosocial and socioeconomic<br />
needs of each child<br />
and adult survivor appropriately<br />
and across time.<br />
• Sensitizing governments,<br />
mine action actors, donors<br />
and other relevant stakeholders,<br />
through both international<br />
and national forums, on<br />
the importance of prioritizing<br />
victim assistance (including<br />
for child survivors and the<br />
children of people killed by<br />
victim-activated explosives)<br />
as a key pillar of mine action<br />
and international laws.<br />
• Making government, humanitarian<br />
and developmental<br />
actors and service providers<br />
aware of the importance<br />
of ensuring the availability<br />
of age- and gender-specific<br />
health and physical rehabilitation,<br />
psychosocial support,<br />
protection, education and<br />
livelihood support services<br />
for child survivors and victims<br />
of ERW and landmines.<br />
• Training health professionals,<br />
including emergency<br />
response personnel, surgeons<br />
and ortho-prosthetic<br />
service providers, in the<br />
specific considerations<br />
and special needs of<br />
child survivors.<br />
• Training education service<br />
providers, including school<br />
management, teachers and<br />
ERW/Cluster<br />
submunitions<br />
67%<br />
ERW, 65%<br />
Cluster<br />
submunition, 2%<br />
educators, in providing<br />
accessible and appropriate<br />
education for child survivors<br />
and victims.<br />
• Formulating national laws,<br />
plans and policies responding<br />
to the needs of survivors<br />
and victims of ERW and landmines,<br />
or of persons <strong>with</strong><br />
disabilities in general, so that<br />
they integrate and respond to<br />
the age- and gender-specific<br />
needs of child survivors<br />
and victims.<br />
• Integrating a strong victim<br />
assistance component into<br />
the draft UN Inter-Agency<br />
Mine Action Strategy, including<br />
specific child-survivor<br />
assistance considerations.<br />
HUMANITARIAN RESPONSE<br />
59
60<br />
PERSPECTIVE<br />
One bite of the elephant<br />
at a time<br />
By Chaeli Mycroft<br />
Chaeli Mycroft, recipient of the<br />
2011 International <strong>Children</strong>’s<br />
Peace Prize, is an ability activist<br />
and avid wheelchair dancer. She<br />
is preparing to study politics and<br />
philosophy at the University of<br />
Cape Town, South Africa.<br />
Some people see disability as<br />
a burden, others as a gift. My<br />
disability has given me very<br />
unique opportunities and experiences<br />
that would not have<br />
happened if I were not disabled.<br />
I am happy and grateful<br />
for my disability because it has<br />
moulded me into the person<br />
that I am today.<br />
I am in no way saying that<br />
having a disability is an easy<br />
thing to deal <strong>with</strong>. It is a very<br />
complex situation, and it affects<br />
almost every aspect of your<br />
life. But I hope, throughout<br />
my life, to inspire other young<br />
people to see their disabilities<br />
as an opportunity to focus<br />
on ability, not just on their<br />
limitations.<br />
THE STATE OF THE WORLD’S CHILDREN 2013: <strong>Children</strong> <strong>with</strong> <strong>Disabilities</strong><br />
My family has always challenged<br />
me to focus on my<br />
abilities and has never viewed<br />
or treated me <strong>with</strong> pity. For<br />
this, I will be eternally grateful<br />
because it made me see myself<br />
as equal to any able-bodied<br />
person. I was also raised knowing<br />
that my contribution is of<br />
equal importance to anyone<br />
else’s, and to stand up (metaphorically)<br />
for my rights. My<br />
friends view me as an equal<br />
and accept that my disability<br />
sometimes makes it difficult for<br />
me to do things in the same<br />
manner as they do, so we just<br />
have to be slightly more creative<br />
to include me in whatever<br />
we’re doing – playing cricket<br />
when we were younger, for<br />
example. I would be the scorer.<br />
The incredible support I<br />
received enabled me to work<br />
<strong>with</strong> children <strong>with</strong> disabilities<br />
in South Africa. For this I won<br />
the International <strong>Children</strong>’s<br />
Peace Prize in 2011 – an event<br />
that has changed my life in an<br />
amazing way. The KidsRights<br />
Foundation, which awards this<br />
prize annually, has given me<br />
the opportunity to spread my<br />
message through a worldwide<br />
platform and to meet people<br />
I would otherwise never meet.<br />
They also pay for my education<br />
and are making it possible
If people <strong>with</strong> disabilities can’t believe in themselves or if others<br />
don’t believe in them, I will believe in them – and hopefully my<br />
positivity will spread and encourage more positivity.<br />
for me to go to university next<br />
year <strong>with</strong> all the adjustments<br />
I need.<br />
So many children <strong>with</strong> disabilities<br />
are not celebrated for their<br />
capabilities and are hidden<br />
away from the world because<br />
of fear and ignorance. We need<br />
to realize that people <strong>with</strong> disabilities<br />
are crucial in our population.<br />
People <strong>with</strong> disabilities<br />
are often the ones who think<br />
outside the box – because we<br />
have to. We have to make our<br />
disabilities work for us and not<br />
against us, and teach others<br />
to be caring and empathetic.<br />
Empathy, something the world<br />
desperately needs.<br />
I believe that there are two<br />
main issues to be tackled on a<br />
worldwide level – accessibility<br />
and attitudes. These issues<br />
are interconnected and cannot<br />
be dealt <strong>with</strong> one by one. If<br />
people can change the worldwide<br />
attitude towards disability<br />
from one of pity, shame and<br />
inferiority to one of abundance,<br />
acceptance and equality, then<br />
we will see amazing progress.<br />
Positive attitudes can lead to<br />
improved accessibility – just as<br />
inaccessibility is an expression<br />
of the view that the needs of<br />
people <strong>with</strong> disabilities are less<br />
important than those of able-<br />
bodied people, an attitude that<br />
has negative consequences<br />
for people <strong>with</strong> and <strong>with</strong>out<br />
disabilities.<br />
Improved attitudes should<br />
also help address other major<br />
issues, such as our experiences<br />
of education. I have been in<br />
every form of education that<br />
a person <strong>with</strong> a disability can<br />
do: special needs school, mainstream<br />
state primary and high<br />
school, mainstream private<br />
high school. I wouldn’t say I’m<br />
an expert, but there’s a lot to<br />
be said for experience. It was<br />
certainly not always easy and<br />
simple. Often it was a struggle,<br />
and at times I was incredibly<br />
unhappy. I worked really hard<br />
to be included and to make it<br />
easier for the people who are<br />
going to come after me. I am<br />
finishing my school career in a<br />
place where I am fully included<br />
and accepted. When I think<br />
about it, all I feel is relief –<br />
relief that I don’t have to fight<br />
so hard for my own happiness<br />
anymore. Now I can fight<br />
harder for other people <strong>with</strong><br />
disabilities and their right to<br />
happiness.<br />
It may seem that I am always<br />
a super-positive person. This<br />
is not the case. I have had my<br />
struggles, and I am sure that<br />
they are not over. The thing<br />
that tips the scale towards positivity<br />
is the fact that I am surrounded<br />
by people who believe<br />
in my ability and are positive<br />
about my contribution to society<br />
– people who counter my<br />
negative days. I really love<br />
them for that.<br />
My lifetime goal is to have disability<br />
become something that<br />
is completely accepted and<br />
embraced by the global community.<br />
It may be a big task,<br />
and it may have many facets,<br />
but I believe it’s entirely<br />
possible.<br />
It starts <strong>with</strong> believing. I believe<br />
in my abilities; I believe wholeheartedly<br />
that I can make<br />
change happen – that I can<br />
change lives. If people <strong>with</strong> disabilities<br />
can’t believe in themselves<br />
or if others don’t believe<br />
in them, I will believe in them –<br />
and hopefully my positivity will<br />
spread and encourage more<br />
positivity. This might seem<br />
insignificant to some but it’s<br />
still change.<br />
One bite of the elephant at<br />
a time.<br />
HUMANITARIAN RESPONSE<br />
61
A health worker assesses a boy at the Atfaluna Society for Deaf <strong>Children</strong>, State of Palestine. The organization offers education<br />
and vocational training, free health care, psychosocial services and job placement. © UNICEF/HQ2008-0159/Davey
Measuring child disability presents a unique set<br />
of challenges. Because children develop and<br />
learn to perform basic tasks at different speeds,<br />
it can be difficult to assess function and distinguish<br />
significant limitations from variations in<br />
normal development. 114 The varying nature and<br />
severity of disabilities, together <strong>with</strong> the need to<br />
apply age-specific definitions and measures, further<br />
complicate data collection efforts. In addition,<br />
the poor quality of data on child disability<br />
stems, in some cases, from a limited understanding<br />
of what disability is in children and, in<br />
other cases, from stigma or insufficient investment<br />
in improving measurement. The lack of<br />
evidence that results from such difficulties hinders<br />
the development of good policies and the<br />
delivery of vital services. As discussed below,<br />
however, efforts to improve data collection are<br />
under way – and the very act of gathering information<br />
is sparking positive change.<br />
Evolving definitions<br />
MEASURING CHILD<br />
DISABILITY<br />
A society cannot be equitable unless all children are<br />
included, and children <strong>with</strong> disabilities cannot be<br />
included unless sound data collection and analysis<br />
render them visible.<br />
While there is general agreement that definitions<br />
of disability should incorporate both<br />
medical and social determinants, the measurement<br />
of disability is still predominantly medical,<br />
<strong>with</strong> a focus on specific physical or<br />
mental impairments.<br />
Estimates of disability prevalence vary depending<br />
on what definition of disability is used.<br />
Narrow, medical definitions are likely to yield<br />
lower estimates than broader ones that take<br />
into account social barriers to functioning and<br />
participation. 115<br />
CHAPTER 6<br />
One framework for seeing health and disability<br />
<strong>with</strong>in a broader context of social barriers is<br />
the International Classification of Functioning,<br />
Disability and Health (ICF), developed by the<br />
World Health Organization. 116 This classification<br />
regards disability in two main ways: as a matter<br />
of the body’s structure and functions, and in<br />
terms of the person’s activity and participation.<br />
Disability, as defined by the ICF, is an ordinary<br />
part of human existence. ICF’s definition effectively<br />
mainstreams disability, shifting the focus<br />
from cause to effect and acknowledging that<br />
every person can experience some degree of<br />
disability. The ICF definition also recognizes that<br />
functioning and disability occur in context, and<br />
therefore it is meaningful to assess not only bodily<br />
but also societal and environmental factors.<br />
While the ICF was principally designed for<br />
adult disability, a classification derived from it,<br />
the International Classification of Functioning,<br />
Disability and Health for <strong>Children</strong> and Youth<br />
(ICF-CY) takes a step towards incorporating<br />
the social dimension by capturing not only the<br />
impairment but also its effect on children’s functioning<br />
and participation in their environment.<br />
The classification covers four main areas: body<br />
MEASURING CHILD DISABILITY<br />
63
64<br />
structures (e.g., organs, limbs and structures of<br />
the nervous, visual, auditory and musculoskeletal<br />
systems), body functions (physiological functions<br />
of body systems, such as listening or remembering),<br />
limitations on activity (e.g., walking, climbing,<br />
dressing) and restrictions on participation<br />
(e.g., playing <strong>with</strong> caregivers or other children,<br />
performing simple chores). 117<br />
Putting disability in context<br />
Data should be interpreted in context. Estimates<br />
of disability prevalence are a function of both<br />
incidence and survival, and the results should<br />
be interpreted <strong>with</strong> caution, particularly in countries<br />
where infant and child mortality rates are<br />
high. 118 A low reported prevalence of disability<br />
may be the consequence of low survival rates<br />
for young children <strong>with</strong> disabilities, or it may<br />
reflect the failure to count children <strong>with</strong><br />
disabilities who are confined to institutions,<br />
who are hidden away by families fearful of<br />
Four case studies:<br />
Percentage of population<br />
reporting some form of disability<br />
uUganda<br />
One question<br />
asked:<br />
Is anyone who<br />
was in the<br />
household on<br />
census night<br />
disabled?<br />
1%<br />
Census<br />
1991<br />
One question<br />
asked:<br />
Does (name)<br />
have any<br />
difficulty in<br />
moving, seeing,<br />
hearing,<br />
speaking or<br />
learning, which<br />
has lasted or is<br />
expected to last<br />
6 months or<br />
more?<br />
4%<br />
Census<br />
2002<br />
Source: UNICEF, from surveys and censuses identified above.<br />
THE STATE OF THE WORLD’S CHILDREN 2013: <strong>Children</strong> <strong>with</strong> <strong>Disabilities</strong><br />
discrimination, or who live and work on<br />
the streets.<br />
Culture also plays an important role. The interpretation<br />
of what may be considered ‘normal’<br />
functioning varies across contexts and influences<br />
measurement outcomes. The attainment<br />
of certain milestones may not only vary among<br />
children, but differ also by culture. <strong>Children</strong> may<br />
be encouraged to experiment <strong>with</strong> new activities<br />
at different stages of development. For instance,<br />
in one study, 50 per cent of children were ‘able<br />
to use a cup’ at about 35 months of age in urban<br />
India, while the corresponding milestone was<br />
reached around 10 months of age in Thailand. 119<br />
It is therefore important to assess children<br />
against reference values appropriate to local<br />
circumstances and understanding.<br />
For these reasons, assessment tools developed<br />
in high-income countries, such as the Wechsler<br />
Intelligence Scale for <strong>Children</strong> and Griffith’s<br />
One question<br />
asked:<br />
Do you have<br />
(serious)<br />
difficulty in<br />
moving, seeing,<br />
hearing,<br />
speaking or<br />
learning which<br />
has lasted or<br />
is expected to<br />
last 6 months<br />
or more?<br />
7%<br />
Uganda National<br />
Household Survey<br />
2005/2006<br />
6 questions asked,<br />
including:<br />
Does (name) have<br />
difficulty seeing,<br />
even if he/she is<br />
wearing glasses?<br />
20%<br />
Demographic and<br />
Health Survey<br />
(DHS) 2006
Mental Development Scale, 120 cannot be indiscriminately<br />
applied in other countries or communities,<br />
as their capacity to detect and accurately measure<br />
disability in different sociocultural contexts<br />
is often untested. Frames of reference may vary,<br />
and survey tools may fail to sufficiently capture<br />
local customs, cultural understanding, languages<br />
or expressions. For example, questionnaires that<br />
evaluate child development on the basis of such<br />
‘standard’ activities as preparing breakfast cereal<br />
or playing board games may be appropriate in<br />
some places but not in those where children do<br />
not routinely engage in these activities. 121<br />
Data collection<br />
The specific objectives of the data collection are<br />
likely to influence the definition of what constitutes<br />
‘disability’, the questions asked and the<br />
resulting figures. The measurement of disability<br />
type and prevalence is frequently tied to specific<br />
political initiatives, such as social protection<br />
uAustralia 12 questions<br />
asked, including:<br />
13 questions asked, including:<br />
Does anyone have any loss of hearing?<br />
CONTINUED u<br />
Is there<br />
anyone in<br />
the household<br />
who has any<br />
loss of sight?<br />
Does everyone<br />
have full use of<br />
their arms and<br />
fingers?<br />
Does anyone have any condition that makes them<br />
slow at learning or understanding things?<br />
Does anyone have any condition that restricts them<br />
in physical activities, or in doing physical work?<br />
Does anyone have any disfigurement or deformity?<br />
Does anyone ever need to be helped or supervised<br />
in doing things because of any mental illness?<br />
17 questions<br />
asked, including:<br />
Do you/does<br />
anyone in the<br />
household have<br />
anything wrong<br />
One question asked:<br />
Is this person<br />
handicapped by a<br />
serious long-term<br />
illness or physical<br />
or mental<br />
condition?<br />
Is anyone<br />
receiving<br />
treatment for<br />
nerves or any<br />
emotional<br />
condition?<br />
Is anyone having<br />
long-term<br />
treatment or<br />
taking any<br />
medicine or<br />
tablets for a<br />
condition or<br />
ailment?<br />
18%<br />
4 questions asked,<br />
including:<br />
Does the person ever<br />
need someone to help<br />
<strong>with</strong>, or be <strong>with</strong> them<br />
for, self-care activities?<br />
Does the person ever<br />
need someone to help<br />
<strong>with</strong>, or be <strong>with</strong> them<br />
for, communication<br />
activities?<br />
19%<br />
<strong>with</strong> your/their<br />
speech?<br />
Do you/does<br />
anyone in the<br />
household have<br />
shortness of<br />
breath or<br />
difficulty<br />
breathing?<br />
Do you/does<br />
anyone in the<br />
household have<br />
chronic or<br />
recurrent pain or<br />
discomfort?<br />
5%<br />
4%<br />
4%<br />
Do you/does<br />
anyone in the<br />
household have<br />
a nervous or<br />
emotional<br />
condition?<br />
Census<br />
1976<br />
Survey of<br />
Handicapped<br />
Persons 1981<br />
Survey of<br />
Disability, Ageing<br />
and Carers 1993<br />
schemes. Results may be used to determine<br />
benefit entitlement or to plan and determine support<br />
provision. For example, the criteria used to<br />
define eligibility for a disability benefit are likely<br />
to be more restrictive than criteria for a survey<br />
conducted to identify all persons <strong>with</strong> a functional<br />
limitation, yielding dramatically different<br />
numbers. 122<br />
Many children are identified as having a disability<br />
when they come into contact <strong>with</strong> education<br />
or health-care systems. However, in low-income<br />
countries or communities, school and clinic staff<br />
may not be able to routinely recognize or register<br />
the presence of children <strong>with</strong> disabilities. The<br />
resulting paucity of information about children<br />
<strong>with</strong> disabilities in low-income countries has contributed<br />
to a misconception that disability does<br />
not merit global priority. 123<br />
Where schooling or other formal services for children<br />
<strong>with</strong> disabilities are lacking, other methods<br />
Census<br />
2006<br />
Survey of<br />
Disability, Ageing<br />
and Carers 2009<br />
MEASURING CHILD DISABILITY<br />
65
66<br />
of enumeration, such as censuses, general and<br />
targeted household surveys, and interviews <strong>with</strong><br />
key informants, have been used to estimate<br />
disability prevalence.<br />
General data collection instruments are likely to<br />
underestimate the number of children <strong>with</strong> disabilities.<br />
124 They typically employ a generic or<br />
filter question, such as whether anyone in the<br />
household ‘is disabled’, or use the same questions<br />
for all household members regardless of<br />
their age. <strong>Children</strong> in particular are likely to be<br />
overlooked in surveys that do not specifically ask<br />
about them. 125<br />
Targeted household surveys that specifically<br />
address the issue of child disability or include<br />
measures specifically designed to evaluate disability<br />
in children have produced more accurate<br />
results than household surveys or censuses that<br />
ask about disability in general. 126 Such surveys<br />
tend to report higher prevalence rates because<br />
FOUR CASE STUDIES (Continued)<br />
uCambodia<br />
3 questions asked:<br />
Does (name) have<br />
any disability?<br />
If yes, what type?<br />
What was the<br />
cause?<br />
2%<br />
Socio-Economic<br />
Survey 1999<br />
2 questions asked:<br />
Is there a person<br />
who usually lives in<br />
your household<br />
who has any type<br />
of physical<br />
impairment?<br />
Impaired since<br />
birth or due to an<br />
accident?<br />
2%<br />
Demographic and<br />
Health Survey 2000<br />
2 questions asked:<br />
Does (name) have<br />
any disability?<br />
What was the<br />
cause?<br />
4%<br />
Socio-Economic<br />
Survey 2003–2004<br />
THE STATE OF THE WORLD’S CHILDREN 2013: <strong>Children</strong> <strong>with</strong> <strong>Disabilities</strong><br />
they usually include more numerous and<br />
detailed questions.<br />
Questionnaire design<br />
Even well-designed surveys can misreport disability<br />
if a single set of questions is applied to<br />
children across the age spectrum. The choice<br />
of questions must be tailored to a child’s age in<br />
order to reflect the developmental stages and<br />
evolving capacities of children. 127 Some domains,<br />
such as self-care (e.g., washing and dressing),<br />
will not be appropriate for very young children.<br />
Given the complexity of developmental processes<br />
that take place over the first two years of life,<br />
it can be difficult to distinguish disability from<br />
variations in normal development <strong>with</strong>out specialized<br />
tools or assessment. 128<br />
Questions designed to assess disability in the<br />
adult population are not always applicable to<br />
children, yet many survey instruments use a<br />
One question asked:<br />
If the person is<br />
physically/mentally<br />
disabled, give<br />
appropriate code<br />
from the list<br />
1: in seeing;<br />
2: in speech;<br />
3: in hearing;<br />
4: in movement;<br />
5: mental<br />
1%<br />
Census<br />
2008<br />
One question asked:<br />
Does (name) have<br />
any of the following:<br />
Difficulty seeing,<br />
difficulty hearing,<br />
difficulty speaking,<br />
difficulty moving,<br />
difficulties in feeling<br />
or sensing,<br />
psychological or<br />
behavioural<br />
difficulties, learning<br />
difficulties, fits, other<br />
(specify)?<br />
5%<br />
Socio-Economic<br />
Survey 2010
single set of questions for both groups. Examples<br />
of questions <strong>with</strong> limited relevance to children<br />
include those about falling down or memory<br />
loss, as well as questions about tasks children<br />
may be too young to accomplish independently.<br />
Questions that link disability <strong>with</strong> an<br />
elderly population are not only irrelevant to child<br />
assessment but may also introduce a bias in the<br />
respondent’s mind as to which should be considered<br />
disability and thus affect the nature and<br />
quality of the response. 129 In order to accurately<br />
assess disability in children, care must be taken<br />
to use questionnaires specifically designed for<br />
the purpose.<br />
Many data collection instruments, including<br />
household surveys and censuses, are based<br />
on parental responses only, <strong>with</strong> caregivers<br />
normally expected to assess and report the disability<br />
status of children under their care. While<br />
parents and other caregivers are often very well<br />
placed to identify difficulties that their children<br />
uTurkey<br />
3 questions<br />
asked:<br />
Do you have a<br />
visible physical<br />
disability, mental<br />
disorder or<br />
psychological<br />
defect?<br />
What is its<br />
nature?<br />
What was the<br />
cause?<br />
1%<br />
Census<br />
1985<br />
2 questions<br />
asked:<br />
Do you have<br />
any physical<br />
or mental<br />
disability?<br />
What kind?<br />
2%<br />
Census<br />
2000<br />
12%<br />
Turkey Disability Survey<br />
2002<br />
5 questions<br />
asked,<br />
including:<br />
Do you<br />
have any<br />
disfigurement;<br />
restriction of<br />
movement;<br />
bone disease;<br />
muscular<br />
weakness; lack,<br />
shortness or<br />
excess of your<br />
hands, arms,<br />
feet, legs,<br />
fingers or<br />
backbone?<br />
Are you able to<br />
speak, do you<br />
have a speech<br />
impediment,<br />
do you<br />
speak <strong>with</strong> a<br />
stammer?<br />
may experience in performing specific tasks,<br />
their responses alone are not sufficient to diagnose<br />
disabilities or establish a prevalence of<br />
disability. Accurate assessment of disability in<br />
a child requires a thorough understanding of<br />
age-appropriate behaviours. Survey respondents<br />
may have limited knowledge of specific benchmarks<br />
used for evaluating children at each stage<br />
of development and may not be in a position to<br />
adequately detect manifestations of particular<br />
types of disability. Certain temporary conditions,<br />
such as an ear infection, may cause acute difficulties<br />
in performing certain tasks and be reported<br />
as a form of disability. At the same time, parents<br />
may overlook certain signs, or hesitate to report<br />
them, because of a lack of acceptance or stigma<br />
surrounding disability in their culture. The choice<br />
of terminology used in questionnaires can either<br />
reinforce or correct such statistically distorting<br />
and socially discriminatory phenomena.<br />
Purpose and consequences<br />
Efforts to measure child disability represent an<br />
opportunity to link assessment <strong>with</strong> intervention<br />
strategies. Often an assessment provides<br />
the first chance for a child <strong>with</strong> a disability to be<br />
identified and referred to or receive some form<br />
of immediate care. Unfortunately, capacity and<br />
resources for follow-up assessment and support<br />
for those children who screen positive for disability<br />
are often scarce. 130 Recognizing the critical<br />
role of early intervention, the possibility of linking<br />
screening and assessment <strong>with</strong> simple interventions<br />
should be explored, especially in low- and<br />
middle-income settings.<br />
Data that capture the type and severity of children’s<br />
disabilities as well as the barriers to the<br />
functioning and community participation of children<br />
<strong>with</strong> disabilities, when combined <strong>with</strong> relevant<br />
socio-economic indicators, help to inform<br />
decisions about how to allocate resources,<br />
eliminate barriers, design and provide services<br />
and meaningfully evaluate such interventions.<br />
For instance, data can be used to map whether<br />
income, gender or minority status affects access<br />
MEASURING CHILD DISABILITY<br />
67
68<br />
to education, immunization or nutritional<br />
supplementation for children <strong>with</strong> disabilities.<br />
Regular monitoring makes it possible to assess<br />
whether initiatives designed to benefit children<br />
are meeting their goals.<br />
There is a clear need to harmonize child disability<br />
measurement in order to produce estimates<br />
that are reliable, valid and internationally comparable.<br />
This would facilitate appropriate policy<br />
A way forward<br />
UNICEF is holding consultations to improve the methodology used to measure child disability in Multiple<br />
Indicator Cluster Surveys and other data collection efforts. This work is taking place in partnership <strong>with</strong> the<br />
Washington Group on Disability Statistics, national statistical offices and data collection agencies, academics,<br />
practitioners, disabled people’s organizations and other stakeholders. Partnership is seen as essential to achieving<br />
a reliable and globally relevant monitoring and reporting system on child disability.<br />
The Washington Group was established in 2001 under United Nations sponsorship to improve the quality and<br />
international comparability of disability measures. It has developed or endorsed questions on disability in adults<br />
that have been used by several countries in censuses and surveys and, in 2010, began work on developing a set<br />
of questions to measure functioning and disability among children and youth.<br />
Work by UNICEF and the Washington Group to develop a screening tool that reflects current thinking on<br />
child functioning and disability is based on the conceptual framework of the World Health Organization’s<br />
International Classification of Functioning, Disability and Health for <strong>Children</strong> and Youth. The screening tool<br />
under development focuses on limitations to activity and is intended to serve the purposes of any individual<br />
country in identifying those children at risk of social exclusion and reduced social participation in family life<br />
or education, for example. The collaborative effort aims to develop a survey module on child functioning and<br />
disability that would produce nationally comparable figures and promote the harmonization of data on child<br />
functioning and disability internationally. The module covers children aged 2–17 years and assesses speech and<br />
language, hearing, vision, learning (cognition and intellectual development), mobility and motor skills, emotions<br />
and behaviours. In addition to these relatively basic types of activity, the screening tool also includes aspects of<br />
children’s ability to participate in a range of activities and social interactions. Rather than rely on a simple yes/<br />
no approach, these aspects are to be assessed against a rating scale, to better reflect the degree of disability.<br />
Also in development is a standardized overall methodology for a more in-depth assessment of disability in children.<br />
This will consist of data collection protocols and assessment tools, as well as a framework for the analysis<br />
of findings. Recognizing that specialists may be in short supply in some areas, a toolkit is being designed to<br />
enable teachers, community workers and other trained professionals to administer the new methodology. This<br />
will serve to strengthen local capacity to identify and assess children <strong>with</strong> disabilities.<br />
THE STATE OF THE WORLD’S CHILDREN 2013: <strong>Children</strong> <strong>with</strong> <strong>Disabilities</strong><br />
and programmatic responses by governments<br />
and their international partners, and thus fulfil<br />
a requirement of the Convention on the Rights<br />
of Persons <strong>with</strong> <strong>Disabilities</strong>. However, the currently<br />
fragmented state of child disability data<br />
collection is no excuse to defer meaningful action<br />
towards inclusion. As new data and analyses<br />
emerge, they will present opportunities to adapt<br />
existing and planned programmes for children<br />
<strong>with</strong> disabilities and their families.
FOCUS<br />
Lessons learned<br />
Since 1995, UNICEF has supported<br />
countries in tracking<br />
progress in key areas of children’s<br />
and women’s wellbeing<br />
through the Multiple<br />
Indicator Cluster Surveys<br />
(MICS). These nationally<br />
representative household<br />
surveys have been conducted<br />
in more than 100 low- and<br />
middle-income countries, and<br />
some have included a module<br />
designed to screen child disability.<br />
This information is now<br />
being built upon to design an<br />
improved measurement tool<br />
to assess child disability.<br />
Disability became part of the<br />
MICS questionnaires in 2000–<br />
2001 (MICS2). Since then, data<br />
on disability have been collected<br />
through more than 50<br />
surveys, making the MICS the<br />
largest source of comparable<br />
data on child disability in lowand<br />
middle-income countries.<br />
The standard disability module<br />
included in MICS surveys<br />
conducted between 2000 and<br />
2010 is the Ten Questions<br />
Screen (TQ), which was<br />
developed as part of the<br />
International Pilot Study of<br />
Severe Childhood Disability in<br />
1984. Its design reflects how<br />
disability was understood and<br />
measured at the time.<br />
The TQ process starts <strong>with</strong><br />
an interview <strong>with</strong> the primary<br />
caregivers of children aged<br />
2–9 years, who are asked to<br />
provide a personal assessment<br />
of the physical and mental<br />
development and functioning<br />
of the children under their care.<br />
Questions include whether the<br />
child appears to have difficulty<br />
hearing; whether she or he<br />
seems to understand instructions,<br />
has fits or loses consciousness;<br />
and whether she<br />
or he was delayed in sitting,<br />
standing or walking compared<br />
to other children. Response categories<br />
do not accommodate<br />
nuances, and children are classified<br />
as screening positive or<br />
negative to each question.<br />
The validity of the Ten<br />
Questions approach has been<br />
widely tested, but results must<br />
be interpreted <strong>with</strong> caution.<br />
The TQ is a screening tool, and<br />
requires follow-up medical and<br />
developmental assessment in<br />
order to yield a reliable estimate<br />
of the number of children<br />
in a given population who have<br />
disabilities. <strong>Children</strong> who have<br />
a serious disability are very<br />
likely to screen positive, but<br />
some who screen positive may<br />
be found to have no disability<br />
on further evaluation. Some<br />
children who screen positive<br />
may do so because of temporary<br />
health conditions that can<br />
be easily treated. Although the<br />
TQ comes <strong>with</strong> a recommendation<br />
that it be followed by an<br />
in-depth assessment, few countries<br />
have had the budgets or<br />
capacity to conduct the secondstage<br />
clinical assessment to<br />
validate results, and they have<br />
been further hampered by the<br />
lack of a standardized methodology<br />
for conducting the<br />
assessment.<br />
Applying the Ten Questions<br />
Screen during the 2005–2006<br />
MICS yielded a wide range<br />
of results across participating<br />
countries: The percentage of<br />
children who screened positive<br />
for disability ranged from<br />
3 per cent in Uzbekistan to 48<br />
per cent in the Central African<br />
Republic. It was not clear<br />
whether this variance reflected<br />
true differences among the<br />
populations sampled or additional<br />
factors. For instance, the<br />
low reported rate in Uzbekistan<br />
might have reflected, among<br />
other things, a large population<br />
of children <strong>with</strong> disabilities<br />
living in institutions, which<br />
are not subject to household<br />
surveys.<br />
MEASURING CHILD DISABILITY<br />
69
70<br />
FOCUS<br />
From screening<br />
to assessment<br />
Child disability measurement<br />
experts agree that screening<br />
efforts, such as interviews<br />
using the Ten Questions Screen<br />
(TQ), need to be followed by<br />
in-depth assessments. These<br />
allow the initial screening<br />
results to be validated, and<br />
make possible a better understanding<br />
of the extent and<br />
nature of child disability in a<br />
country. Cambodia, Bhutan and<br />
the former Yugoslav Republic<br />
of Macedonia are three countries<br />
to have undertaken such<br />
assessments. Their experiences<br />
provide important lessons for<br />
the measurement of child disability<br />
and adaptation of methodology<br />
to local context. They<br />
also testify to the transformative<br />
power of data collection.<br />
In Cambodia, all children<br />
who screened positive under<br />
the Ten Questions and a randomly<br />
selected 10 per cent<br />
who screened negative were<br />
referred for further assessment<br />
by a multi-professional<br />
team consisting of doctors,<br />
hearing and vision specialists,<br />
and psychologists. The team<br />
was trained and dispatched<br />
around the country to conduct<br />
child disability assessments in<br />
local health centres and similar<br />
facilities. The decision to use<br />
a mobile team of specialists<br />
was made to ensure consistent<br />
quality of screening across the<br />
country and to minimize the<br />
lag between screening and<br />
assessment.<br />
The same sampling approach<br />
was employed in Bhutan,<br />
where the screening stage<br />
identified 3,500 children at risk,<br />
out of a sample of 11,370 children.<br />
A core team of seven professionals<br />
received two weeks<br />
of training in how to conduct<br />
the assessment. In turn, they<br />
were responsible for training<br />
another 120 health and education<br />
professionals. These professionals<br />
were then split into<br />
two groups. The first consisted<br />
of 30 supervisors recruited<br />
from among general-practice<br />
physicians, paediatricians, eye<br />
specialists, physiotherapists<br />
and special educators. The second<br />
group of 90 field surveyors<br />
and assessors was made<br />
up largely of primary school<br />
teachers and health workers.<br />
THE STATE OF THE WORLD’S CHILDREN 2013: <strong>Children</strong> <strong>with</strong> <strong>Disabilities</strong><br />
The methodology used in the<br />
former Yugoslav Republic of<br />
Macedonia was derived from<br />
that used in Cambodia, <strong>with</strong><br />
some adaptations shaped by<br />
the technical expertise and<br />
tools available in the local<br />
context. Two studies were<br />
conducted: a national study<br />
and one focusing on the Roma<br />
population. The assessment<br />
consisted of one hour <strong>with</strong> a<br />
physician and psychologist and<br />
a 10–15 minute assessment<br />
<strong>with</strong> an ophthalmologist and<br />
audiologist.<br />
Experiences in all three<br />
countries demonstrate the<br />
importance of partnerships in<br />
mobilizing limited resources<br />
and ensuring high response<br />
rates, which in turn provide for<br />
robust findings. These partnerships<br />
involved government<br />
agencies and their international<br />
partners, disabled people’s<br />
organizations and other civil<br />
society organizations. In the<br />
former Yugoslav Republic<br />
of Macedonia, for example,<br />
partners made it possible<br />
to conduct assessments in<br />
local kindergartens during
A strategy for intervention on behalf of children identified as<br />
having a disability should be incorporated in the assessment<br />
from the earliest stages of planning.<br />
weekends, which was convenient<br />
for children and their<br />
families.<br />
It is also important to adapt<br />
the composition of the core<br />
assessment team and the type<br />
of tools used to local capacity.<br />
At the time of the study, both<br />
Cambodia and Bhutan faced a<br />
shortage of qualified assessors.<br />
In Cambodia this was overcome<br />
by employing a mobile assessment<br />
team, while in Bhutan<br />
emphasis was put on training<br />
mid-level professionals. The<br />
availability of specialists cannot<br />
be taken for granted – in<br />
the case of Cambodia, the lead<br />
hearing specialist was brought<br />
in from abroad.<br />
Assessment tools – questionnaires<br />
and tests – should be<br />
locally validated and culturally<br />
appropriate. Careful attention<br />
must be paid to language. One<br />
of the challenges encountered<br />
in Cambodia pertained to<br />
translating assessment instruments<br />
from English to Khmer,<br />
and especially finding linguistic<br />
equivalents for the concepts<br />
of impairment and disability.<br />
The diagnostic assessment<br />
form used in the Cambodian<br />
study was revised to suit the<br />
former Yugoslav Republic<br />
of Macedonia and the local<br />
Chuturich test was utilized for<br />
the psychological component<br />
of the assessment.<br />
Assessment leads<br />
to action<br />
With assessment comes the<br />
potential for immediate intervention.<br />
In Cambodia, some<br />
children who screened positive<br />
for hearing impairment were<br />
found to have an ear infection<br />
or a build-up of ear wax.<br />
This limited their hearing and<br />
in many cases also their participation<br />
in school, but, once<br />
identified, their conditions were<br />
easily treated and more serious<br />
secondary infections and<br />
longer-term impairments were<br />
thus prevented.<br />
Assessment can also aid<br />
awareness raising and spark<br />
change even while the processes<br />
of collecting and analysing<br />
data are still under way. When<br />
clinical assessments in Bhutan<br />
showed a higher incidence<br />
of mild cognitive disabilities<br />
among children from poorer<br />
households and those whose<br />
mothers had less education,<br />
the government decided to<br />
focus on early childhood development<br />
and childcare services<br />
in rural areas, where income<br />
and education levels are lower.<br />
And in the former Yugoslav<br />
Republic of Macedonia, findings<br />
that revealed unequal<br />
access to education have<br />
spurred plans to improve<br />
school participation and fight<br />
discrimination against children<br />
<strong>with</strong> disabilities.<br />
A strategy for intervention on<br />
behalf of children identified as<br />
having a disability should be<br />
incorporated in the assessment<br />
from the earliest stages of planning.<br />
Such a strategy should<br />
include a mapping of the available<br />
services, the development<br />
of referral protocols and the<br />
preparation of informative<br />
materials for families on how<br />
to adjust children’s surroundings<br />
to enhance functioning<br />
and participation in home and<br />
community life.<br />
MEASURING CHILD DISABILITY<br />
71
72<br />
PERSPECTIVE<br />
From invisibility to inclusion for<br />
indigenous children <strong>with</strong> disabilities<br />
By Olga Montufar Contreras<br />
Olga Montufar Contreras is the<br />
president of the Step by Step<br />
Foundation, a multicultural<br />
organization that promotes<br />
the social mainstreaming of<br />
indigenous people <strong>with</strong> disabilities<br />
in Mexico. The daughter of a<br />
deaf woman, she was trained as<br />
an engineer and has a Master’s<br />
degree in development and<br />
social policy.<br />
Indigenous people have long<br />
had to live <strong>with</strong> extreme<br />
poverty, discrimination and<br />
exclusion from society and<br />
social services. Within our<br />
communities, girls and boys<br />
<strong>with</strong> disabilities are the most<br />
vulnerable and fare the worst.<br />
Their marginalization persists<br />
even though three international<br />
human rights instruments – the<br />
Convention on the Rights of<br />
Persons <strong>with</strong> <strong>Disabilities</strong>, the<br />
United Nations Declaration<br />
on the Rights of Indigenous<br />
Peoples and the Convention on<br />
the Rights of the Child – afford<br />
us a historic opportunity to<br />
address the challenges faced<br />
by indigenous children <strong>with</strong><br />
disabilities.<br />
I grew up <strong>with</strong> physical disability,<br />
brought on by poliomyelitis,<br />
in an indigenous community<br />
and I have seen that despite the<br />
passing of the years, the situation<br />
has changed little – if at all.<br />
Today, just as when I was little,<br />
children <strong>with</strong> disabilities are<br />
ostracized and their rejection<br />
by the community extends to<br />
parents and siblings, because<br />
the disability is considered as<br />
divine punishment and a child<br />
<strong>with</strong> a disability is seen as a<br />
liability for the community.<br />
Now as then, it is extremely<br />
THE STATE OF THE WORLD’S CHILDREN 2013: <strong>Children</strong> <strong>with</strong> <strong>Disabilities</strong><br />
difficult to access services and<br />
meet the additional expenses<br />
generated by a family member<br />
<strong>with</strong> a disability. Grinding poverty,<br />
geographic isolation and<br />
political marginalization sustain<br />
and are reinforced by discrimination<br />
and prejudice. The consequences<br />
can be severe: Many<br />
mothers, weak and lacking the<br />
power to change things, remain<br />
silent about our condition or<br />
resort to infanticide.<br />
My family is one of few that<br />
show solidarity towards their<br />
sons and daughters who have<br />
disabilities. In our case, this<br />
was partly because we had<br />
migrated to the city and could<br />
obtain housing closer to services.<br />
But in the desperate circumstances<br />
under which most<br />
of our families live, violations<br />
of our human rights are common<br />
and fail to spark concern<br />
among others. This is why it<br />
is necessary to mobilize the<br />
will and resources to take<br />
meaningful action.<br />
One of the most pressing<br />
problems to be addressed is<br />
the lack of data on indigenous<br />
communities in general and<br />
our children <strong>with</strong> disabilities in<br />
particular. Data can be<br />
hard to gather: Indigenous
Data can be hard to gather: Indigenous households can be<br />
scattered, often in remote areas. There might not be enough<br />
interviewers who speak indigenous languages.<br />
households can be scattered,<br />
often in remote areas. There<br />
might not be enough interviewers<br />
who speak indigenous languages.<br />
In many cases, families<br />
deny our existence to the people<br />
who conduct surveys. Even<br />
where parents acknowledge<br />
and want to support us, they<br />
can end up providing insufficient<br />
information because they<br />
have little of it to begin <strong>with</strong>, as<br />
there are few if any screening<br />
or diagnostic services. Because<br />
the lack of such services contributes<br />
to our invisibility, it is<br />
a threat to our physical and<br />
intellectual condition. Adding<br />
to the problems, girls and boys<br />
<strong>with</strong> disabilities often go unregistered<br />
at birth, and this is one<br />
of the main obstacles to the<br />
recognition of our citizenship<br />
and our right to public services.<br />
This should motivate research<br />
into disability among indigenous<br />
populations – and the<br />
results can serve as a starting<br />
point for developing public policies<br />
and services that address<br />
our needs and guarantee our<br />
rights.<br />
The lack of access to the mainstream<br />
education system must<br />
also be corrected. The inclusion<br />
of indigenous children <strong>with</strong> disabilities<br />
is required under the<br />
Convention on the Rights of<br />
Persons <strong>with</strong> <strong>Disabilities</strong>, but<br />
in practice, inclusion is often<br />
beyond the reach of children<br />
from our communities: The<br />
distances they must travel daily<br />
to get to school can be prohibitive.<br />
Few schools have the<br />
minimum services and facilities<br />
to make learning accessible.<br />
And again, traditional community<br />
practices contribute to the<br />
lack of educational inclusion.<br />
Clan chiefs determine the roles<br />
of boys and girls from birth and<br />
if a child has a disability, it is<br />
generally thought that sending<br />
her or him to school is a waste<br />
of time as well as an undue<br />
economic burden on the family.<br />
Many people think that those<br />
of us who have a disability are<br />
broken objects that will not be<br />
useful even if we are patched<br />
up. The situation is even worse<br />
for girls, as it is harder for us to<br />
obtain permission to study than<br />
it is for boys <strong>with</strong> disabilities.<br />
Even when the community’s<br />
stigmas are overcome and we<br />
manage to attend school, our<br />
teachers face two obstacles:<br />
insufficient knowledge of<br />
indigenous languages and<br />
inadequate teacher training in<br />
inclusive education. This lack of<br />
training makes it more difficult<br />
to include children <strong>with</strong> disabilities.<br />
As a consequence, we are<br />
forced to rely on the goodwill<br />
of individual teachers to accept<br />
the challenge of including<br />
indigenous children <strong>with</strong> disabilities<br />
in their classrooms.<br />
In Mexico as elsewhere, governments,<br />
international agencies<br />
and community groups are<br />
striving to eliminate the gap<br />
between what is ideal and what<br />
is currently possible. We must<br />
continue to work together to<br />
ensure more just and equitable<br />
childhoods, to transform the<br />
lives of indigenous girls and<br />
boys <strong>with</strong> disabilities <strong>with</strong> hope<br />
and opportunity – so they, too,<br />
can be free to let their dreams<br />
take flight.<br />
MEASURING CHILD DISABILITY<br />
73
Nguyen, who has autism, attends a class specifically tailored to his needs at the Da Nang Inclusive Education Resource Centre in Viet Nam.<br />
Such centres were set up to help children prepare for admission to inclusive mainstream schools. © UNICEF/Viet Nam/2012/Bisin
Progress has varied between and <strong>with</strong>in countries,<br />
however. Too many children <strong>with</strong> disabilities<br />
continue to face barriers to their participation<br />
in the civic, social and cultural affairs of their<br />
communities. This is true in situations that may<br />
be considered normal as well as during humanitarian<br />
crises. The following recommendations<br />
apply equally urgently in humanitarian situations,<br />
and their application in that context is detailed<br />
in Chapter 5. Realizing the promise of equity<br />
through inclusion will require action in the<br />
areas and by the actors identified below and<br />
throughout this report.<br />
Ratify and implement the<br />
Conventions<br />
The Convention on the Rights of Persons <strong>with</strong><br />
<strong>Disabilities</strong> (CRPD) and the Convention on the<br />
Rights of the Child (CRC) provide detailed guidance<br />
for the development of inclusive societies. As<br />
this year began, 127 countries and the European<br />
Union had ratified the CRPD and 193 had ratified<br />
the CRC. They have thus shown a commitment to<br />
all their citizens. Others have yet to join the global<br />
movement that these countries represent.<br />
Ratification alone will not be enough. The process<br />
of honouring commitments in practice will<br />
require effort on the part of national governments,<br />
local authorities, employers, disabled people’s<br />
organizations and parents’ associations. In<br />
AN AGENDA<br />
FOR ACTION<br />
The nations of the world have repeatedly affirmed their<br />
commitment to building more inclusive societies. As a result,<br />
the situation of many children <strong>with</strong> disabilities and their<br />
families has improved.<br />
addition, international organizations and donors<br />
can align their assistance <strong>with</strong> these international<br />
instruments. Making good on the promises of<br />
the Conventions will require not only diligent<br />
enforcement but also rigorous monitoring and an<br />
unflagging commitment by all to accountability<br />
and adaptation.<br />
Fight discrimination<br />
CHAPTER 7<br />
Discrimination lies at the root of many of the<br />
challenges confronted by children <strong>with</strong> disabilities<br />
and their families. The principles of equal<br />
rights and non-discrimination should be reflected<br />
in law and policy and need to be complemented<br />
by efforts to enhance awareness of disability<br />
among the general public, starting <strong>with</strong> those<br />
who provide essential services for children in<br />
such fields as health, education and protection.<br />
To this end, international agencies and their government<br />
and community partners can increase<br />
efforts to provide officials and public servants at<br />
all levels of seniority <strong>with</strong> a deeper understanding<br />
of the rights, capacities and challenges of<br />
children <strong>with</strong> disabilities so that policymakers<br />
and service providers are able to prevail against<br />
prejudice – be it society’s or their own.<br />
When communities are accepting of disability as<br />
part of human diversity, when generic systems<br />
like education and recreation are available and<br />
inclusive, and when parents are not forced to<br />
AN AGENDA FOR ACTION<br />
75
Convention on the Rights of Persons <strong>with</strong> <strong>Disabilities</strong> and<br />
Optional Protocol: Signatures and ratifications<br />
155<br />
COUNTRIES HAVE<br />
SIGNED THE<br />
CONVENTION*<br />
76<br />
carry the entire additional costs associated <strong>with</strong><br />
disability, the families of children <strong>with</strong> disabilities<br />
can cope and thrive much like other families.<br />
Parents’ organizations can play a pivotal role and<br />
should be reinforced so that children <strong>with</strong> disabilities<br />
are valued, cherished and supported by<br />
their families and communities.<br />
States parties to the CRPD and the United<br />
Nations and its agencies have committed themselves<br />
to conducting awareness-raising campaigns<br />
to change attitudes towards children<br />
Afghanistan<br />
Albania<br />
Algeria<br />
Andorra<br />
Angola<br />
Antigua and Barbuda<br />
Argentina<br />
Armenia<br />
Australia<br />
Austria<br />
Azerbaijan<br />
Bahamas<br />
Bahrain<br />
Bangladesh<br />
Barbados<br />
Belarus<br />
Belgium<br />
Belize<br />
Benin<br />
Bhutan<br />
128<br />
COUNTRIES HAVE<br />
RATIFIED THE<br />
CONVENTION*<br />
91<br />
COUNTRIES HAVE<br />
SIGNED THE<br />
PROTOCOL<br />
Bolivia (Plurinational State of)<br />
Bosnia and Herzegovina<br />
Botswana<br />
Brazil<br />
Brunei Darussalam<br />
Bulgaria<br />
Burkina Faso<br />
Burundi<br />
Cambodia<br />
Cameroon<br />
Canada<br />
Cape Verde<br />
Central African Republic<br />
Chad<br />
Chile<br />
China<br />
Colombia<br />
Comoros<br />
Congo<br />
Cook Islands<br />
*Includes the European Union.<br />
Source: UN Enable; United Nations Treaty Collection. For notes on terms used, see p.154.<br />
THE STATE OF THE WORLD’S CHILDREN 2013: <strong>Children</strong> <strong>with</strong> <strong>Disabilities</strong><br />
<strong>with</strong> disabilities and their families. Among other<br />
things, this will involve highlighting their abilities<br />
and capacities, and promoting community<br />
engagement <strong>with</strong> and by children <strong>with</strong> disabilities.<br />
States parties are also required to provide<br />
information to families on how to avoid, recognize<br />
and report instances of exploitation, violence<br />
and abuse.<br />
Discrimination on the grounds of disability is<br />
a form of oppression. The establishment of<br />
a clear, legal entitlement to protection from<br />
76<br />
COUNTRIES HAVE<br />
RATIFIED THE<br />
PROTOCOL<br />
Costa Rica<br />
Côte d’Ivoire<br />
Croatia<br />
Cuba<br />
Cyprus<br />
Czech Republic<br />
Democratic People’s<br />
Republic of Korea<br />
Democratic Republic<br />
of the Congo<br />
Denmark<br />
Djibouti<br />
Dominica<br />
Dominican Republic<br />
Ecuador<br />
Egypt<br />
El Salvador<br />
Equatorial Guinea<br />
Eritrea<br />
Estonia<br />
27<br />
COUNTRIES HAVE<br />
NOT SIGNED<br />
Ethiopia<br />
Fiji<br />
Finland<br />
France<br />
Gabon<br />
Gambia<br />
Georgia<br />
Germany<br />
Ghana<br />
Greece<br />
Grenada<br />
Guatemala<br />
Guinea<br />
Guinea-Bissau<br />
Guyana<br />
Haiti<br />
Honduras<br />
Hungary<br />
Iceland<br />
India
discrimination is vital in reducing the vulnerability<br />
of children <strong>with</strong> disabilities. Legislation is made<br />
more meaningful when children <strong>with</strong> disabilities<br />
are informed of their right to protection from discrimination<br />
and are shown how to exercise this<br />
right. Where legislation banning discrimination<br />
on the basis of disability does not exist, disabled<br />
people’s organizations and civil society as a<br />
whole will continue to have a crucial role to play<br />
in pressing for such laws – as they do in providing<br />
services and promoting transparency<br />
and accountability.<br />
Signed Convention Ratified Convention Signed Protocol Ratified Protocol Not signed<br />
Indonesia<br />
Iran (Islamic Republic of)<br />
Iraq<br />
Ireland<br />
Israel<br />
Italy<br />
Jamaica<br />
Japan<br />
Jordan<br />
Kazakhstan<br />
Kenya<br />
Kiribati<br />
Kuwait<br />
Kyrgyzstan<br />
Lao People’s<br />
Democratic Republic<br />
Latvia<br />
Lebanon<br />
Lesotho<br />
Liberia<br />
Libya<br />
Liechtenstein<br />
Lithuania<br />
Luxembourg<br />
Madagascar<br />
Malawi<br />
Malaysia<br />
Maldives<br />
Mali<br />
Malta<br />
Marshall Islands<br />
Mauritania<br />
Mauritius<br />
Mexico<br />
Micronesia (Federated States of)<br />
Monaco<br />
Mongolia<br />
Montenegro<br />
Morocco<br />
Mozambique<br />
Myanmar<br />
Namibia<br />
Nauru<br />
Nepal<br />
Netherlands<br />
New Zealand<br />
Nicaragua<br />
Niger<br />
Nigeria<br />
Niue<br />
Norway<br />
Oman<br />
Pakistan<br />
Palau<br />
Panama<br />
Papua New Guinea<br />
Paraguay<br />
Peru<br />
Philippines<br />
Poland<br />
Portugal<br />
Qatar<br />
Republic of Korea<br />
Republic of Moldova<br />
Dismantle barriers to inclusion<br />
All children’s environments – early childhood<br />
centres, schools, health facilities, public transport,<br />
playgrounds and so on – can be built to<br />
facilitate access and encourage the participation<br />
of children <strong>with</strong> disabilities alongside their peers.<br />
Universal design – the idea that all products, built<br />
environments, programmes and services should<br />
be usable to the greatest extent possible by all<br />
people, regardless of their ability, age or social<br />
status – should be applied in the construction of<br />
Romania<br />
Russian Federation<br />
Rwanda<br />
Saint Kitts and Nevis<br />
Saint Lucia<br />
Saint Vincent and the<br />
Grenadines<br />
Samoa<br />
San Marino<br />
Sao Tome and Principe<br />
Saudi Arabia<br />
Senegal<br />
Serbia<br />
Seychelles<br />
Sierra Leone<br />
Singapore<br />
Slovakia<br />
Slovenia<br />
Solomon Islands<br />
Somalia<br />
South Africa<br />
South Sudanδ<br />
Spain<br />
Sri Lanka<br />
Sudanδ<br />
Suriname<br />
Swaziland<br />
Sweden<br />
Switzerland<br />
Syrian Arab Republic<br />
Tajikistan<br />
Thailand<br />
(continued on p. 80)<br />
The former Yugoslav Republic<br />
of Macedonia<br />
Timor-Leste<br />
Togo<br />
Tonga<br />
Trinidad and Tobago<br />
Tunisia<br />
Turkey<br />
Turkmenistan<br />
Tuvalu<br />
Uganda<br />
Ukraine<br />
United Arab Emirates<br />
United Kingdom<br />
United Republic of Tanzania<br />
United States<br />
Uruguay<br />
Uzbekistan<br />
Vanuatu<br />
Venezuela (Bolivarian<br />
Republic of)<br />
Viet Nam<br />
Yemen<br />
Zambia<br />
Zimbabwe<br />
AN AGENDA FOR ACTION<br />
77
78<br />
PERSPECTIVE<br />
Open the doors to<br />
education – and employment<br />
By Ivory Duncan<br />
Born in 1991, Ivory Duncan<br />
is pursuing a degree in<br />
Communications Studies from<br />
the University of Guyana. She<br />
advocates for the rights of youth<br />
<strong>with</strong> disabilities through the<br />
Leonard Cheshire Disability Young<br />
Voices network and volunteers<br />
at the National Commission on<br />
Disability in Guyana.<br />
Like me, countless other young<br />
people <strong>with</strong> disabilities are<br />
striving towards a future that<br />
cannot be taken for granted.<br />
Will we overcome the physical<br />
and financial barriers to<br />
higher education? If we make<br />
it through to graduation from<br />
university or vocational school,<br />
what jobs await us? Will we<br />
have equal opportunity, or face<br />
discrimination? Will we get<br />
the chance to prove ourselves<br />
in the competitive world of<br />
employment? And if not, how<br />
are we to be full citizens and<br />
producers, members of society<br />
in equal standing <strong>with</strong> those<br />
who do not have disabilities?<br />
I lost my right leg following a<br />
traffic accident when I was 15<br />
years old. My parents, people<br />
of humble means, persevere in<br />
helping to meet my expenses<br />
so I can pursue a university<br />
education, even as they try to<br />
raise two other children <strong>with</strong><br />
disabilities. Life can be hard,<br />
but I am grateful for my good<br />
fortune: I have a loving family<br />
and am working to accomplish<br />
my dream of getting a degree<br />
and having a career.<br />
Fulfilling our dreams takes<br />
effort not required of young<br />
people <strong>with</strong>out disabilities. To<br />
THE STATE OF THE WORLD’S CHILDREN 2013: <strong>Children</strong> <strong>with</strong> <strong>Disabilities</strong><br />
get from home to the university,<br />
I have no option but to go<br />
by taxi because the only other<br />
way would be to take a boat or<br />
cross the Demerara Harbour<br />
Bridge, neither of which I can<br />
do in my wheelchair. Paying<br />
for a taxi is expensive, and my<br />
parents struggle to make ends<br />
meet. Attending university<br />
is also a physical challenge.<br />
It is difficult making my way<br />
to classes because the classrooms<br />
are often not accessible<br />
to wheelchair users. There are<br />
long flights of stairs, and when<br />
I finally manage to get to a<br />
class, I am tired and frustrated<br />
and find it hard to focus on<br />
the lectures. But I am trying<br />
because I know it is better to<br />
try and fail than to fail to try.<br />
The challenges begin long<br />
before reaching higher education.<br />
<strong>Children</strong> <strong>with</strong> disabilities<br />
can easily become shut-ins,<br />
hidden away from society and<br />
unable to attend school or<br />
make a meaningful contribution<br />
to society. They should be<br />
encouraged to attend mainstream<br />
schools if possible,<br />
while special schools that<br />
include vocational training<br />
and support services should<br />
also be available. Specialneeds<br />
schools should offer a
I would like to be confident that when I graduate and look for a<br />
job, I will not be discriminated against because of my disability,<br />
but instead be recognized for my abilities, qualifications and<br />
potential.<br />
complete curriculum for students<br />
<strong>with</strong> disabilities, to help<br />
to develop their minds and give<br />
them opportunities to achieve<br />
academic excellence. Many<br />
children and young people <strong>with</strong><br />
disabilities want to go on to<br />
higher education, so it is very<br />
important that they be included<br />
in schools and other learning<br />
institutions and given the same<br />
options as other students in<br />
terms of choosing courses and<br />
activities. It is up to educational<br />
institutions and governments<br />
to accommodate and support<br />
students like me, so that we are<br />
able to pursue the education<br />
we need to achieve whatever<br />
goals we may have.<br />
Accommodating children and<br />
young people <strong>with</strong> disabilities<br />
includes things like adjusting<br />
the entry requirements and<br />
criteria for passing, and making<br />
sure that learning materials,<br />
examinations and class<br />
schedules take our needs into<br />
account. Teachers need to be<br />
properly trained and given a<br />
chance to pursue additional<br />
overseas instruction in order<br />
to improve the quality of education.<br />
Schools should teach<br />
Braille and other forms of communication<br />
where necessary,<br />
and there is also a great need<br />
for special equipment, which<br />
many schools in Guyana do<br />
not have. Making educational<br />
institutions disability-friendly<br />
also means setting up facilities<br />
and transportation services that<br />
persons <strong>with</strong> disabilities can<br />
use; there should be ramps for<br />
wheelchair users, accessible<br />
toilets and elevators for people<br />
who cannot take the stairs. All<br />
aspects and all levels of education,<br />
from elementary school<br />
to university, need to be made<br />
accessible.<br />
The ministries for education<br />
and public service should also<br />
work together to assist academically<br />
inclined students<br />
<strong>with</strong> disabilities who wish to<br />
go beyond secondary school.<br />
Because financial difficulties<br />
are a major reason why young<br />
people <strong>with</strong> disabilities are<br />
unable to continue their education,<br />
this assistance should<br />
include grants, loans and<br />
scholarships.<br />
Governments also need to<br />
make sure that education<br />
opens the same doors for students<br />
<strong>with</strong> disabilities as for<br />
everybody else. My parents<br />
have put in a lot of effort and<br />
more money than they can<br />
really afford to help me to get<br />
through school and to university<br />
– and now I am working<br />
hard, in spite of the challenges,<br />
to come to classes and learn,<br />
because I know that is what I<br />
need to do to get the best out<br />
of life. So I would also like to<br />
be confident that when I graduate<br />
and look for a job, I will<br />
not be discriminated against<br />
because of my disability, but<br />
instead be recognized for my<br />
abilities, qualifications and<br />
potential. As a young person<br />
<strong>with</strong> a disability who has<br />
worked hard to educate herself,<br />
I deserve as much as anyone<br />
else the opportunity to fulfill<br />
my dreams, make a good living<br />
for myself and contribute<br />
to our society.<br />
AN AGENDA FOR ACTION<br />
79
80<br />
(continued from p. 77)<br />
public and private infrastructure. When children<br />
interact and understand each other across levels<br />
of ability, they all benefit.<br />
The principles of universal design also apply to<br />
the development of inclusive school curricula and<br />
vocational training programmes as well as child<br />
protection laws, policies and services. <strong>Children</strong><br />
need access to systems designed to equip them<br />
<strong>with</strong> the educational and life skills to see them<br />
into and through their adult years, and those that<br />
protect them from neglect, abuse and violence<br />
on their way to adulthood. If protection fails, they<br />
need to be able to make complaints and seek justice.<br />
Governments have the decisive role to play<br />
in introducing and implementing the legislative,<br />
administrative and educational measures necessary<br />
to protect children <strong>with</strong> disabilities from all<br />
forms of exploitation, violence and abuse in all<br />
settings. It is not appropriate to create separate<br />
systems for children <strong>with</strong> disabilities – the goal<br />
must be inclusive, high-quality child protection<br />
mechanisms suitable for and accessible<br />
to all children. One such mechanism is birth<br />
THE STATE OF THE WORLD’S CHILDREN 2013: <strong>Children</strong> <strong>with</strong> <strong>Disabilities</strong><br />
registration. Although not a guarantee in itself,<br />
it is an essential element of protection. Efforts to<br />
register children <strong>with</strong> disabilities – and thereby<br />
render them visible – deserve priority.<br />
End institutionalization<br />
All too often, invisibility and abuse are the fate<br />
of children and adolescents <strong>with</strong> disabilities<br />
who are confined to institutions. Facilities are<br />
poor substitutes for a nurturing home life even if<br />
they are well run, responsive to children’s needs<br />
and subject to inspection. Immediate measures<br />
to reduce overreliance on institutions could<br />
include a moratorium on new admissions. This<br />
should be accompanied by the promotion of<br />
and increased support for family-based care and<br />
community-based rehabilitation. Additionally,<br />
there is a need for broader measures that reduce<br />
the pressure for children to be sent away in<br />
the first place. These include the development<br />
of public services, schools and health systems<br />
accessible and responsive to children <strong>with</strong> disabilities<br />
and their families.<br />
<strong>Children</strong> <strong>with</strong> hearing and visual impairments learn the craft of pottery at an orphanage in Moscow Oblast, Russian<br />
Federation. © UNICEF/RUSS/2011/Kochineva
Support families<br />
The CRC states that children should grow up in<br />
a family environment. It follows that the families<br />
of children and adolescents <strong>with</strong> disabilities must<br />
be adequately supported to provide the best<br />
possible environment and quality of life for their<br />
children. Support for families and caregivers –<br />
subsidized day care, for example, or by grants to<br />
offset the increased costs and reduced income<br />
that come <strong>with</strong> caring for a child <strong>with</strong> a disability<br />
– can prove critical in reducing the pressure to<br />
admit children <strong>with</strong> disabilities to institutions in<br />
the first place. Such support can also improve the<br />
prospects for children who return to the community<br />
after living in an institution.<br />
Disability in the family is often associated <strong>with</strong><br />
higher costs of living and lost opportunities to<br />
earn income, and thus may increase the risk of<br />
becoming or remaining poor. <strong>Children</strong> <strong>with</strong> disabilities<br />
who live in poverty can find it especially<br />
difficult to obtain such services as rehabilitation<br />
and assistive technology. To leave them and their<br />
families to fend for themselves would be to dangle<br />
the promise of inclusion just beyond their reach.<br />
Social policies should take into account the monetary<br />
and time costs associated <strong>with</strong> disability.<br />
These costs can be offset <strong>with</strong> social grants,<br />
subsidies for transportation or funding for personal<br />
assistants or respite care. Cash benefits are<br />
easier to administer and more flexible at meeting<br />
the particular needs of children <strong>with</strong> disabilities<br />
and their families. They also respect the decisionmaking<br />
rights of parents and children. Where<br />
cash transfer programmes for families living in<br />
difficult circumstances already exist, they can be<br />
adapted so that the families of children <strong>with</strong> disabilities<br />
are not unintentionally left out or offered<br />
inadequate support. These recommendations<br />
would be urgent under any circumstances but<br />
are especially so in these straitened times: Aid<br />
and social budgets are being cut, unemployment<br />
remains high, goods and services grow increasingly<br />
expensive. Families around the world face<br />
an increased risk of poverty.<br />
Move beyond minimum standards<br />
Existing supports and services should be continuously<br />
assessed <strong>with</strong> a view to achieving the<br />
best possible quality. The aim must be to move<br />
beyond minimum standards. Attention needs to<br />
be focused on serving the individual child <strong>with</strong><br />
a disability as well as on transforming entire<br />
systems or societies. The ongoing involvement<br />
of children <strong>with</strong> disabilities and their families<br />
in evaluating services will help to guarantee<br />
adequate and appropriate provision as children<br />
grow and their needs change. The importance of<br />
this participation cannot be overstated. <strong>Children</strong><br />
and young people <strong>with</strong> disabilities are among<br />
the most authoritative sources of information<br />
on what they need and whether their needs are<br />
being met.<br />
Coordinate services to support<br />
the child<br />
Because the effects of disability cut across sectors,<br />
services can be coordinated to take into<br />
account the full range of challenges confronting<br />
children <strong>with</strong> disabilities and their families.<br />
A coordinated programme of early intervention<br />
across the health, education and welfare sectors<br />
would help to promote the early identification<br />
and management of childhood disabilities.<br />
Across all sectors, early childhood interventions<br />
should be strengthened. Studies have shown that<br />
gains in functional capacity can be largest when<br />
interventions occur early in a child’s development.<br />
When barriers are removed earlier in life,<br />
the compounding effect of the multiple barriers<br />
faced by children <strong>with</strong> disabilities is lessened.<br />
As children advance through their early years,<br />
their ability to function can be enhanced through<br />
rehabilitation. Improvements in ability will have<br />
greater impact if school systems are willing and<br />
able to accept them and meet their educational<br />
needs. Moreover, acquiring an education would<br />
be more meaningful if there were also inclusive<br />
school-to-work transition programmes and<br />
economy-wide efforts to promote the employment<br />
of people <strong>with</strong> disabilities.<br />
(continued on p. 84)<br />
AN AGENDA FOR ACTION<br />
81
82<br />
PERSPECTIVE<br />
End the ‘book famine’ <strong>with</strong> better<br />
technology, attitudes and copyright law<br />
By Kartik Sawhney<br />
Kartik Sawhney is a nationalaward-winning<br />
high school student<br />
in New Delhi, India. He is active<br />
in advocating for the rights of<br />
persons <strong>with</strong> disabilities and is a<br />
member of the Leonard Cheshire<br />
Disability Young Voices network.<br />
Visually impaired people<br />
face what at least one writer<br />
has called a ‘book famine’.<br />
This is not news to us: The<br />
visually challenged and printimpaired<br />
have been struggling<br />
for accessibility for a<br />
long time. ‘Accessibility’ is an<br />
all-encompassing term that<br />
includes access to the physical<br />
environment, transportation,<br />
information and communication<br />
technology, education and<br />
other facilities. In my view, it<br />
is crucial that accessible material<br />
be readily available. The<br />
urgency is even greater when<br />
we consider the situation in<br />
developing nations.<br />
When I conducted an informal<br />
survey of nearly 60 visually<br />
challenged students in primary<br />
and secondary grades in<br />
mainstream schools in India,<br />
I found that less than 20 per<br />
cent of them had access to<br />
material in their preferred<br />
format, and less than 35 per<br />
cent to material in any format.<br />
Being visually challenged, I’ve<br />
had several experiences where<br />
lack of accessibility has impeded<br />
me from availing myself<br />
of the same opportunities as<br />
others. The effort needed to<br />
make reading material acces-<br />
THE STATE OF THE WORLD’S CHILDREN 2013: <strong>Children</strong> <strong>with</strong> <strong>Disabilities</strong><br />
sible is monumental. Thanks<br />
to advances in optical character<br />
recognition (OCR) – a technology<br />
that converts printed,<br />
handwritten or typewritten text<br />
into machine-encoded text,<br />
making it possible for computerized<br />
voices to read the text<br />
aloud – there has been some<br />
improvement. However, technical<br />
content remains inaccessible.<br />
I spend around two hours<br />
a day typing out the printed<br />
material from my science and<br />
math classes, for example,<br />
because OCR software cannot<br />
read diagrams and special symbols<br />
<strong>with</strong> sufficient accuracy.<br />
The plight of rural students is<br />
even worse: They depend on<br />
humans to read volumes of<br />
information aloud to them. For<br />
instance, my friends in a small<br />
village have no option but to<br />
rely completely on volunteers<br />
who come by weekly.<br />
Even much online content cannot<br />
be read by standard screen<br />
reading utilities, primarily as a<br />
result of the varying standards<br />
and platforms used by authors<br />
and designers. Although the<br />
World Wide Web Consortium<br />
(W3C) has produced guidelines<br />
for websites to follow in<br />
order to ensure a wonderful
Being visually challenged, I’ve had several experiences where<br />
lack of accessibility has impeded me from availing myself of<br />
the same opportunities as others.<br />
experience for all, this vision<br />
is far from achieved. I come<br />
across websites daily that are<br />
not W3C-standard compliant.<br />
This calls for greater scrutiny<br />
by not only governments, but<br />
also civil society, academia and<br />
international organizations. The<br />
Government of India has taken<br />
steps to bring about a positive<br />
change on this front; it now<br />
offers a National Award for the<br />
Empowerment of Persons <strong>with</strong><br />
<strong>Disabilities</strong> in the category of<br />
‘Best Accessible Website’. This<br />
incentive drives organizations<br />
to make their websites accessible.<br />
If applied by enough<br />
countries, such measures<br />
could usher in a revolution.<br />
This is not just a matter for<br />
governments: Anyone can<br />
make a positive difference.<br />
I recall a historic achievement<br />
made in 2011 by a group of<br />
visually challenged youth in<br />
Bangalore, India. Preparing for<br />
the entrance exams to prestigious<br />
business schools in the<br />
country, they contacted the<br />
well-known educational publisher<br />
Pearson Education and<br />
requested that they publish<br />
their material in an accessible<br />
format. Pearson agreed and<br />
has since then made much of<br />
their material available for the<br />
visually challenged. However,<br />
not all publishers are as sensitive<br />
and understanding. Lack of<br />
awareness and insensitivity are<br />
two of the biggest challenges.<br />
Unless – until – there is a paradigm<br />
shift in attitudes towards<br />
people who are visually challenged,<br />
it will be difficult to<br />
overcome the challenges that<br />
plague the print-impaired<br />
community today.<br />
But there is another barrier to<br />
access – a political and legal,<br />
not technical or attitudinal, one.<br />
Currently, only 57 countries<br />
have amended their copyright<br />
laws to provide concessions<br />
for people <strong>with</strong> visual impairments.<br />
Thus, providing e-books<br />
for the visually challenged is<br />
unfortunately still considered<br />
an infringement of copyright<br />
in many countries – and this<br />
prevents local publishers from<br />
helping out <strong>with</strong>in the community.<br />
For a young student, these<br />
facts are extremely disturbing:<br />
Since most countries have<br />
pledged to provide maximum<br />
support and cooperation for the<br />
welfare and empowerment of<br />
persons <strong>with</strong> disabilities, there<br />
turns out to be a vast difference<br />
between the laws on paper and<br />
actual, real-world implementation.<br />
The need of the hour is to<br />
translate words into action.<br />
I suggest an international body<br />
to oversee implementation of<br />
international disability legislation,<br />
to the extent that it does<br />
not violate national sovereignty.<br />
Copyright law must be<br />
amended. I hope that countries<br />
will continue to work on the<br />
legal framework, and that the<br />
United Nations will take action<br />
towards a referendum on this<br />
issue. With concerted effort,<br />
I believe we will secure this<br />
inalienable right for all people<br />
<strong>with</strong> disabilities, everywhere:<br />
the right to access all material!<br />
AN AGENDA FOR ACTION<br />
83
84<br />
(continued from p. 81)<br />
Involve children <strong>with</strong> disabilities in<br />
making decisions<br />
<strong>Children</strong> and adolescents <strong>with</strong> disabilities belong<br />
at the centre of efforts to build inclusive societies<br />
– not just as beneficiaries, but as agents of<br />
change. States parties to the CRPD have affirmed<br />
the right of children <strong>with</strong> disabilities to express<br />
their views freely on all matters affecting them. In<br />
so doing, governments have reaffirmed the principles<br />
of the CRC and have obligated themselves<br />
to consult children <strong>with</strong> disabilities when developing<br />
and implementing legislation and policies<br />
that concern them. This is in States’ interest, for<br />
children and young people <strong>with</strong> disabilities can<br />
enrich policymaking and service provision <strong>with</strong><br />
their daily experiences and are uniquely qualified<br />
to provide information on whether their needs<br />
are being met and their contributions utilized<br />
across the full spectrum of issues and interventions:<br />
from health and nutrition to sexual and<br />
reproductive health, education and services for<br />
the transition to adulthood.<br />
THE STATE OF THE WORLD’S CHILDREN 2013: <strong>Children</strong> <strong>with</strong> <strong>Disabilities</strong><br />
The right to be heard applies to all children,<br />
regardless of type or degree of disability, and<br />
even children <strong>with</strong> profound disabilities can be<br />
supported to express their choices and desires.<br />
A child who is able to express herself or himself<br />
is a child who is much less likely to be abused<br />
or exploited. Conversely, abuse and exploitation<br />
thrive where children lack the means to challenge<br />
their oppression. Participation is especially<br />
important for such marginalized groups as<br />
children who live in institutions.<br />
To recognize that children and adolescents <strong>with</strong><br />
disabilities are the holders of rights, not the recipients<br />
of charity, is not to eliminate the need for<br />
appropriate rehabilitation, medical treatment or<br />
aids and appliances. It does mean, however, that<br />
children’s rights, perspectives and choices must<br />
be respected. In turn, this will entail decision-makers<br />
communicating in ways and by means that<br />
are easily accessed and used by children <strong>with</strong> disabilities,<br />
so their views can be incorporated in the<br />
<strong>Children</strong> play netball at Ojwina Primary School in Lira, Uganda. © UNICEF/UGDA2012-00120/Sibiloni
Six-year-old Nemanja (far left) sits <strong>with</strong> classmates in Novi Sad, Serbia. His primary school was the first to integrate<br />
children <strong>with</strong> disabilities under a law aimed at reducing institutionalization. © UNICEF/HQ2011-1156/Holt<br />
design, implementation and evaluation of policies<br />
and services.<br />
Global promise, local test<br />
In order to fulfil the promises of the CRPD and<br />
CRC, international agencies and donors and their<br />
national and local partners can include children<br />
<strong>with</strong> disabilities in the objectives, targets and<br />
monitoring indicators of all development programmes.<br />
Reliable and objective data are important<br />
to assist in planning and resource allocation,<br />
and to place children <strong>with</strong> disabilities more clearly<br />
on the development agenda. The necessary statistical<br />
work will take time but would be given vital<br />
impetus were international donors to promote a<br />
concerted global research agenda on disability. In<br />
the meanwhile, planning and programming will<br />
have to continue; denying or delaying services to<br />
children <strong>with</strong> disabilities because more data are<br />
needed would be unacceptable. Rather, plans,<br />
programmes and budgets can be designed to<br />
allow for modifications as additional information<br />
is made available.<br />
The ultimate proof of all global and national<br />
efforts will be local, the test being whether every<br />
child <strong>with</strong> a disability enjoys her or his rights –<br />
including access to services, support and opportunities<br />
– on a par <strong>with</strong> other children, even<br />
in the most remote settings and the most<br />
deprived circumstances.<br />
AN AGENDA FOR ACTION<br />
85
86<br />
PERSPECTIVE<br />
<strong>Children</strong> <strong>with</strong> disabilities and<br />
universal human rights<br />
By Lenín Voltaire Moreno Garcés<br />
Lenín Voltaire Moreno Garcés,<br />
Vice-President of the Republic of<br />
Ecuador from 2007 until May 2013,<br />
was Latin America’s only holder<br />
of high office <strong>with</strong> a physical<br />
disability. The statistics in this<br />
essay were drawn from national<br />
programme documents.<br />
There can be no such thing<br />
as the universal exercise of<br />
human rights unless these<br />
rights are enjoyed by all people<br />
– including the most vulnerable.<br />
Spurred by this conviction,<br />
the Office of the Vice-President<br />
of the Republic of Ecuador has<br />
focused on ascertaining and<br />
improving the situation of people<br />
<strong>with</strong> disabilities – starting<br />
<strong>with</strong> children.<br />
Beginning in July 2009, we<br />
conducted surveys throughout<br />
Ecuador under a project<br />
known as the Manuela Espejo<br />
Solidarity Mission. By visiting<br />
1,286,331 households in the<br />
country’s 24 provinces and 221<br />
cantons, we were able to identify<br />
293,743 persons <strong>with</strong> disabilities.<br />
Of this total, some 24<br />
per cent had intellectual disabilities<br />
and the remaining 76 per<br />
cent had physical or sensory<br />
disabilities. We estimated the<br />
prevalence of major disabilities<br />
at over 2 per cent of the national<br />
population, as measured by<br />
the 2010 census.<br />
We found that about 55,000<br />
boys and girls under 18 years<br />
of age had disabilities, accounting<br />
for about 19 per cent of<br />
all persons <strong>with</strong> disabilities in<br />
Ecuador. As of June 2012, these<br />
children had received 87,629<br />
THE STATE OF THE WORLD’S CHILDREN 2013: <strong>Children</strong> <strong>with</strong> <strong>Disabilities</strong><br />
technical assistance donations<br />
consisting of such items<br />
as wheelchairs, walkers, antibedsore<br />
mattresses, walking<br />
sticks, hearing aids and visual<br />
kits, depending on the need<br />
or needs identified. Three new<br />
prosthetics shops were established<br />
and expected to deliver<br />
1,960 prosthetic and orthopaedic<br />
devices to the country’s<br />
children in 2012 alone.<br />
We also found that many families<br />
live in extremely difficult<br />
circumstances. The care of<br />
children <strong>with</strong> severe disabilities<br />
can be particularly expensive,<br />
forcing mothers to abandon<br />
them in order to earn money.<br />
So the Joaquín Gallegos Lara<br />
Subsidy was established and<br />
provides the equivalent of<br />
US$240 per month in financial<br />
assistance to the primary caregiver<br />
of a child or adult <strong>with</strong> a<br />
disability. Training in first-aid<br />
services, hygiene and rehabilitation<br />
is also provided. Ecuador<br />
is thus recognizing, for the first<br />
time, the labour of love performed<br />
by families who care<br />
for persons <strong>with</strong> disabilities.<br />
As of June 2012, the subsidies<br />
had benefited 6,585 children,<br />
43 per cent of them girls.<br />
In addition to support, our<br />
approach attaches importance
We [in government] must understand that disability is not a<br />
problem but rather a circumstance. . . . [We must] assist our<br />
youngest citizens in entering the mainstream.<br />
to early detection and intervention.<br />
By 2012, some 1.1 million<br />
children under age 9 had been<br />
screened to detect hearing<br />
impairments and promote early<br />
intervention. To this end, 1,401<br />
diagnostic and aural screening<br />
service units were set up<br />
in the Ministry of Public Health<br />
network; 1,500 health professionals<br />
were trained; 30 speech<br />
therapy service units were<br />
established; and 1,508 hearing<br />
aids were provided.<br />
In 2013, 714,000 children will<br />
have been screened at 24<br />
impaired-sight service centres<br />
and we expect that some 2,500<br />
children will receive aids to<br />
help them improve their vision<br />
or function <strong>with</strong> blindness.<br />
We have also set up a national<br />
programme to screen newborns<br />
for congenital conditions<br />
that can be treated. By<br />
December 2011, this effort,<br />
known as ‘Right Foot Forward:<br />
The Footprint of the Future’,<br />
had screened 98,034 newborns<br />
and found 30 cases of congenital<br />
hypothyroidism, galactosaemia,<br />
congenital adrenal<br />
hyperplasia or phenylketonuria.<br />
Each of these 30 girls and boys<br />
has received treatment for<br />
conditions that, if left untreated<br />
in the first few weeks or<br />
months of life, place children at<br />
increased risk of low cognition,<br />
speech impairment and tremors,<br />
among other impairments.<br />
Beyond bio-social support and<br />
early intervention, we are pursuing<br />
social and cultural inclusion.<br />
Under the banner of ‘An<br />
Ecuador of Joy and Solidarity’,<br />
70,000 children and young people<br />
<strong>with</strong> and <strong>with</strong>out disabilities<br />
have participated in inclusive<br />
fairs held throughout the country.<br />
Play and games are being<br />
promoted as means of creating<br />
space for integration. At these<br />
fairs, persons <strong>with</strong> disabilities<br />
take the lead as instructors<br />
in physical exercise, arts and<br />
crafts, games and storytelling.<br />
Some 7,700 marginalized or<br />
vulnerable children and young<br />
people are advancing their personal<br />
development, self-esteem<br />
and social integration through<br />
such pursuits as dance, music,<br />
painting and literature. They<br />
include 1,100 children and<br />
young people who are involved<br />
in the Social Circus, an initiative<br />
run in collaboration <strong>with</strong><br />
the Canadian entertainment<br />
company Cirque du Soleil.<br />
These innovations have awakened<br />
interest among Ecuador’s<br />
neighbours, a number of whom<br />
are seeking to learn more about<br />
our experience. The first thing<br />
to note is that there is no time<br />
to lose. No child should have to<br />
wait for the services and supports<br />
that are rightfully hers or<br />
his, but this is especially the<br />
case for children <strong>with</strong> disabilities,<br />
because their vulnerability<br />
can increase <strong>with</strong> age.<br />
We in government must tackle<br />
the tasks at hand <strong>with</strong>out<br />
delay. We must understand<br />
that disability is not a problem<br />
but rather a circumstance. It<br />
is up to us, regardless of the<br />
place or the role we have<br />
to play, to assist our youngest<br />
citizens in entering the<br />
mainstream. We cannot even<br />
dream of a country <strong>with</strong> social<br />
justice, one that abides by<br />
the principles of good living,<br />
unless we guarantee that<br />
persons <strong>with</strong> disabilities,<br />
especially children and<br />
adolescents, can fully<br />
exercise their rights.<br />
Disability does not mean<br />
incapability: It is the wonderful<br />
diversity that enriches<br />
humankind.<br />
AN AGENDA FOR ACTION<br />
87
88<br />
REFERENCES<br />
Chapter 1 Introduction<br />
1 World Health Organization, ‘Communitybased<br />
Rehabilitation Guidelines’, WHO,<br />
Geneva, 2010, , accessed<br />
31 January 2013.<br />
2 Groce, Nora Ellen, ‘Adolescents and Youth<br />
<strong>with</strong> <strong>Disabilities</strong>: Issues and challenges’,<br />
Asia Pacific Disability Rehabilitation<br />
Journal, vol. 15, no. 2, July 2004,<br />
pp. 13–32.<br />
3 Committee on the Rights of the Child,<br />
Convention on the Rights of the Child<br />
General Comment No. 9 (2006): The rights<br />
of children <strong>with</strong> disabilities, CRC/C/GC/9,<br />
Geneva, 27 February 2007, pp. 2, 9; Jones,<br />
Lisa, et al., ‘Prevalence and Risk of Violence<br />
against <strong>Children</strong> <strong>with</strong> <strong>Disabilities</strong>: A systematic<br />
review and meta-analysis of observational<br />
studies’, The Lancet, vol. 380,<br />
no. 9845, 8 September 2012, pp. 899–907;<br />
World Health Organization and the World<br />
Bank, World Report on Disability, WHO,<br />
Geneva, 2011, p. 59.<br />
BOX: On the numbers<br />
World Health Organization, The Global Burden<br />
of Disease: 2004 update, WHO, Geneva, 2008;<br />
United Nations, Department of Economic and<br />
Social Affairs, Population Division, World<br />
Population Prospects: The 2010 revision,<br />
United Nations, New York, 2011.<br />
Chapter 2 Fundamentals of inclusion<br />
4 Bruce Marks, Susan, ‘Reducing Prejudice<br />
against <strong>Children</strong> <strong>with</strong> <strong>Disabilities</strong> in<br />
Inclusive Settings’, International Journal<br />
of Disability, Development and Education,<br />
vol. 44, no. 2, 1997, pp. 119–120.<br />
5 Contact a Family, ‘What Makes My Family<br />
Stronger: A report into what makes<br />
families <strong>with</strong> disabled children stronger<br />
– socially, emotionally and practically’,<br />
London, May 2009, , accessed 31 January 2013.<br />
6 United Kingdom Government, ‘The<br />
Consolidated 3rd and 4th Periodic Report<br />
to UN Committee on the Rights of the<br />
Child’, United Kingdom, July 2007, p. 31,<br />
,<br />
accessed 31 January 2013.<br />
7 D’Aiglepierre, Rohen, Focus Development<br />
Association and United Nations<br />
<strong>Children</strong>’s Fund, ‘Exclusion Scolaire et<br />
Moyens D’Inclusion au Cycle Primaire a<br />
Madagascar’, February 2012, p. 67,<br />
,<br />
accessed 31 January 2013.<br />
8 TNS and United Nations <strong>Children</strong>’s<br />
Fund, ‘Research Report on <strong>Children</strong> <strong>with</strong><br />
<strong>Disabilities</strong> and their Families in Da Nang:<br />
Knowledge – attitudes – practices’,<br />
Viet Nam, November 2009, p. 14.<br />
9 World Health Organization and the World<br />
Bank, World Report on Disability, 2011, p. 3.<br />
10 Maras, Pam, and Rupert Brown, ‘Effects of<br />
Contact on <strong>Children</strong>’s Attitudes Towards<br />
Disability: A longitudinal study’, Journal<br />
of Applied Social Psychology, vol. 26, no.<br />
23, December 1996, pp. 2113–2134, cited<br />
in Maras, Pam, and Rupert Brown, ‘Effects<br />
of Different Forms of School Contact on<br />
<strong>Children</strong>’s Attitudes toward Disabled and<br />
Non-Disabled Peers’, British Journal of<br />
Educational Psychology, vol. 70, no. 3,<br />
September 2000, p. 339.<br />
11 Barg, Carolyn J., et al., ‘Physical Disability,<br />
Stigma, and Physical Activity in <strong>Children</strong>’,<br />
International Journal of Disability,<br />
Development and Education, vol. 57, no. 4,<br />
December 2010, p. 378.<br />
12 International Disability in Sport Working<br />
Group and the United Nations Office of the<br />
Special Advisor to the Secretary-General on<br />
Sport for Development and Peace, ‘Sport<br />
in the United Nations Convention on the<br />
Rights of Persons <strong>with</strong> <strong>Disabilities</strong>’, IDSWG,<br />
Northeastern University, Boston, 2007.<br />
13 Convention on the Rights of Persons <strong>with</strong><br />
<strong>Disabilities</strong> (CRPD) Preamble.<br />
14 World Health Organization and the World<br />
Bank, World Report on Disability, 2011,<br />
p. 43.<br />
15 Mont, Daniel M., and Nguyen Viet Cuong,<br />
‘Disability and Poverty in Vietnam’, World<br />
Bank Economic Review, vol. 25, no. 2,<br />
2011, pp. 323–359.<br />
16 Buckup, Sebastian, ‘The Price of Exclusion:<br />
The economic consequences of excluding<br />
people <strong>with</strong> disabilities from the world<br />
of work’, International Labour Office<br />
Employment Working Paper No. 43,<br />
International Labour Organization,<br />
Geneva, 2009.<br />
17 Mitra, Sophie, Aleksandra Posarac and<br />
Brandon Vick, ‘Disability and Poverty in<br />
Developing Countries: A snapshot from<br />
the World Health Survey’, Social Protection<br />
Discussion Paper No. 1109, The World<br />
Bank, Washington, D.C., April 2011.<br />
18 Groce, Nora, et al., ‘Disability and Poverty:<br />
The need for a more nuanced understanding<br />
of implications for development policy<br />
and practice’, Third World Quarterly,<br />
vol. 32, no. 8, 2011, pp. 1493–1513.<br />
19 Loeb, M. E., and Arne H. Eide, eds.,<br />
‘Living Conditions among People <strong>with</strong><br />
Activity Limitations in Malawi: A national<br />
representa tive study’, SINTEF Health<br />
Research, Oslo, 26 August 2004,<br />
, accessed<br />
31 January 2013; Hoogeveen, Johannes<br />
G., ‘Measuring Welfare for Small but<br />
Vulnerable Groups: Poverty and disability<br />
in Uganda’, Journal of African Economies,<br />
vol. 14, no. 4, 1 August 2005, pp. 603–631.<br />
20 World Health Organization and the World<br />
Bank, World Report on Disability, 2011,<br />
pp. 10, 39–40.<br />
21 Gertler, Paul J., and Lia C. Fernald, ‘The<br />
Medium Term Impact of Oportunidades on<br />
Child Development in Rural Areas’, Instituto<br />
Nacional de Salud Pública, Cuernavaca,<br />
Mexico, 30 November 2004; Behrman,<br />
Jere R., and John Hoddinott, ‘Programme<br />
Evaluation <strong>with</strong> Unobserved Heterogeneity<br />
and Selective Implementation: The Mexican<br />
PROGRESA impact on child nutrition’,<br />
Oxford Bulletin of Economics and Statistics,<br />
vol. 67, no. 4, August 2005, pp. 547–569;<br />
Hoddinott, John, and Emmanuel Skoufias,<br />
‘The Impact of PROGRESA on Food<br />
Consumption’, Economic Development<br />
and Cultural Change, vol. 53, no. 1,<br />
October 2004, pp. 37–61; Maluccio, John<br />
A., et al., ‘The Impact of an Experimental<br />
Nutritional Intervention in Childhood on<br />
Education among Guatemalan Adults’,<br />
Food Consumption and Nutrition Division<br />
Discussion Paper 207, International Food<br />
Policy Research Institute, Washington, D.C.,<br />
June 2006.<br />
22 Groce, Nora, et al., ‘Poverty and Disability:<br />
A critical review of the literature in low and<br />
middle-income countries’, Working Paper<br />
Series No. 16, Leonard Cheshire Disability<br />
and Inclusive Development Centre,<br />
University College London, London,<br />
September 2011.<br />
23 Office of the United Nations High<br />
Commissioner for Human Rights,<br />
Convention on the Rights of the Child,<br />
article 23.<br />
THE STATE OF THE WORLD’S CHILDREN 2013: <strong>Children</strong> <strong>with</strong> <strong>Disabilities</strong><br />
24 World Health Organization, ‘Community-<br />
Based Rehabilitation’, WHO, Geneva,<br />
,<br />
accessed 31 January 2013.<br />
25 Allen-Leigh, Betania, et al., Iniciativa<br />
Evaluation: Evaluación externa de diseño<br />
y resultados del proyecto piloto<br />
‘Atención Integral a Niños y Niñas con<br />
Discapacidad en Comunidades Rurales<br />
en Oaxaca’, Instituto Nacional de Salud<br />
Pública, Cuernavaca, Mexico, 2010, as<br />
cited in Secretariat for the Convention<br />
on the Rights of Persons <strong>with</strong> <strong>Disabilities</strong><br />
(SCRPD), ’Compilation of best practices<br />
for including persons <strong>with</strong> disabilities<br />
in all aspects of development efforts’,<br />
Working document in response to General<br />
Assembly Resolution A/65/186 and <strong>with</strong><br />
the intention of facilitating the discussions<br />
leading up to the envisaged High Level<br />
Meeting on disability and development at<br />
the 67th session of the General Assembly<br />
in 2012.<br />
26 Municipalities of Santa Maria Guienagati,<br />
San Martín Peras, Coicoyan de las Flores<br />
and San José Tanago.<br />
27 Allen-Leigh, Betania, et al., Iniciativa<br />
Evaluation: Evaluación externa de diseño<br />
y resultados del proyecto piloto ‘Atención<br />
Integral a Niños y Niñas con Discapacidad<br />
en Comunidades Rurales en Oaxaca’, 2010.<br />
28 World Health Organization, ‘Assistive<br />
Devices/Technologies: What WHO is doing’,<br />
WHO, Geneva, , accessed<br />
31 January 2013.<br />
29 Borg, Johan, Anna Lindström and<br />
Stig Larsson,‘Assistive Technology in<br />
Developing Countries: National and international<br />
responsibilities to implement the<br />
Convention on the Rights of Persons <strong>with</strong><br />
<strong>Disabilities</strong>’, The Lancet, vol. 374, no. 9704,<br />
28 November 2009, pp. 1863–1865.<br />
30 François, Isabelle, et al., ‘Causes of<br />
Locomotor Disability and Need for<br />
Orthopaedic Devices in a Heavily<br />
Mined Taliban-Controlled Province of<br />
Afghanistan: Issues and challenges for<br />
public health managers’, Tropical Medicine<br />
& International Health, vol. 3, no. 5, May<br />
1998, pp. 391–396; Matsen, S. L., ‘A Closer<br />
Look at Amputees in Vietnam: A field<br />
survey of Vietnamese using prostheses’,<br />
Prosthetics and Orthotics International,<br />
vol. 23, no. 2, August 1999, pp. 93–101;<br />
May-Teerink, Teresa Lynn, ‘A Survey of<br />
Rehabilitative Services and People Coping<br />
<strong>with</strong> Physical <strong>Disabilities</strong> in Uganda, East<br />
Africa’, pp. 311–316; Bigelow, Jeffrey,<br />
et al., ‘A Picture of Amputees and the<br />
Prosthetic Situation in Haiti’, Disability<br />
& Rehabilitation, vol. 26, no. 4, 2004,<br />
pp. 246–252; Lindsay, Sally, and Irina<br />
Tsybina, ‘Predictors of Unmet Needs for<br />
Communication and Mobility Assistive<br />
Devices among Youth <strong>with</strong> a Disability: The<br />
role of socio-cultural factors’, Disability and<br />
Rehabilitation: Assistive Technology, vol. 6,<br />
no. 1, January 2011, pp. 10–21.<br />
31 Steinfeld, Edward, ‘Education for All: The<br />
cost of accessibility’, Education Notes, The<br />
World Bank, Washington, D.C., August<br />
2005, , accessed<br />
31 January 2013<br />
32 Based on evaluations by the Department<br />
of Public Works in South Africa, Accessible<br />
Design Case Studies, 2004, in Metts,<br />
Robert, ‘Disability and Development’,<br />
Background paper prepared for the disability<br />
and development research agenda<br />
meeting, 16 November 2004, The World<br />
Bank, Washington, D.C., pp. 15–45.
33 South African Disability Institute, Special<br />
Housing for Disabled People, data provided<br />
by Philip Thompson, Africa Chair,<br />
International Commission on Technology<br />
and Accessibility, as cited in Metts, Robert,<br />
‘Disability and Development’, p. 17; Metts,<br />
Robert, ‘Disability and Development’,<br />
pp. 15–45.<br />
BOX: It’s about ability<br />
United Nations <strong>Children</strong>’s Fund Montenegro,<br />
‘“It’s about Ability” Campaign Honoured for<br />
the Best Humanitarian Action in Montenegro’,<br />
UNICEF Montenegro, Podgorica, Montenegro,<br />
15 February 2011, , accessed 31 January 2013.<br />
Perovic, Jelena, ‘Survey: It’s about ability<br />
campaign results in positive change for children<br />
<strong>with</strong> disability in Montenegro’, UNICEF<br />
Montenegro, Podgorica, Montenegro, 14<br />
December 2011, ,<br />
accessed 31 January<br />
2013.<br />
Chapter 3 A strong foundation<br />
34 World Health Organization, ‘Fact Sheet:<br />
Poliomyelitis’, WHO, Geneva, 2011; Polio<br />
News, Global Polio Eradication Initiative,<br />
January 2013.<br />
35 World Health Organization, ‘Global<br />
Immunization Data’, WHO, Geneva,<br />
October 2012.<br />
36 United Nations Department of Economic<br />
and Social Affairs, ‘Disability and the<br />
Millennium Development Goals: A review<br />
of the MDG process and strategies for<br />
inclusion of disability issues in Millennium<br />
Development Goal efforts’, United Nations,<br />
New York, December 2011.<br />
37 World Health Organization and the World<br />
Bank, World Report on Disability, 2011,<br />
pp. 58–60.<br />
38 Gakidou, Emmanuela, et al., ‘Improving<br />
Child Survival through Environmental and<br />
Nutritional Interventions: The importance<br />
of targeting interventions toward the<br />
poor’, Journal of the American Medical<br />
Association, vol. 298, no. 16, October 2007,<br />
pp. 1876–1887.<br />
39 World Health Organization, Nutrition for<br />
Health and Development: A global agenda<br />
for combating malnutrition – Progress<br />
report, WHO, Geneva, 2000, pp. 14–15.<br />
40 World Health Organization, ‘Micronutrient<br />
deficiencies: Iodine deficiency disorders’,<br />
WHO, Geneva, 2012, , accessed<br />
31 January 2013<br />
41 Checkley William, et al., ‘Multi-Country<br />
Analysis of the Effects of Diarrhoea on<br />
Childhood Stunting’, International Journal<br />
of Epidemiology, vol. 37, no. 4, August<br />
2008, pp. 816–830.<br />
42 Walker, Susan P., et al., ‘Inequality in Early<br />
Childhood: Risk and protective factors<br />
for early child development’, The Lancet,<br />
vol. 378, no. 9799, 8 October 2011,<br />
pp. 1325–1338.<br />
43 United Nations <strong>Children</strong>’s Fund, Tracking<br />
Progress on Child and Maternal Nutrition:<br />
A survival and development priority’,<br />
UNICEF, New York, November 2009, p. 16.<br />
44 Walker, Susan P., et al., ‘Inequality in Early<br />
Childhood: Risk and protective factors for<br />
early child development’, pp. 1325–1338.<br />
45 World Health Organization, ‘Medical<br />
Devices: Anaemia prevention and control’,<br />
WHO, Geneva, 2012, , accessed 31 January 2013.<br />
46 Scholl, Theresa O., ‘Maternal Iron Status:<br />
Relation to fetal growth, length of gestation,<br />
and iron endowment of the neonate’,<br />
Nutrition Reviews, vol. 69, no. 11,<br />
November 2011, S23–S29; Vaughan, Owen<br />
R., et al., ‘Environmental Regulation of<br />
Placental Phenotype: Implications for<br />
fetal growth’, Reproduction, Fertility and<br />
Development, vol. 24, no. 1, 6 December<br />
2011, pp. 80–96.<br />
47 Adams, Melanie S., et al., ‘Feeding<br />
Difficulties in <strong>Children</strong> <strong>with</strong> Cerebral Palsy:<br />
Low-cost caregiver training in Dhaka,<br />
Bangladesh’, Child: Care, Health and<br />
Development, vol. 38, no. 6, November<br />
2012, pp. 878–888.<br />
48 National Institutes for Health (NIH),<br />
MedlinePlus, ‘Cystic Fibrosis – Nutritional<br />
Considerations’, ,<br />
accessed 31 January 2013; O’Brien, S., et<br />
al., ‘Intestinal Bile Acid Malabsorption in<br />
Cystic Fibrosis’, Gut, vol. 34, no. 8, August<br />
1993, pp. 1137–1141.<br />
49 United Nations <strong>Children</strong>’s Fund, ‘Violence<br />
against Disabled <strong>Children</strong>: UN Secretary-<br />
General’s report on violence against children<br />
– Summary report’, UNICEF, New York,<br />
28 July 2005, pp. 6–7; World Bank, May<br />
2004, “Disability in Bangladesh: A situation<br />
analysis” The Danish Bilharziasis Laboratory<br />
for the World Bank, People’s Republic of<br />
Bangladesh ,<br />
p. 15, accessed 31 January 2013<br />
50 World Health Organization, Developmental<br />
Difficulties in Early Childhood: Prevention,<br />
early identification, assessment and<br />
intervention in low- and middle-income<br />
countries – A review, WHO, Geneva,<br />
2012; Thommessen, M., et al., ‘Feeding<br />
Problems, Height and Weight in<br />
Different Groups of Disabled <strong>Children</strong>’,<br />
ActaPaediatrica, vol. 80, no. 5, May 1991,<br />
pp. 527–533; Sullivan, Peter B., ed.,<br />
Feeding and Nutrition in <strong>Children</strong> <strong>with</strong><br />
Neurodevelopmental Disability, Mac Keith<br />
Press, London, 2009, p. 61; Adams, Melanie<br />
S., et al., ‘Feeding Difficulties in <strong>Children</strong><br />
<strong>with</strong> Cerebral Palsy’, pp. 878–888.<br />
51 Groce, N., et al., ‘Water and Sanitation<br />
Issues for Persons <strong>with</strong> <strong>Disabilities</strong> in Lowand<br />
Middle-Income Countries: A literature<br />
review and discussion of implications for<br />
global health and international development,’<br />
Journal of Water and Health, vol. 9,<br />
no. 4, 2011, pp. 617–627.<br />
52 Human Rights Watch, ‘Fact Sheet: HIV<br />
and disability’, Human Rights Watch,<br />
New York, June 2011. Also, see World<br />
Health Organization and the World Bank,<br />
World Report on Disability, 2011, p. 77 for<br />
misconceptions on sexual activity, p. 59<br />
for drug/alcohol use and p. 147 for risk<br />
of abuse.<br />
53 United Nations <strong>Children</strong>’s Fund, ‘Towards<br />
an AIDS-Free Generation: Promoting<br />
community-based strategies for and <strong>with</strong><br />
children and adolescents <strong>with</strong> disabilities’,<br />
UNICEF, July 2012.<br />
54 World Health Organization and United<br />
Nations Population Fund, Promoting<br />
Sexual and Reproductive Health for<br />
Persons <strong>with</strong> <strong>Disabilities</strong>: WHO/UNFPA<br />
guidance note, WHO, 2009, pp. 5–9, 12,<br />
, accessed 31 January 2013; United<br />
Nations Educational, Scientific and<br />
Cultural Organization, Sexuality Education<br />
in Asia and the Pacific: Review of policies<br />
and strategies to implement and<br />
scale up, UNESCO Bangkok, Bangkok,<br />
2012, p. 2, ,<br />
accessed 31 January 2013.<br />
55 Willemse, Karin, Ruth Morgan and John<br />
Meletse, ‘Deaf, Gay, HIV Positive, and<br />
Proud: Narrating an alternative identity in<br />
post-Apartheid South Africa’, Canadian<br />
Journal of African Studies, vol. 43, no. 1,<br />
April 2009, pp. 83–104.<br />
56 Sices, Laura, ‘Developmental Screening<br />
in Primary Care: The effectiveness of<br />
current practice and recommendations<br />
for improvement’, The Commonwealth<br />
Fund, New York, December 2007, pp. v<br />
and 6; Johnson-Staub, Christine, ‘Charting<br />
Progress for Babies in Child Care Project:<br />
Promote access to early, regular, and comprehensive<br />
screening’, CLASP, Washington,<br />
D.C., February 2012, p. 1.<br />
57 Ertem, Ilgi O., et al., ’A Guide for<br />
Monitoring Child Development in Low- and<br />
Middle-Income Countries’, Pediatrics, vol.<br />
121, no. 3, March 2008, pp. e581–e589;<br />
World Health Organization, Developmental<br />
Difficulties in Early Childhood: Prevention,<br />
Early Identification, Assessment and<br />
Intervention in low-and middle income<br />
countries, WHO 2012pp.1<br />
58 World Health Organization, ‘Epilepsy: Fact<br />
sheet No. 999’, WHO, Geneva, October<br />
2012, , accessed<br />
31 January 2013.<br />
59 Metts, Robert, ‘Disability and<br />
Development’, pp. 15–45.<br />
60 Filmer, Deon, ‘Disability, Poverty, and<br />
Schooling in Developing Countries: Results<br />
from 14 household surveys’, World Bank<br />
Economic Review, vol. 22, no. 1, 2008,<br />
pp. 141–163, as cited in World Health<br />
Organization and the World Bank, World<br />
Report on Disability, 2011.<br />
61 United Nations Educational, Scientific<br />
and Cultural Organization, EFA Global<br />
Monitoring Report 2010: Reaching the<br />
marginalized, UNESCO and Oxford<br />
University Press, Paris and Oxford,<br />
UK, 2010, ,<br />
accessed 31 January 2013; Loeb, M. E.,<br />
and Arne H. Eide, eds., ‘Living Conditions<br />
among People <strong>with</strong> Activity Limitations in<br />
Malawi: A national representative study’,<br />
SINTEF Health Research, Oslo, 26 August<br />
2004, ,<br />
31 January 2013; Government of the<br />
United Republic of Tanzania, ‘2008<br />
Tanzania Disability Survey’, United<br />
Republic of Tanzania National Bureau of<br />
Statistics, Dar es Salaam, United Republic<br />
of Tanzania, 2009, p. 19, ,<br />
31 January 2013.<br />
62 World Health Organization and the World<br />
Bank, World Report on Disability, 2011,<br />
p. 206.<br />
63 United Nations, Report of the Secretary-<br />
General on the Status of the Convention<br />
on the Rights of the Child, A/66/230, United<br />
Nations, New York, 3 August 2011, p. 8.<br />
64 For review, see World Health Organization<br />
and the World Bank, World Report on<br />
Disability, 2011, pp. 39–40; Filmer, Deon,<br />
‘Disability, Poverty, and Schooling in<br />
Developing Countries: Results from<br />
14 household surveys’, pp. 141–163;<br />
Sundrum, Ratna, et al., ‘Cerebral Palsy<br />
and Socioeconomic Status: A retrospective<br />
cohort study’, Archives of Disease in<br />
Childhood, vol. 90, no. 1, January 2005,<br />
pp. 15–18; Newacheck, Paul W., et al.,<br />
‘Disparities in the Prevalence of Disability<br />
between Black and White <strong>Children</strong>’,<br />
Archives of Pediatrics & Adolescent<br />
Medicine, vol. 157, no. 3, March 2003,<br />
pp. 244–248.<br />
REFERENCES<br />
89
90<br />
65 United Nations <strong>Children</strong>’s Fund, Promoting<br />
the Rights of <strong>Children</strong> <strong>with</strong> <strong>Disabilities</strong>,<br />
Innocenti Digest No. 13, UNICEF Innocenti<br />
Research Centre, Florence, October 2007,<br />
p. 15, box 5.1, , accessed 31 January 2013.<br />
66 van der Berg, Servaas, Poverty and<br />
Education, United Nations Educational,<br />
Scientific and Cultural Organization, Paris,<br />
2008.<br />
67 United Nations <strong>Children</strong>’s Fund, Promoting<br />
the Rights of <strong>Children</strong> <strong>with</strong> <strong>Disabilities</strong>,<br />
Innocenti Digest No. 13, p. 27, box 5.1.<br />
68 UNICEF, The Right of <strong>Children</strong> <strong>with</strong><br />
<strong>Disabilities</strong> to Education: A rights-based<br />
approach to inclusive education, 2012, p.<br />
8; United Nations Educational, Scientific<br />
and Cultural Organization, ‘The Right to<br />
Education for Persons <strong>with</strong> <strong>Disabilities</strong>:<br />
Towards inclusion – An Education for All<br />
flagship’, Paris, ,<br />
accessed 31 January 2013.<br />
69 United Nations Educational, Scientific<br />
and Cultural Organization, ‘Inclusion of<br />
<strong>Children</strong> <strong>with</strong> <strong>Disabilities</strong>: The early childhood<br />
imperative’, UNESCO Policy Brief on<br />
Early Childhood No. 46, UNESCO, Paris,<br />
April–June 2009, ,<br />
accessed 31 January 2013.<br />
70 Nahar, Baitun, et al., ‘Effects of<br />
Psychosocial Stimulation on Growth and<br />
Development of Severely Malnourished<br />
<strong>Children</strong> in a Nutrition Unit in Bangladesh’,<br />
European Journal of Clinical Nutrition, vol.<br />
63, no. 6, June 2009, pp. 725–731.<br />
71 Jin, X., et al., ‘”Care for Development”<br />
Intervention in Rural China: A prospective<br />
follow-up study’, Journal of Developmental<br />
and Behavioral Pediatrics, vol. 28, no. 3,<br />
2007, pp. 213–218.<br />
72 Nair, M. K., et al., ’Effect of Child<br />
Development Centre Model Early<br />
Stimulation among At Risk Babies: A<br />
randomized controlled trial’, Indian<br />
Pediatrics, vol. 46, supplement, January<br />
2009, pp. s20–s26.<br />
73 Potterton, Joanne, et al., ‘The Effect of a<br />
Basic Home Stimulation Programme on the<br />
Development of Young children Infected<br />
<strong>with</strong> HIV’, Developmental Medicine & Child<br />
Neurology, vol. 52, no. 6, June 2010,<br />
pp. 547–551.<br />
74 Walker, Susan P., et al., ’Inequality in Early<br />
Childhood: Risk and protective factors for<br />
early child development’, pp. 1325–1338.<br />
75 Forlin, Chris, et al., ‘Demographic<br />
Differences in Changing Pre-Service<br />
Teachers’ Attitudes, Sentiments and<br />
Concerns about Inclusive Education’,<br />
International Journal of Inclusive Education,<br />
vol. 13, no. 2, March 2009, pp. 195–209.<br />
Felicia Wilczenski’s ‘Attitudes toward<br />
Inclusive Education Scale’ (ATIES),<br />
developed in 1992, has been particularly<br />
influential in studies of teacher attitudes:<br />
Wilczenski, Felicia L., ‘Measuring Attitudes<br />
toward Inclusive Education’, Psychology in<br />
the Schools, vol. 29, no. 4, October 1992,<br />
pp. 306–312. For a review, see Kuyini,<br />
Ahmed Bawa, and Ishwar Desai, ‘Principals’<br />
and Teachers’ Attitudes and Knowledge<br />
of Inclusive Education as Predictors of<br />
Effective Teaching Practices in Ghana’,<br />
Journal of Research in Special Educational<br />
Needs, vol. 7, no. 2, June 2007, pp. 104–113.<br />
76 Tur-Kaspa, Hana, Amatzia Weisel and Tova<br />
Most, ‘A Multidimensional Study of Special<br />
Education Students’ Attitudes towards<br />
People <strong>with</strong> <strong>Disabilities</strong>: A focus on deafness’,<br />
European Journal of Special Needs<br />
Education, vol. 15, no. 1, March 2000,<br />
pp. 13–23.<br />
77 Latimier, Camille, and Jan Šiška, ‘<strong>Children</strong>’s<br />
Rights for All!: Implementation of the<br />
United Nations Convention on the Rights<br />
of the Child for children <strong>with</strong> intellectual<br />
disabilities’, Inclusion Europe, Brussels,<br />
October 2011, p. 21.<br />
78 Praisner, Cindy L., ‘Attitudes of Elementary<br />
School Principals toward the Inclusion of<br />
Students <strong>with</strong> <strong>Disabilities</strong>’, Exceptional<br />
<strong>Children</strong>, vol. 69, no. 2, 2003, pp. 135–145.<br />
79 Shade, Richard A., and Roger Stewart,<br />
‘General Education and Special Education<br />
Preservice Teachers’ Attitudes towards<br />
Inclusion’, Preventing School Failure,<br />
vol. 46, no. 1, 2001, pp. 37–41.<br />
80 de Boer, Anke, Sip Jan Pijl and Alexander<br />
Minnaert, ‘Regular Primary Schoolteachers’<br />
Attitudes towards Inclusive Education:<br />
A review of the literature’, International<br />
Journal of Inclusive Education, vol. 15,<br />
no 3, April 2011, pp. 345–346.<br />
81 Miles, Susie, and Ian Kaplan, ‘Using<br />
Images to Promote Reflection: An action<br />
research study in Zambia and Tanzania’,<br />
Journal of Research in Special Educational<br />
Needs, vol. 5, no. 2, June 2005, pp. 79–80.<br />
82 Kalyanpur, Maya, ‘Paradigm and Paradox:<br />
Education for All and the inclusion of<br />
children <strong>with</strong> disabilities in Cambodia’,<br />
International Journal of Inclusive<br />
Education, vol. 15, no. 10, December<br />
2011, p. 1058.<br />
83 Miles, Susie, et al., ‘Education for Diversity:<br />
The role of networking in resisting disabled<br />
people’s marginalisation in Bangladesh’,<br />
Compare: A Journal of Comparative and<br />
International Education, vol. 42, no. 2,<br />
2012, p. 293.<br />
84 Schurmann, Erik, ‘Training Disabled<br />
Teachers in Mozambique’, Enabling<br />
Education No. 10, Enabling Education<br />
Network, Manchester, UK, 2006,<br />
, accessed<br />
31 January 2013.<br />
85 United Nations <strong>Children</strong>’s Fund, Promoting<br />
the Rights of <strong>Children</strong> <strong>with</strong> <strong>Disabilities</strong>,<br />
Innocenti Digest No. 13, p. 30.<br />
86 Lynch, Paul, et al., ‘Inclusive Educational<br />
Practices in Uganda: Evidencing practice of<br />
itinerant teachers who work <strong>with</strong> children<br />
<strong>with</strong> visual impairment in local mainstream<br />
schools’, International Journal of Inclusive<br />
Education, vol. 15, no. 10, December 2011,<br />
pp. 1119–1134; Miles, Susie, and Sue<br />
Stubbs, ‘Inclusive Education and <strong>Children</strong><br />
<strong>with</strong> <strong>Disabilities</strong>’, UNICEF background discussion<br />
paper written for The State of the<br />
World’s <strong>Children</strong> 2013, 2012, p. 23.<br />
87 Prag, Anat, ‘Fostering Partnerships for<br />
Education Policy and Reform: Vietnam’,<br />
Enabling Education No. 8, Enabling<br />
Education Network, Manchester, UK,<br />
2004, , accessed 31 January<br />
2013.<br />
88 Report of the Secretary-General on the<br />
Status of the Convention on the Rights<br />
of the Child, 3 August 2011.<br />
89 Stubbs, Sue, ‘Inclusive Education: Where<br />
there are few resources’, The Atlas<br />
Alliance, Oslo, September 2008, p. 36,<br />
, accessed 31 January 2013; Fosere,<br />
Mamello, ‘Mamello’s Story’, Enabling<br />
Education No. 5, Enabling Education<br />
Network, Manchester, UK, 2001, p. 10,<br />
.<br />
90 Lewis, Ingrid, ‘Water, Sanitation, Hygiene<br />
(WASH) and Inclusive Education’, Enabling<br />
Education No. 14, Enabling Education<br />
Network, Manchester, UK, 2010, pp.<br />
9–13, , accessed 31 January 2013.<br />
THE STATE OF THE WORLD’S CHILDREN 2013: <strong>Children</strong> <strong>with</strong> <strong>Disabilities</strong><br />
91 Bines, Hazel, ‘Education’s Missing Millions:<br />
Including disabled children in education<br />
through EFA FTI processes and national<br />
sector plans – Main report of study findings’,<br />
World Vision UK, Milton Keynes,<br />
UK, September 2007, p. 3.<br />
92 Munir, Shirin Z., and Sultana S. Zaman,<br />
‘Models of Inclusion: Bangladesh experience’,<br />
ch. 19 in Inclusive Education across<br />
Cultures: Crossing boundaries, sharing<br />
ideas, edited by Mithu Alur and Vianne<br />
Timmons, Sage Publications India,<br />
New Delhi, 2009, p. 292.<br />
93 Ahsan, Mohammad Tariq, and Lindsay<br />
Burnip, ‘Inclusive Education in<br />
Bangladesh’, Australasian Journal<br />
of Special Education, vol. 31, no. 1,<br />
April 2007, p. 65.<br />
94 Miles, Susie, et al., ‘Education for Diversity:<br />
The role of networking in resisting disabled<br />
people’s marginalisation in Bangladesh’,<br />
Compare: A Journal of Comparative and<br />
International Education, vol. 42, no. 2,<br />
2012, pp. 283–302.<br />
95 United Nations Educational, Scientific and<br />
Cultural Organization, Building Human<br />
Capacities in Least Developed Countries<br />
to Promote Poverty Eradication and<br />
Sustainable Development, UNESCO,<br />
Paris, 2011, p. 8.<br />
96 Lansdown, Gerison, ‘Vulnerability of<br />
<strong>Children</strong> <strong>with</strong> <strong>Disabilities</strong>’, UNICEF background<br />
research paper written for The State<br />
of the World’s <strong>Children</strong> 2013, 2012, p. 8.<br />
97 United Nations Educational, Scientific and<br />
Cultural Organization, Education Counts:<br />
Towards the Millennium Development<br />
Goals, UNESCO, Paris, 2011, p. 17.<br />
98 Abuya, Benta A., James Ciera and<br />
Elizabeth Kimani-Murage, ‘Effect of<br />
Mother’s Education on Child’s Nutritional<br />
Status in the Slums of Nairobi’, BMC<br />
Pediatrics, vol. 12, no. 80, June 2012.<br />
99 Janevic, Teresa, et al., ‘Risk Factors<br />
for Childhood Malnutrition in Roma<br />
Settlements in Serbia’, BMC Public Health,<br />
vol. 10, August 2010.<br />
100 Miller, Jane E., and Yana V. Rodgers,<br />
‘Mother’s Education and <strong>Children</strong>’s<br />
Nutritional Status: New evidence from<br />
Cambodia’, Asian Development Review,<br />
vol. 26, no. 1, 2009, pp. 131–165.<br />
101 Semba, Richard D., et al., ‘Effect of Paternal<br />
Formal Education on Risk of Child Stunting<br />
in Indonesia and Bangladesh: A crosssectional<br />
study’, The Lancet, vol. 371,<br />
no. 9609, January 2008, pp. 322–328.<br />
102 Convention on the Rights of the Child,<br />
article 29.<br />
Chapter 4 Essentials of protection<br />
103 Cody, Clare, Count Every Child: The right<br />
to birth registration, Plan Ltd., Woking,<br />
UK, 2009.<br />
104 Algood, C. L., et al., ’Maltreatment of<br />
<strong>Children</strong> <strong>with</strong> Developmental <strong>Disabilities</strong>:<br />
An ecological systems analysis,’ <strong>Children</strong><br />
and Youth Services Review, vol. 33, no. 7,<br />
July 2011, pp. 1142–1148; Stalker, K., and<br />
K. McArthur, ’Child Abuse, Child Protection<br />
and Disabled <strong>Children</strong>: A review of recent<br />
research,’ Child Abuse Review, vol. 21,<br />
no. 1, January/February 2012, pp. 24–40.<br />
105 Kvam, Marit Hoem, ‘Sexual Abuse of Deaf<br />
<strong>Children</strong>: A retrospective analysis of the<br />
prevalence and characteristics of childhood<br />
sexual abuse among deaf adults in<br />
Norway’, Child Abuse & Neglect, vol. 28,<br />
no. 3, March 2004, pp. 241–251; Lansdown,<br />
Gerison, ‘Vulnerability of <strong>Children</strong> <strong>with</strong><br />
<strong>Disabilities</strong>’, p. 6.
106 Mental Disability Rights International,<br />
‘Behind Closed Doors: Human rights abuses<br />
in the psychiatric facilities, orphanages<br />
and rehabilitation centers of Turkey’, MDRI,<br />
Washington, D.C., 28 September 2005,<br />
pp. 1, 23, 72, ,<br />
accessed 31 January<br />
2013; Mental Disability Rights International,<br />
‘Torture Not Treatment: Electric shock and<br />
long-term restraint in the United States<br />
on children and adults <strong>with</strong> disabilities<br />
at the Judge Rotenberg Center’, MDRI,<br />
Washington, D.C., 2010, pp. 1–2,<br />
,<br />
accessed 31 January 2013.<br />
107 Human Rights Watch, Open Society<br />
Foundations, Women <strong>with</strong> <strong>Disabilities</strong><br />
Australia, International Disability<br />
Alliance and Stop Torture in Health Care,<br />
‘Sterilization of Women and Girls <strong>with</strong><br />
<strong>Disabilities</strong>: A briefing paper’, November<br />
2011, ,<br />
accessed 31 January 2013.<br />
108 Dowse, Leanne, ‘Moving Forward or Losing<br />
Ground?: The sterilisation of women and<br />
girls <strong>with</strong> disabilities in Australia’, Paper<br />
prepared for Women <strong>with</strong> <strong>Disabilities</strong><br />
Australia and presented at the Disabled<br />
Peoples’ International World Summit,<br />
Winnipeg, Canada, 8–10 September 2004.<br />
109 Information obtained from UNICEF<br />
Serbia; United Nations <strong>Children</strong>’s Fund<br />
and Serbian Government Ministry of<br />
Labour and Social Policy, ‘Transforming<br />
Residential Institutions for <strong>Children</strong> and<br />
Developing Sustainable Alternatives’,<br />
Belgrade, 2011, pp. 4–8.<br />
110 Convention on the Rights of the Child<br />
General Comment No. 9 (2006), p. 21.<br />
FOCUS<br />
Violence against children <strong>with</strong> disabilities<br />
Jones, Lisa, et al., ‘Prevalence and Risk of<br />
Violence against <strong>Children</strong> <strong>with</strong> <strong>Disabilities</strong>’,<br />
pp. 899–907.<br />
World Health Organization and the World Bank,<br />
World Report on Disability, 2011, pp. 29, 59 and<br />
137, pp. 29, 59 and 137.<br />
Pinheiro, Paulo Sérgio, World Report on<br />
Violence against <strong>Children</strong>, United Nations<br />
Secretary-General’s Study on Violence against<br />
<strong>Children</strong>, Geneva, 2006.<br />
Krug, Etienne G., et al., eds., World Report<br />
on Violence and Health, World Health<br />
Organization, Geneva, 2002.<br />
Hibbard, Roberta A., et al., ‘Maltreatment of<br />
<strong>Children</strong> <strong>with</strong> <strong>Disabilities</strong>’, Pediatrics, vol. 119,<br />
no. 5, 1 May 2007, pp. 1018–1025.<br />
Ammerman, Robert T., et al., ‘Maltreatment<br />
in Psychiatrically Hospitalized <strong>Children</strong> and<br />
Adolescents <strong>with</strong> Developmental <strong>Disabilities</strong>:<br />
Prevalence and correlates’, Journal of the<br />
American Academy of Child & Adolescent<br />
Psychiatry, vol. 33, no. 4, May 1994,<br />
pp. 567–576.<br />
Sullivan, Patricia M., ‘Violence Exposure among<br />
<strong>Children</strong> <strong>with</strong> <strong>Disabilities</strong>’, Clinical Child and<br />
Family Psychology Review, vol. 12, no. 2,<br />
June 2009, pp. 196–216.<br />
Ammerman, Robert T., and Nora J. Baladerian,<br />
Maltreatment of <strong>Children</strong> <strong>with</strong> <strong>Disabilities</strong>,<br />
National Committee to Prevent Child Abuse,<br />
Chicago, 1993.<br />
United Nations, Convention on the Rights of<br />
Persons <strong>with</strong> <strong>Disabilities</strong>, A/RES/61/106,<br />
United Nations, New York, 2008.<br />
Gilbert, Ruth, et al., ‘Burden and Consequences<br />
of Child Maltreatment in High-Income<br />
Countries’, The Lancet, vol. 373, no. 9657,<br />
3 January 2009, pp. 68–81.<br />
Felitti, Vincent J., et al., ‘Relationship of<br />
Childhood Abuse and Household Dysfunction<br />
to Many of the Leading Causes of Death in<br />
Adults: The adverse childhood experiences<br />
(ACE) study’, American Journal of Preventive<br />
Medicine, vol. 14, no. 4, May 1998, pp. 245–258.<br />
MacMillan, Harriet L., et al., ‘Interventions to<br />
Prevent Child Maltreatment and Associated<br />
Impairment’, The Lancet, vol. 373, no. 9659,<br />
17 January 2009, pp. 250–266.<br />
Chapter 5 Humanitarian Response<br />
111 Von der Assen, Nina, Mathijs Euwema and<br />
Huib Cornielje, ‘Including Disabled <strong>Children</strong><br />
in Psychological Programmes in Areas<br />
Affected by Armed Conflict’, Intervention,<br />
vol. 8, no. 1, March 2010, pp. 29–39.<br />
112 Bartlett, Sheridan, ‘The Implications of<br />
Climate Change for <strong>Children</strong> in Lower-<br />
Income Countries’, <strong>Children</strong>, Youth and<br />
Environments, vol. 18, no. 1, 2008,<br />
pp. 71–98.<br />
113 Convention on the Rights of the Child<br />
General Comment No. 9 (2006), p. 22.<br />
FOCUS<br />
Risk, resilience and inclusive<br />
humanitarian action<br />
African Child Policy Forum, ‘Violence against<br />
<strong>Children</strong> in Africa: A compilation of the main<br />
findings of the various research projects<br />
conducted by the African Child Policy Forum<br />
(ACPF) since 2006’, ACPF, Addis Ababa,<br />
March 2011.<br />
Handicap International, ‘Mainstreaming<br />
Disability into Disaster Risk Reduction:<br />
A training manual’, Handicap<br />
International, Kathmandu, January 2009,<br />
,<br />
accessed 31 January 2013.<br />
International Committee of the Red Cross,<br />
‘Promotion and Protection of the Rights of<br />
<strong>Children</strong>: ICRC statement to the United Nations,<br />
2011’, ICRC, Geneva, 17 October 2011,<br />
,<br />
accessed<br />
31 January 2013.<br />
IRIN, ‘DRC: Child disability, the forgotten<br />
crisis’, IRIN, Goma, Democratic Republic of<br />
the Congo, 23 October 2009, ,<br />
accessed 2 October 2012.<br />
Kett, Maria, and Mark van Ommeren,<br />
‘Disability, Conflict and Emergencies’, The<br />
Lancet, vol. 374, no. 9704, 28 November 2009,<br />
pp. 1801–1803, , accessed 31 January 2013.<br />
Kett, Maria, and Jean-François Trani,<br />
‘Vulnerability and Disability in Darfur’, Forced<br />
Migration Review, vol. 35, July 2010, pp. 12–14.<br />
Nelson, Brett D., et al., ‘Impact of Sexual<br />
Violence on <strong>Children</strong> in the Eastern Democratic<br />
Republic of Congo’, Medicine, Conflict and<br />
Survival, vol. 27, no. 4, October–December<br />
2011, pp. 211–225.<br />
Pearn, John H., ‘The Cost of War: Child<br />
injury and death’, in Contemporary Issues in<br />
Childhood Diarrhoea and Malnutrition, 1st<br />
edition, edited by Zulfigar Ahmed Bhutta,<br />
Oxford University Press, Karachi, Pakistan,<br />
pp. 334–343.<br />
Penrose, Angela, and Mie Takaki, ‘<strong>Children</strong>’s<br />
Rights in Emergencies and Disasters’, The<br />
Lancet, vol. 367, no. 9511, 25 February 2006,<br />
pp. 698–699.<br />
Plan International, ‘Child-Centred Disaster Risk<br />
Reduction: Building resilience through participation<br />
– Lessons from Plan International’,<br />
Plan UK, London, 2010.<br />
Handicap International and Save the <strong>Children</strong>,<br />
Out from the Shadows: Sexual Violence against<br />
<strong>Children</strong> <strong>with</strong> <strong>Disabilities</strong>, Save the <strong>Children</strong><br />
UK, London, 2011.<br />
Tamashiro, Tami, ‘Impact of Conflict on<br />
<strong>Children</strong>’s Health and Disability’, Background<br />
paper prepared for the Education for All<br />
Global Monitoring Report 2011: The hidden<br />
crisis – Armed conflict and education, United<br />
Nations Educational, Scientific and Cultural<br />
Organization, Paris, June 2010,,<br />
accessed 31 January 2013.<br />
Trani, Jean-François, et al., ‘Disability,<br />
Vulnerability and Citizenship: To what extent<br />
is education a protective mechanism for children<br />
<strong>with</strong> disabilities in countries affected by<br />
conflict?’, International Journal of Inclusive<br />
Education, vol. 15, no. 10, 2011, pp. 1187–1203.<br />
United Nations <strong>Children</strong>’s Fund, ‘Violence<br />
against Disabled <strong>Children</strong>: UN Secretary-<br />
General’s Report on Violence against <strong>Children</strong><br />
– Summary report’, UNICEF, New York, 28 July<br />
2005, pp. 4–5, ,<br />
accessed 31 January 2013.<br />
United Nations General Assembly, Report of<br />
the Special Representative of the Secretary-<br />
General for <strong>Children</strong> and Armed Conflict,<br />
A/62/228, United Nations, New York,<br />
13 August 2007.<br />
Women’s Commission for Refugee Women<br />
and <strong>Children</strong>, <strong>Disabilities</strong> among Refugees<br />
and Conflict-Affected Populations: Resource<br />
kit for fieldworkers, Women’s Commission for<br />
Refugee Women and <strong>Children</strong>, New York, June<br />
2008, ,<br />
accessed 31 January 2013.<br />
World Health Organization and the World Bank,<br />
World Report on Disability, 2011, pp. 34–37.<br />
FOCUS<br />
Explosive remnants of war<br />
Under the Mine Ban Treaty, victims are defined<br />
as those who are directly impacted and therefore<br />
have been killed by a landmine blast or<br />
survived one, as well as the surviving family<br />
members of those killed and injured. Under the<br />
Convention on Cluster Munitions, victims also<br />
include affected family members and affected<br />
communities. Throughout this document,<br />
‘victims’ refers to survivors, family members<br />
of those affected and affected communities;<br />
‘casualties’ refers to those directly killed or<br />
injured by blasts; while ‘survivors’ specifically<br />
refers to those who have been directly impacted<br />
and survived landmines/Explosive Remnants<br />
of War blasts.<br />
Landmine and Cluster Munition Monitor,<br />
Landmine Monitor 2011, Mines Action Canada,<br />
October 2011, p. 51.<br />
‘Mines’ include victim-activated anti-personnel<br />
mines, anti-vehicle mines and improvised<br />
explosive devices; 2010 is the most recent year<br />
for which verified casualty totals were available<br />
for all countries at the time of publication.<br />
Please see , accessed<br />
31 January 2013, for a full definition of casualties<br />
and devices as presented here and for<br />
updated casualty data.<br />
REFERENCES<br />
91
92<br />
The Landmine Monitor identified more than<br />
1,500 child casualties in 1999 and more than<br />
1,600 in 2001.<br />
This includes only the casualties for which the<br />
civilian/security status and the age were known.<br />
Boys accounted for 1,371 of the 2,735 civilian<br />
casualties caused by explosive remnants of war<br />
(ERW) between 2008 and 2010.<br />
Landmine and Cluster Munition Monitor,<br />
Landmine and Cluster Munition Monitor Fact<br />
Sheet: Impact of mines/ERW on children<br />
– November 2011, Landmine and Cluster<br />
Munition Monitor, Geneva, p. 2.<br />
Landmine and Cluster Munition Monitor Fact<br />
Sheet: Impact of mines/ERW on children –<br />
November 2010, pp. 1–3.<br />
Landmine and Cluster Munition Monitor Fact<br />
Sheet: Landmines and children – March 2010,<br />
pp. 2, 3.<br />
Percentages are of civilian casualties for<br />
which the age was known. <strong>Children</strong> made<br />
up 30 per cent of casualties from all types<br />
of mines.<br />
Landmine and Cluster Munition Monitor, ‘The<br />
Issues: Landmines’, Landmine and Cluster<br />
Munition Monitor, Geneva, ,<br />
accessed 31 January 2013.<br />
Walsh, Nicolas E., and Wendy S. Walsh,<br />
‘Rehabilitation of Landmine Victims: The ultimate<br />
challenge’, Bulletin of the World Health<br />
Organization, vol. 81, no. 9, 2003, pp. 665–670.<br />
International Save the <strong>Children</strong> Alliance, ‘Child<br />
Landmine Survivors: An inclusive approach<br />
to policy and practice’, International Save the<br />
<strong>Children</strong> Alliance, London, 2000.<br />
Watts, Hugh G., ‘The Consequences for<br />
<strong>Children</strong> of Explosive Remnants of War: Land<br />
mines, unexploded ordnance, improvised<br />
explosive devices and cluster bombs’, Journal<br />
of Pediatric Rehabilitation Medicine: An<br />
Interdisciplinary Approach, vol. 2, 2009,<br />
pp. 217–227.<br />
Landmine and Cluster Munition Monitor Fact<br />
Sheet: Impact of mines/ERW on children –<br />
November 2010, pp. 1–3.<br />
Watts, Hugh G., ‘The Consequences for<br />
<strong>Children</strong> of Explosive Remnants of War’,<br />
pp. 217–227.<br />
Landmine and Cluster Munition Monitor Fact<br />
Sheet: Landmines and children – June 2009,<br />
pp. 1–4.<br />
Munoz, Wanda, Ulrike Last and Teng Kimsean,<br />
Good Practices from the Project: Towards sustainable<br />
income generating activities for mine<br />
victim and other persons <strong>with</strong> disabilities in<br />
Cambodia, Handicap International Federation<br />
(HIC) Cambodia, Phnom Penh, Cambodia, 2010.<br />
Child Protection in Crisis (CPC) Network,<br />
Livelihoods and Economic Strengthening Task<br />
Force, The Impacts of Economic Strengthening<br />
Programs on <strong>Children</strong>: a review of the evidence,<br />
CPC Network, August 2011, pp. ii, 1, 18.<br />
Landmine and Cluster Munition Monitor Fact<br />
Sheet: Impact of mines/ERW on children –<br />
November 2010, pp. 1–3.<br />
Handicap International, Voices from the<br />
Ground: Landmine and explosive remnants of<br />
war survivors speak out on victim assistance,<br />
Handicap International, Brussels, September<br />
2009, p. 210.<br />
Chapter 6 Measuring child disability<br />
114 United Nations <strong>Children</strong>’s Fund and the<br />
University of Wisconsin, Monitoring<br />
Child Disability in Developing Countries:<br />
Results from the Multiple Indicator Cluster<br />
Surveys, UNICEF, New York, 2008, p. 9.<br />
115 Mont, Daniel, ‘Measuring Disability<br />
Prevalence’, Social Protection Discussion<br />
Paper No. 0706, The World Bank,<br />
Washington, D.C., March 2007, p. 35;<br />
Maulik, Pallab K., and Gary L. Darmstadt,<br />
‘Childhood Disability in Low- and Middle-<br />
Income Countries: Overview of screening,<br />
prevention, services, legislation, and<br />
epidemiology’, Pediatrics, vol. 120,<br />
Supplement 1, July 2007, p. S21.<br />
116 World Health Organization, Towards a<br />
Common Language for Functioning,<br />
Disability and Health: ICF – The international<br />
classification of functioning, disability<br />
and health, WHO, Geneva, 2002.<br />
117 Msall, Michael E., and Dennis P. Hogan,<br />
‘Counting <strong>Children</strong> <strong>with</strong> Disability in Low-<br />
Income Countries: Enhancing prevention,<br />
promoting child development, and investing<br />
in economic well-being’, Pediatrics,<br />
vol. 120, no. 1, July 2007, p. 183.<br />
118 Durkin, Maureen, S., ‘The Epidemiology<br />
of Developmental <strong>Disabilities</strong> in Low-<br />
Income Countries’, Mental Retardation<br />
and Developmental <strong>Disabilities</strong> Research<br />
Review, vol. 8, no. 3, 2002, p. 211; United<br />
Nations <strong>Children</strong>’s Fund and the University<br />
of Wisconsin, Monitoring Child Disability in<br />
Developing Countries, p. 8.<br />
119 Lansdown, R. G., et al., ‘Culturally<br />
Appropriate Measures for Monitoring Child<br />
Development at Family and Community<br />
Level: A WHO collaborative study’, Bulletin<br />
of the World Health Organization, vol. 74,<br />
no. 3, 1996, p. 287<br />
120 See appendix 2 of Maulik and Darmstadt,<br />
2007.<br />
121 Robertson, Janet, Chris Hatton and Eric<br />
Emerson, ‘The Identification of <strong>Children</strong><br />
<strong>with</strong> or at Significant Risk of Intellectual<br />
<strong>Disabilities</strong> in Low and Middle Income<br />
Countries: A review’, CeDR Research<br />
Report, no. 3, Centre for Disability<br />
Research, Lancaster University, Lancaster,<br />
UK, July 2009, p. 22; United Nations<br />
<strong>Children</strong>’s Fund and the University of<br />
Wisconsin, Monitoring Child Disability in<br />
Developing Countries, pp. 9, 58; Gladstone,<br />
M. J., et al., ‘Can Western Developmental<br />
Screening Tools Be Modified for Use in<br />
a Rural Malawian Setting?’, Archives of<br />
Diseases in Childhood, vol. 93, no. 1,<br />
January 2008, pp. 23–29.<br />
122 Mont, Daniel, ‘Measuring Disability<br />
Prevalence’, p. 35; Washington Group on<br />
Disability Statistics, ‘Understanding and<br />
Interpreting Disability as Measured Using<br />
the WG Short Set of Questions’, 20 April<br />
2009, p. 2.<br />
123 United Nations <strong>Children</strong>’s Fund and the<br />
University of Wisconsin, Monitoring Child<br />
Disability in Developing Countries, p. 8.<br />
124 Durkin, Maureen S., ‘Population-Based<br />
Studies of Childhood Disability in<br />
Developing Countries: Rationale and study<br />
design’, International Journal of Mental<br />
Health, vol. 20, no. 2, 1991, pp. 47–60;<br />
United Nations <strong>Children</strong>’s Fund and the<br />
University of Wisconsin, Monitoring Child<br />
Disability in Developing Countries, p. 8.<br />
THE STATE OF THE WORLD’S CHILDREN 2013: <strong>Children</strong> <strong>with</strong> <strong>Disabilities</strong><br />
125 Durkin, Maureen S., ‘Population-Based<br />
Studies of Childhood Disability in<br />
Developing Countries’, pp. 47–60.<br />
126 Ibid.; United Nations <strong>Children</strong>’s Fund and the<br />
University of Wisconsin, Monitoring Child<br />
Disability in Developing Countries, p. 9.<br />
127 World Health Organization and the United<br />
Nations Economic and Social Commission<br />
for Asia and the Pacific, Training Manual<br />
on Disability Statistics, Bangkok, 2008, pp.<br />
107–108.<br />
128 United Nations <strong>Children</strong>’s Fund and the<br />
University of Wisconsin, Monitoring Child<br />
Disability in Developing Countries, pp.<br />
8–9; Nair, M. K., et al., ‘Developmental<br />
Screening Chart’, Indian Pediatrics, vol. 28,<br />
no. 8, 1991, pp. 869–872.<br />
129 United Nations <strong>Children</strong>’s Fund and the<br />
University of Wisconsin, Monitoring<br />
Child Disability in Developing Countries,<br />
p. 9; Durkin, Maureen S., ‘Population-<br />
Based Studies of Childhood Disability in<br />
Developing Countries’, pp. 47–60.<br />
130 Robertson, Janet, Chris Hatton and Eric<br />
Emerson, ‘The Identification of <strong>Children</strong><br />
<strong>with</strong> or at Significant Risk of Intellectual<br />
<strong>Disabilities</strong> in Low and Middle Income<br />
Countries: A review’, p. 20.<br />
FOCUS<br />
Lessons learned<br />
United Nations <strong>Children</strong>’s Fund and the<br />
University of Wisconsin, Monitoring Child<br />
Disability in Developing Countries: Results<br />
from the Multiple Indicator Cluster Surveys,<br />
p. 9; Thorburn Marigold, et al., ‘Identification<br />
of Childhood Disability in Jamaica: The ten<br />
question screen’, International Journal of<br />
Rehabilitation Research, vol. 15, no. 2,<br />
June 1992, pp. 115–127.<br />
United Nations <strong>Children</strong>’s Fund and the<br />
University of Wisconsin, Monitoring Child<br />
Disability in Developing Countries: Results from<br />
the Multiple Indicator Cluster Surveys, p. 9.<br />
Durkin, Maureen S., ‘Population-Based<br />
Studies of Childhood Disability in Developing<br />
Countries’, pp. 47–60; United Nations <strong>Children</strong>’s<br />
Fund and the University of Wisconsin,<br />
Monitoring Child Disability in Developing<br />
Countries, pp. 9–10.<br />
Zaman, Sultana S., et al., ‘Validity of the ‘Ten<br />
Questions’ for Screening Serious Childhood<br />
Disability: Results from urban Bangladesh’,<br />
International Journal of Epidemiology, vol. 19,<br />
no. 3, 1990, p. 613.<br />
Previous UNICEF publications reported that the<br />
number of participating countries was 20. This<br />
number was correct when those publications<br />
were printed, but the final number of countries<br />
that administered the Ten Questions as part of<br />
MICS3 was 25.<br />
United Nations <strong>Children</strong>’s Fund and University<br />
of Wisconsin, Monitoring Child Disability in<br />
Developing Countries, p. 23.<br />
FOCUS<br />
From screening to assessment<br />
Maulik, Pallab K., and Gary L. Darmstadt,<br />
‘Childhood Disability in Low- and Middle-<br />
Income Countries’, July 2007, p. S6; United<br />
Nations <strong>Children</strong>’s Fund and the University<br />
of Wisconsin, Monitoring Child Disability in<br />
Developing Countries, p. 58.
Statistical Tables<br />
Economic and social statistics on the countries and areas<br />
of the world, <strong>with</strong> particular reference to children’s well-being.<br />
Overview ..............................................................................................94<br />
General note on the data ....................................................................94<br />
Child mortality estimates ....................................................................94<br />
Notes on specific tables ......................................................................95<br />
Explanation of symbols .......................................................................98<br />
Regional classification .........................................................................98<br />
Under-five mortality rankings .............................................................99<br />
TABLES<br />
1 Basic indicators ...........................................................................100<br />
2 Nutrition .......................................................................................104<br />
3 Health ...........................................................................................108<br />
4 HIV/AIDS ......................................................................................112<br />
5 Education .....................................................................................116<br />
6 Demographic indicators .............................................................120<br />
7 Economic indicators ...................................................................124<br />
8 Women .........................................................................................128<br />
9 Child protection ...........................................................................132<br />
10 The rate of progress ....................................................................136<br />
11 Adolescents .................................................................................140<br />
12 Disparities by residence .............................................................144<br />
13 Disparities by household wealth ...............................................148<br />
14 Early childhood development ....................................................152<br />
STATISTICAL TABLES 93
STATISTICAL TABLES<br />
OVERVIEW<br />
This reference guide presents the most recent key statistics on child survival, development and<br />
protection for the world’s countries, areas and regions. It includes, for the first time, a table on early<br />
childhood development.<br />
The statistical tables in this volume also support UNICEF’s focus on progress and results towards<br />
internationally agreed-upon goals and compacts relating to children’s rights and development.<br />
UNICEF is the lead agency responsible for monitoring the child-related goals of the Millennium<br />
Declaration as well as the Millennium Development Goals (MDGs) and indicators. UNICEF is also<br />
a key partner in the United Nations’ work on monitoring these targets and indicators.<br />
Efforts have been made to maximize the comparability of statistics across countries and time.<br />
Nevertheless, data used at the country level may differ in terms of the methods used to collect data<br />
or arrive at estimates, and in terms of the populations covered. Furthermore, data presented here<br />
are subject to evolving methodologies, revisions of time series data (e.g., immunization, maternal<br />
mortality ratios) and changing regional classifications. Also, data comparable from one year to<br />
the next are unavailable for some indicators. It is therefore not advisable to compare data from<br />
consecutive editions of The State of the World’s <strong>Children</strong>.<br />
The numbers presented in this reference guide are available online at <br />
and via the UNICEF global statistical databases at . Please refer to these websites<br />
for the latest tables and for any updates or corrigenda subsequent to printing.<br />
General note on the data<br />
Data presented in the following statistical tables are<br />
derived from the UNICEF global databases and are accompanied<br />
by definitions, sources and, where necessary,<br />
additional footnotes. The tables draw on inter-agency<br />
estimates and nationally representative household surveys<br />
such as Multiple Indicator Cluster Surveys (MICS) and<br />
Demographic and Health Surveys (DHS). In addition, data<br />
from other United Nations organizations have been used.<br />
Data presented in this year’s statistical tables generally reflect<br />
information available as of August 2012. More detailed<br />
information on methodology and data sources is available<br />
at .<br />
This volume includes the latest population estimates and<br />
projections from World Population Prospects: The 2010 revision<br />
and World Urbanization Prospects: The 2011 revision<br />
(United Nations Department of Economic and Social Affairs,<br />
Population Division). Data quality is likely to be adversely<br />
affected for countries that have recently suffered disasters,<br />
especially where basic country infrastructure has been<br />
fragmented or where major population movements<br />
have occurred.<br />
Multiple Indicator Cluster Surveys (MICS): UNICEF supports<br />
countries in collecting reliable and globally mapped<br />
data through MICS. Since 1995, around 240 surveys have<br />
been conducted in over 100 countries and areas. The fifth<br />
94<br />
THE STATE OF THE WORLD’S CHILDREN 2013: <strong>Children</strong> <strong>with</strong> <strong>Disabilities</strong><br />
round of MICS, involving around 60 countries, is under way.<br />
MICS are among the largest sources of data for monitoring<br />
progress towards internationally agreed-upon development<br />
goals for children, including the MDGs. More information is<br />
available at .<br />
Child mortality estimates<br />
Each year, in The State of the World’s <strong>Children</strong>, UNICEF<br />
reports a series of mortality estimates for children – including<br />
the annual infant mortality rate, the under-five mortality<br />
rate and the number of under-five deaths – for at least two<br />
reference years. These figures represent the best estimates<br />
available at the time of printing and are based on the work<br />
of the United Nations Inter-agency Group for Child Mortality<br />
Estimation (IGME), which includes UNICEF, the World Health<br />
Organization (WHO), the World Bank and the United Nations<br />
Population Division. IGME mortality estimates are updated<br />
annually through a detailed review of all newly available<br />
data points, which often results in adjustments to previously<br />
reported estimates. As a result, consecutive editions<br />
of The State of the World’s <strong>Children</strong> should not be used for<br />
analysing mortality trends over time. Comparable global and<br />
regional under-five mortality estimates for the period 1970–<br />
2011 are presented on page 95. Country-specific mortality<br />
indicators for 1970–2011, based on the most recent IGME estimates,<br />
are presented in Table 10 (for the years 1970, 1990,<br />
2000 and 2011) and are available at <br />
and .
under-five mortality rate (per 1,000 live births)<br />
uNICEF Region 1970 1975 1980 1985 1990 1995 2000 2005 2010 2011<br />
Sub-Saharan Africa 236 212 197 184 178 170 154 133 112 109<br />
Eastern and Southern Africa 214 191 183 170 162 155 135 112 88 84<br />
West and Central Africa 259 237 215 202 197 190 175 155 135 132<br />
Middle East and North Africa 190 157 122 90 72 61 52 44 37 36<br />
South Asia 195 175 154 135 119 104 89 75 64 62<br />
East Asia and Pacific 120 92 75 62 55 49 39 29 22 20<br />
Latin America and Caribbean 117 100 81 65 53 43 34 26 22 19<br />
CEE/CIS 88 75 68 56 48 45 35 28 22 21<br />
Least developed countries 238 223 206 186 171 156 136 118 102 98<br />
World 141 123 111 96 87 82 73 63 53 51<br />
under-five deaths (millions)<br />
uNICEF Region 1970 1975 1980 1985 1990 1995 2000 2005 2010 2011<br />
Sub-Saharan Africa 3.1 3.2 3.4 3.5 3.8 4.0 4.0 3.8 3.4 3.4<br />
Eastern and Southern Africa 1.3 1.4 1.5 1.6 1.7 1.7 1.6 1.5 1.2 1.2<br />
West and Central Africa 1.6 1.7 1.8 1.9 2.1 2.2 2.2 2.2 2.1 2.1<br />
Middle East and North Africa 1.2 1.1 1.0 0.8 0.7 0.5 0.4 0.4 0.4 0.4<br />
South Asia 5.3 5.1 5.0 4.6 4.3 3.9 3.3 2.7 2.4 2.3<br />
East Asia and Pacific 5.2 3.5 2.3 2.4 2.2 1.6 1.3 0.9 0.6 0.6<br />
Latin America and Caribbean 1.2 1.1 0.9 0.8 0.6 0.5 0.4 0.3 0.2 0.2<br />
CEE/CIS 0.5 0.6 0.5 0.4 0.4 0.2 0.2 0.1 0.1 0.1<br />
Least developed countries 3.3 3.4 3.5 3.5 3.5 3.5 3.3 3.0 2.7 2.6<br />
World 16.9 14.8 13.1 12.7 12.0 10.8 9.6 8.2 7.1 6.9<br />
Notes on specific tables<br />
TABLE 1. BASIC INdICATORS<br />
Under-five mortality rate by gender: For the first time, IGME<br />
has produced gender-specific estimates of the under-five<br />
mortality rate. Details on the estimation methods are<br />
available in the annex of the latest IGME report, at<br />
.<br />
Share of household income: The percentage share of<br />
household income received by the wealthiest 20 per cent<br />
and the poorest 40 per cent of households has been moved<br />
from Table 1 to Table 7, where it is now presented alongside<br />
other economic indicators.<br />
TABLE 2. NuTRITION<br />
Underweight, stunting, wasting and overweight: UNICEF<br />
and WHO have initiated a process to harmonize anthropometric<br />
data used for computation and estimation of<br />
regional and global averages and trend analysis. As part<br />
of this process, regional and global averages for underweight<br />
(moderate and severe), stunting, wasting and<br />
overweight prevalences are derived from a model<br />
described in M. de Onis et al., ‘Methodology for Estimating<br />
Regional and Global Trends of Child Malnutrition’<br />
(International Journal of Epidemiology, vol. 33, 2004,<br />
pp. 1260–1270). Owing to differences in data sources<br />
(i.e., new empirical data are incorporated as made available)<br />
and estimation methodology, these regional average<br />
prevalence estimates may not be comparable to the averages<br />
published in previous editions of The State of the<br />
World’s <strong>Children</strong>.<br />
Vitamin A supplementation: Emphasizing the importance<br />
for children of receiving two annual doses of vitamin A<br />
(spaced 4–6 months apart), this report presents only full<br />
coverage of vitamin A supplementation. In the absence of<br />
a direct method to measure this indicator, full coverage<br />
is reported as the lower coverage estimate from rounds<br />
1 and 2 in a given year.<br />
TABLE 3. HEALTH<br />
Diarrhoea treatment: For the first time, the table includes<br />
diarrhoea treatment <strong>with</strong> oral rehydration salts (ORS). ORS<br />
is a key commodity for child survival and therefore it is crucial<br />
to monitor its coverage. This replaces the indicator used<br />
in previous years, diarrhoea treatment <strong>with</strong> oral rehydration<br />
therapy and continued feeding, which will continue to be<br />
available at .<br />
STATISTICAL TABLES 95
STATISTICAL TABLES<br />
Water and sanitation: The drinking water and sanitation<br />
coverage estimates in this report come from the<br />
WHO/UNICEF Joint Monitoring Programme for Water<br />
Supply and Sanitation (JMP). These are the official United<br />
Nations estimates for measuring progress towards the MDG<br />
target for drinking water and sanitation. Full details of the<br />
JMP methodology can be found at <br />
and . As the JMP estimates use linear<br />
regression applied to data from all available household<br />
sample surveys and censuses, and additional data become<br />
available between each issue of estimates, subsequent<br />
JMP estimates should not be compared.<br />
Immunization: This report presents WHO and UNICEF<br />
estimates of national immunization coverage. These are<br />
official United Nations estimates for measuring progress<br />
towards the MDG indicator for measles-containing<br />
vaccine coverage. Since 2000, the estimates are updated<br />
once annually in July, following a consultation process<br />
wherein countries are provided draft reports for review<br />
and comment. As the system incorporates new empirical<br />
data, each annual revision supersedes prior data releases,<br />
and coverage levels from earlier revisions are not<br />
comparable. A more detailed explanation of the process<br />
can be found at .<br />
Regional averages for the six reported antigens are computed<br />
as follows:<br />
• For BCG, regional averages include only those countries<br />
where BCG is included in the national routine immunization<br />
schedule.<br />
• For DPT, polio, measles, HepB and Hib vaccines, regional<br />
averages include all countries.<br />
• For protection at birth (PAB) from tetanus, regional averages<br />
include only the countries where maternal and neonatal<br />
tetanus is endemic.<br />
TABLE 4. HIV/AIdS<br />
In 2012, the Joint United Nations Programme on HIV/AIDS<br />
(UNAIDS) released new global, regional and country level<br />
HIV and AIDS estimates for 2011 that reflect key changes in<br />
WHO HIV treatment guidelines for adults and children and<br />
for prevention of mother-to-child transmission of HIV as well<br />
as improvements in assumptions of the probability of HIV<br />
transmission from mother to child and net survival rates for<br />
infected children. In addition, there are also more reliable<br />
data available from population-based surveys, expanded<br />
national sentinel surveillance systems and programme service<br />
statistics in a number of countries. Based on the refined<br />
methodology, UNAIDS has retrospectively generated new<br />
estimates of HIV prevalence, the number of people living<br />
<strong>with</strong> HIV and those needing treatment, AIDS-related deaths,<br />
new HIV infections and the number of children whose parents<br />
have died due to all causes including AIDS for past<br />
96<br />
THE STATE OF THE WORLD’S CHILDREN 2013: <strong>Children</strong> <strong>with</strong> <strong>Disabilities</strong><br />
years. Only new estimates should be used for trend analysis.<br />
The new HIV and AIDS estimates included in this table will<br />
also be published in the forthcoming UNAIDS Global AIDS<br />
Report, 2012.<br />
Overall, the global and regional figures published in The<br />
State of the World’s <strong>Children</strong> 2013 are not comparable to estimates<br />
previously published. More information on HIV and<br />
AIDS estimates, methodology and updates can be found at<br />
.<br />
TABLE 8. WOmEN<br />
Maternal mortality ratio (adjusted): The table presents the<br />
‘adjusted’ maternal mortality ratios for the year 2010, as<br />
produced by the Maternal Mortality Estimation Inter-agency<br />
Group (MMEIG), composed of WHO, UNICEF, the United<br />
Nations Population Fund (UNFPA) and the World Bank, together<br />
<strong>with</strong> independent technical experts. To derive these<br />
estimates, the inter-agency group used a dual approach:<br />
making adjustments to correct misclassification and underreporting<br />
in existing estimates of maternal mortality from<br />
civil registration systems, and using a model to generate<br />
estimates for countries <strong>with</strong>out reliable national-level estimates<br />
of maternal mortality. These ‘adjusted’ estimates<br />
should not be compared to previous inter-agency estimates.<br />
The full report – <strong>with</strong> complete country and regional estimates<br />
for the years 1990, 1995, 2000, 2005 and 2010, as<br />
well as details on the methodology – can be found at<br />
.<br />
TABLE 9. CHILd pROTECTION<br />
Violent discipline: Estimates used in UNICEF publications<br />
and in MICS country reports prior to 2010 were calculated<br />
using household weights that did not take into account the<br />
last-stage selection of children for the administration of the<br />
child discipline module in MICS surveys. (A random selection<br />
of one child aged 2–14 is undertaken for the administration<br />
of the child discipline module.) In January 2010, it<br />
was decided that more accurate estimates are produced by<br />
using a household weight that takes the last-stage selection<br />
into account. MICS 3 data were recalculated using this<br />
approach. All UNICEF publications produced after 2010,<br />
including The State of the World’s <strong>Children</strong> 2013, use the<br />
revised estimates.<br />
Child labour: New data from the fourth round of MICS<br />
(MICS4, 2009–2012) included in the table have been recalculated<br />
according to the indicator definition used in MICS3<br />
surveys, to ensure cross-country comparability. In this<br />
definition, the activities of fetching water or collecting firewood<br />
are classified as household chores rather than as an<br />
economic activity. Under this approach, a child between the<br />
ages of 5–14 years old would have to be engaged in fetching<br />
water or collecting firewood for at least 28 hours per<br />
week to be considered as a child labourer.
TABLE 10. THE RATE OF pROGRESS<br />
The under-five mortality rate (U5MR) is used as the<br />
principal indicator of progress in child well-being. In 1970,<br />
around 16.9 million children under 5 years old were dying<br />
every year. In 2011, by comparison, the estimated number<br />
of children who died before their fifth birthday stood at<br />
6.9 million – highlighting a significant long-term decline<br />
in the global number of under-five deaths.<br />
u5mR has several advantages as a gauge of child<br />
well-being:<br />
• First, U5MR measures an end result of the development<br />
process rather than an ‘input’ such as school enrolment<br />
level, per capita calorie availability or number of doctors<br />
per thousand population – all of which are means to<br />
an end.<br />
• Second, U5MR is known to be the result of a wide variety<br />
of inputs: for example, antibiotics to treat pneumonia;<br />
insecticide-treated mosquito nets to prevent malaria;<br />
the nutritional well-being and health knowledge of<br />
mothers; the level of immunization and oral rehydration<br />
therapy use; the availability of maternal and child health<br />
services, including antenatal care; income and food<br />
availability in the family; the availability of safe drinking<br />
water and basic sanitation; and the overall safety of the<br />
child’s environment.<br />
• Third, U5MR is less susceptible to the fallacy of the average<br />
than, for example, per capita gross national income<br />
(GNI). This is because the natural scale does not allow<br />
the children of the rich to be one thousand times more<br />
likely to survive, even if the human-made scale does permit<br />
them to have one thousand times as much income.<br />
In other words, it is much more difficult for a wealthy<br />
minority to affect a nation’s U5MR, and this indicator<br />
therefore presents a more accurate, if far from perfect,<br />
picture of the health status of the majority of children<br />
and of society as a whole.<br />
The speed of progress in reducing U5MR can be assessed<br />
by calculating its annual rate of reduction (ARR). Unlike<br />
the comparison of absolute changes, ARR measures<br />
relative changes that reflect differences compared to the<br />
starting value.<br />
As lower levels of under-five mortality are reached, the<br />
same absolute reduction represents a greater percentage<br />
reduction. ARR therefore shows a higher rate of progress<br />
for a 10-point absolute reduction, for example, if that<br />
reduction happens at a lower level of under-five mortality<br />
versus a higher level over the same time period. A 10-point<br />
decrease in U5MR from 100 in 1990 to 90 in 2011 represents<br />
a reduction of 10 per cent, corresponding to an ARR of<br />
about 0.5 per cent, whereas the same 10-point decrease<br />
from 20 to 10 over the same period represents a reduction<br />
of 50 per cent or an ARR of 3.3 per cent. (A negative value<br />
for the percentage reduction indicates an increase in U5MR<br />
during the period specified.)<br />
When used in conjunction <strong>with</strong> gross domestic product<br />
(GDP) growth rates, U5MR and its rate of reduction can<br />
therefore give a picture of the progress being made by any<br />
country, area or region, over any period of time, towards<br />
the satisfaction of some of the most essential<br />
human needs.<br />
As Table 10 shows, there is no fixed relationship between<br />
the annual reduction rate of U5MR and the annual rate of<br />
growth in per capita GDP. Comparing these two indicators<br />
helps shed light on the relationship between economic<br />
advances and human development.<br />
Finally, the table gives the total fertility rate for each country<br />
and area and the corresponding ARR. It is clear that<br />
many of the nations that have achieved significant reductions<br />
in their U5MR have also achieved significant reductions<br />
in fertility.<br />
TABLES 12–13. EquITy<br />
Diarrhoea treatment: For the first time, these tables include<br />
diarrhoea treatment <strong>with</strong> oral rehydration salts. This replaces<br />
the indicator used in previous years, diarrhoea treatment<br />
<strong>with</strong> oral rehydration therapy and continued feeding.<br />
STATISTICAL TABLES 97
STATISTICAL TABLES<br />
Sub-Saharan Africa<br />
Eastern and Southern Africa; West and Central Africa;<br />
Djibouti; Sudan 1<br />
Eastern and Southern Africa<br />
Angola; Botswana; Burundi; Comoros; Eritrea; Ethiopia;<br />
Kenya; Lesotho; Madagascar; Malawi; Mauritius;<br />
Mozambique; Namibia; Rwanda; Seychelles; Somalia; South<br />
Africa; South Sudan 1 ; Swaziland; Uganda; United Republic of<br />
Tanzania; Zambia; Zimbabwe<br />
West and Central Africa<br />
Benin; Burkina Faso; Cameroon; Cape Verde; Central African<br />
Republic; Chad; Congo; Côte d’Ivoire; Democratic Republic<br />
of the Congo; Equatorial Guinea; Gabon; Gambia; Ghana;<br />
Guinea; Guinea-Bissau; Liberia; Mali; Mauritania; Niger;<br />
Nigeria; Sao Tome and Principe; Senegal; Sierra Leone; Togo<br />
middle East and North Africa<br />
Algeria; Bahrain; Djibouti; Egypt; Iran (Islamic Republic<br />
of); Iraq; Jordan; Kuwait; Lebanon; Libya; Morocco; Oman;<br />
Qatar; Saudi Arabia; State of Palestine; Sudan 1 ; Syrian Arab<br />
Republic; Tunisia; United Arab Emirates; Yemen<br />
South Asia<br />
Afghanistan; Bangladesh; Bhutan; India; Maldives; Nepal;<br />
Pakistan; Sri Lanka<br />
East Asia and pacific<br />
Brunei Darussalam; Cambodia; China; Cook Islands;<br />
Democratic People’s Republic of Korea; Fiji; Indonesia;<br />
Kiribati; Lao People’s Democratic Republic; Malaysia;<br />
Marshall Islands; Micronesia (Federated States of);<br />
Mongolia; Myanmar; Nauru; Niue; Palau; Papua New<br />
Guinea; Philippines; Republic of Korea; Samoa; Singapore;<br />
Solomon Islands; Thailand; Timor-Leste; Tonga; Tuvalu;<br />
Vanuatu; Viet Nam<br />
98<br />
Explanation of symbols<br />
The following symbols are common across all tables:<br />
– Data are not available.<br />
x Data refer to years or periods other than those specified in the column heading. Such data are not included in the<br />
calculation of regional and global averages, <strong>with</strong> the exception of 2005–2006 data from India.<br />
y Data differ from the standard definition or refer to only part of a country. If they fall <strong>with</strong>in the noted reference<br />
period, such data are included in the calculation of regional and global averages.<br />
* Data refer to the most recent year available during the period specified in the column heading.<br />
** Excludes China.<br />
Sources and years for specific data points are available at . Symbols that appear in specific tables<br />
are explained in the footnotes to those tables.<br />
Regional classification<br />
Averages presented at the end of each of the 14 statistical tables are calculated using data from countries and areas as<br />
classified below.<br />
THE STATE OF THE WORLD’S CHILDREN 2013: <strong>Children</strong> <strong>with</strong> <strong>Disabilities</strong><br />
Latin America and Caribbean<br />
Antigua and Barbuda; Argentina; Bahamas; Barbados;<br />
Belize; Bolivia (Plurinational State of); Brazil; Chile;<br />
Colombia; Costa Rica; Cuba; Dominica; Dominican Republic;<br />
Ecuador; El Salvador; Grenada; Guatemala; Guyana; Haiti;<br />
Honduras; Jamaica; Mexico; Nicaragua; Panama; Paraguay;<br />
Peru; Saint Kitts and Nevis; Saint Lucia; Saint Vincent and<br />
the Grenadines; Suriname; Trinidad and Tobago; Uruguay;<br />
Venezuela (Bolivarian Republic of)<br />
CEE/CIS<br />
Albania; Armenia; Azerbaijan; Belarus; Bosnia and<br />
Herzegovina; Bulgaria; Croatia; Georgia; Kazakhstan;<br />
Kyrgyzstan; Montenegro; Republic of Moldova; Romania;<br />
Russian Federation; Serbia; Tajikistan; the former Yugoslav<br />
Republic of Macedonia; Turkey; Turkmenistan; Ukraine;<br />
Uzbekistan<br />
Least developed countries/areas<br />
[Classified as such by the United Nations High<br />
Representative for the Least Developed Countries,<br />
Landlocked Developing Countries and Small Island<br />
Developing States (UN-OHRLLS)]. Afghanistan; Angola;<br />
Bangladesh; Benin; Bhutan; Burkina Faso; Burundi;<br />
Cambodia; Central African Republic; Chad; Comoros;<br />
Democratic Republic of the Congo; Djibouti; Equatorial<br />
Guinea; Eritrea; Ethiopia; Gambia; Guinea; Guinea-Bissau;<br />
Haiti; Kiribati; Lao People’s Democratic Republic;<br />
Lesotho; Liberia; Madagascar; Malawi; Mali; Mauritania;<br />
Mozambique; Myanmar; Nepal; Niger; Rwanda; Samoa;<br />
Sao Tome and Principe; Senegal; Sierra Leone; Solomon<br />
Islands; Somalia; South Sudan 1 ; Sudan 1 ; Timor-Leste; Togo;<br />
Tuvalu; Uganda; United Republic of Tanzania; Vanuatu;<br />
Yemen; Zambia
under-five mortality rankings<br />
The following list ranks countries and areas in descending order of their estimated 2011 under-five mortality<br />
rate (U5MR), a critical indicator of the well-being of children. Countries and areas are listed alphabetically in<br />
the tables on the following pages.<br />
Sierra Leone 185 1<br />
Somalia 180 2<br />
Mali 176 3<br />
Chad 169 4<br />
Democratic Republic of the Congo 168 5<br />
Central African Republic 164 6<br />
Guinea-Bissau 161 7<br />
Angola 158 8<br />
Burkina Faso 146 9<br />
Burundi 139 10<br />
Cameroon 127 11<br />
Guinea 126 12<br />
Niger 125 13<br />
Nigeria 124 14<br />
South Sudan1 121 15<br />
Equatorial Guinea 118 16<br />
Côte d’Ivoire 115 17<br />
Mauritania 112 18<br />
Togo 110 19<br />
Benin 106 20<br />
Swaziland 104 21<br />
Mozambique 103 22<br />
Afghanistan 101 23<br />
Gambia 101 23<br />
Congo 99 25<br />
Djibouti 90 26<br />
Uganda 90 26<br />
Sao Tome and Principe 89 28<br />
Lesotho 86 29<br />
Sudan1 Countries and areas<br />
Under-5<br />
mortality<br />
rate (2011)<br />
Value Rank<br />
86 29<br />
Malawi 83 31<br />
Zambia 83 31<br />
Comoros 79 33<br />
Ghana 78 34<br />
Liberia 78 34<br />
Ethiopia 77 36<br />
Yemen 77 36<br />
Kenya 73 38<br />
Pakistan 72 39<br />
Haiti 70 40<br />
Eritrea 68 41<br />
United Republic of Tanzania 68 41<br />
Zimbabwe 67 43<br />
Gabon 66 44<br />
Senegal 65 45<br />
Tajikistan 63 46<br />
Madagascar 62 47<br />
Myanmar 62 47<br />
India 61 49<br />
Papua New Guinea 58 50<br />
Bhutan 54 51<br />
Rwanda 54 51<br />
Timor-Leste 54 51<br />
Turkmenistan 53 54<br />
Bolivia (Plurinational State of) 51 55<br />
Uzbekistan 49 56<br />
Nepal 48 57<br />
Kiribati 47 58<br />
South Africa 47 58<br />
Bangladesh 46 60<br />
Azerbaijan 45 61<br />
Cambodia 43 62<br />
Lao People’s Democratic Republic 42 63<br />
Micronesia (Federated States of) 42 63<br />
Namibia 42 63<br />
Nauru 40 66<br />
Countries and areas<br />
Under-5<br />
mortality<br />
rate (2011)<br />
Value Rank<br />
Iraq 38 67<br />
Guyana 36 68<br />
Democratic People’s Republic of Korea 33 69<br />
Morocco 33 69<br />
Indonesia 32 71<br />
Kyrgyzstan 31 72<br />
Mongolia 31 72<br />
Algeria 30 74<br />
Guatemala 30 74<br />
Suriname 30 74<br />
Tuvalu 30 74<br />
Kazakhstan 28 78<br />
Trinidad and Tobago 28 78<br />
Botswana 26 80<br />
Marshall Islands 26 80<br />
Nicaragua 26 80<br />
Dominican Republic 25 83<br />
Iran (Islamic Republic of) 25 83<br />
Philippines 25 83<br />
Ecuador 23 86<br />
State of Palestine 22 87<br />
Paraguay 22 87<br />
Solomon Islands 22 87<br />
Viet Nam 22 87<br />
Cape Verde 21 91<br />
Egypt 21 91<br />
Georgia 21 91<br />
Honduras 21 91<br />
Jordan 21 91<br />
Niue 21 91<br />
Saint Vincent and the Grenadines 21 91<br />
Barbados 20 98<br />
Panama 20 98<br />
Palau 19 100<br />
Samoa 19 100<br />
Armenia 18 102<br />
Colombia 18 102<br />
Jamaica 18 102<br />
Peru 18 102<br />
Belize 17 106<br />
Bahamas 16 107<br />
Brazil 16 107<br />
Fiji 16 107<br />
Libya 16 107<br />
Mexico 16 107<br />
Republic of Moldova 16 107<br />
Saint Lucia 16 107<br />
Tunisia 16 107<br />
China 15 115<br />
El Salvador 15 115<br />
Mauritius 15 115<br />
Syrian Arab Republic 15 115<br />
Tonga 15 115<br />
Turkey 15 115<br />
Venezuela (Bolivarian Republic of) 15 115<br />
Albania 14 122<br />
Argentina 14 122<br />
Seychelles 14 122<br />
Grenada 13 125<br />
Romania 13 125<br />
Vanuatu 13 125<br />
Bulgaria 12 128<br />
Dominica 12 128<br />
Russian Federation 12 128<br />
Sri Lanka 12 128<br />
Thailand 12 128<br />
Countries and areas<br />
Under-5<br />
mortality<br />
rate (2011)<br />
Value Rank<br />
Kuwait 11 133<br />
Maldives 11 133<br />
Bahrain 10 135<br />
Cook Islands 10 135<br />
Costa Rica 10 135<br />
The former Yugoslav Republic of Macedonia 10 135<br />
Ukraine 10 135<br />
Uruguay 10 135<br />
Chile 9 141<br />
Lebanon 9 141<br />
Oman 9 141<br />
Saudi Arabia 9 141<br />
Antigua and Barbuda 8 145<br />
Bosnia and Herzegovina 8 145<br />
Latvia 8 145<br />
Qatar 8 145<br />
Slovakia 8 145<br />
United States 8 145<br />
Brunei Darussalam 7 151<br />
Malaysia 7 151<br />
Montenegro 7 151<br />
Saint Kitts and Nevis 7 151<br />
Serbia 7 151<br />
United Arab Emirates 7 151<br />
Belarus 6 157<br />
Canada 6 157<br />
Cuba 6 157<br />
Hungary 6 157<br />
Lithuania 6 157<br />
Malta 6 157<br />
New Zealand 6 157<br />
Poland 6 157<br />
Australia 5 165<br />
Croatia 5 165<br />
Republic of Korea 5 165<br />
United Kingdom 5 165<br />
Austria 4 169<br />
Belgium 4 169<br />
Czech Republic 4 169<br />
Denmark 4 169<br />
Estonia 4 169<br />
France 4 169<br />
Germany 4 169<br />
Greece 4 169<br />
Ireland 4 169<br />
Israel 4 169<br />
Italy 4 169<br />
Monaco 4 169<br />
Netherlands 4 169<br />
Spain 4 169<br />
Switzerland 4 169<br />
Andorra 3 184<br />
Cyprus 3 184<br />
Finland 3 184<br />
Iceland 3 184<br />
Japan 3 184<br />
Luxembourg 3 184<br />
Norway 3 184<br />
Portugal 3 184<br />
Singapore 3 184<br />
Slovenia 3 184<br />
Sweden 3 184<br />
San Marino 2 195<br />
Holy See – –<br />
Liechtenstein – –<br />
1 Due to the cession in July 2011 of the Republic of South Sudan by the Republic of the Sudan, and its subsequent admission to the United Nations on 14 July 2011, disaggregated data for the<br />
Sudan and South Sudan as separate States are not yet available for all indicators. Aggregated data presented are for the Sudan pre-cession, and these data are included in the averages for the<br />
Eastern and Southern Africa, Middle East and North Africa, and sub-Saharan Africa regions as well as the least developed countries/areas category. For the purposes of this report, South Sudan<br />
is designated as a least developed country.<br />
STATISTICAL TABLES 99
TABLE 1: BASIC INdICATORS<br />
Countries<br />
and areas<br />
Afghanistan 23 192 101 103 99 129 73 36 32,358 1,408 128 410 x 49 – –<br />
Albania 122 41 14 15 14 36 13 7 3,216 41 1 3,980 77 96 80<br />
Algeria 74 66 30 32 28 54 26 17 35,980 712 21 4,470 73 73 97<br />
Andorra 184 8 3 4 3 7 3 1 86 − 0 41,750 x – – 79<br />
Angola 8 243 158 165 150 144 96 43 19,618 803 120 4,060 51 70 86<br />
Antigua and Barbuda 145 27 8 9 7 23 6 4 90 − 0 12,060 – 99 88<br />
Argentina 122 28 14 16 13 24 13 8 40,765 693 10 9,740 76 98 –<br />
Armenia 102 47 18 19 15 40 16 11 3,100 47 1 3,360 74 100 –<br />
Australia 165 9 5 5 4 8 4 3 22,606 307 1 46,200 x 82 – 97<br />
Austria 169 9 4 5 4 8 4 3 8,413 74 0 48,300 81 – –<br />
Azerbaijan 61 95 45 47 43 75 39 19 9,306 184 8 5,290 71 100 85<br />
Bahamas 107 22 16 17 15 18 14 7 347 5 0 21,970 x 76 – 98<br />
Bahrain 135 21 10 10 10 18 9 4 1,324 23 0 15,920 x 75 92 –<br />
Bangladesh 60 139 46 48 44 97 37 26 150,494 3,016 134 770 69 57 –<br />
Barbados 98 18 20 22 18 16 18 10 274 3 0 12,660 x 77 – 95<br />
Belarus 157 17 6 6 5 14 4 3 9,559 107 1 5,830 70 100 92<br />
Belgium 169 10 4 5 4 9 4 2 10,754 123 1 46,160 80 – 99<br />
Belize 106 44 17 19 15 35 15 8 318 8 0 3,690 76 – 97<br />
Benin 20 177 106 109 103 107 68 31 9,100 356 36 780 56 42 94<br />
Bhutan 51 138 54 57 50 96 42 25 738 15 1 2,070 67 53 x 90<br />
Bolivia (Plurinational<br />
State of) 55 120 51 54 48 83 39 22 10,088 264 13 2,040 67 91 –<br />
Bosnia and Herzegovina 145 19 8 9 7 17 7 5 3,752 32 0 4,780 76 98 87<br />
Botswana 80 53 26 28 24 41 20 11 2,031 47 1 7,480 53 84 87<br />
Brazil 107 58 16 17 14 49 14 10 196,655 2,996 44 10,720 73 90 –<br />
Brunei Darussalam 151 12 7 8 7 9 6 4 406 8 0 31,800 x 78 95 –<br />
Bulgaria 128 22 12 13 11 19 11 7 7,446 75 1 6,550 73 98 100<br />
Burkina Faso 9 208 146 151 142 105 82 34 16,968 730 101 570 55 29 58<br />
Burundi 10 183 139 145 133 110 86 43 8,575 288 39 250 50 67 –<br />
Cambodia 62 117 43 47 37 85 36 19 14,305 317 13 830 63 74 96<br />
Cameroon 11 145 127 135 120 90 79 33 20,030 716 88 1,210 52 71 94<br />
Canada 157 8 6 6 5 7 5 4 34,350 388 2 45,560 81 – –<br />
Cape Verde 91 58 21 23 20 45 18 10 501 10 0 3,540 74 84 93<br />
Central African Republic 6 169 164 170 157 112 108 46 4,487 156 25 470 48 56 71<br />
Chad 4 208 169 177 160 113 97 42 11,525 511 79 690 50 34 –<br />
Chile 141 19 9 10 8 16 8 5 17,270 245 2 12,280 79 99 94<br />
China 115 49 15 15 14 39 13 9 1,347,565 16,364 249 4,930 73 94 100 z<br />
Colombia 102 34 18 20 16 28 15 11 46,927 910 16 6,110 74 93 92<br />
Comoros 33 122 79 85 74 86 59 32 754 28 2 770 61 75 –<br />
Congo 25 119 99 103 94 75 64 32 4,140 145 14 2,270 57 – 91<br />
Cook Islands 135 19 10 11 8 16 8 5 20 − 0 − – – 98<br />
Costa Rica 135 17 10 11 9 15 9 6 4,727 73 1 7,660 79 96 –<br />
Côte d’Ivoire 17 151 115 125 105 104 81 41 20,153 679 75 1,100 55 56 61<br />
Croatia 165 13 5 6 5 11 4 3 4,396 43 0 13,850 77 99 96<br />
Cuba 157 13 6 6 5 11 5 3 11,254 110 1 5,460 x 79 100 100<br />
Cyprus 184 11 3 3 3 10 3 1 1,117 13 0 29,450 x 80 98 99<br />
Czech Republic 169 14 4 4 4 13 3 2 10,534 116 0 18,520 78 – –<br />
Democratic People’s<br />
Republic of Korea 69 45 33 35 32 23 26 18 24,451 348 12 d 69 100 –<br />
Democratic Republic<br />
of the Congo 5 181 168 178 158 117 111 47 67,758 2,912 465 190 48 67 –<br />
Denmark 169 9 4 4 3 7 3 2 5,573 64 0 60,390 79 – 96<br />
Djibouti 26 122 90 95 84 94 72 33 906 26 2 1,270 x 58 – 45<br />
Dominica 128 17 12 13 11 14 11 8 68 − 0 7,090 – – 98<br />
Dominican Republic 83 58 25 27 23 45 21 14 10,056 216 5 5,240 73 90 93<br />
Ecuador 86 52 23 25 21 41 20 10 14,666 298 7 4,140 76 92 98<br />
Egypt 91 86 21 22 20 63 18 7 82,537 1,886 40 2,600 73 72 96<br />
El Salvador 115 60 15 17 14 47 13 6 6,227 126 2 3,480 72 84 95<br />
Equatorial Guinea 16 190 118 124 112 118 80 37 720 26 3 14,540 51 94 56<br />
Eritrea 41 138 68 74 61 86 46 22 5,415 193 13 430 62 68 35<br />
Estonia 169 20 4 4 3 16 3 2 1,341 16 0 15,200 75 100 96<br />
Ethiopia 36 198 77 82 72 118 52 31 84,734 2,613 194 400 59 39 82<br />
Fiji 107 30 16 18 15 25 14 8 868 18 0 3,680 69 – 99<br />
Finland 184 7 3 3 3 6 2 2 5,385 61 0 48,420 80 – 98<br />
France 169 9 4 5 4 7 3 2 63,126 792 3 42,420 82 – 99<br />
Gabon 44 94 66 72 59 69 49 25 1,534 42 3 7,980 63 88 –<br />
100<br />
Under-5<br />
mortality<br />
rank<br />
Under-5 mortality rate<br />
(U5MR)<br />
U5MR by sex<br />
2011<br />
Infant mortality rate<br />
(under 1)<br />
1990 2011 male female 1990 2011<br />
Neonatal<br />
mortality<br />
rate<br />
2011<br />
Total<br />
population<br />
(thousands)<br />
2011<br />
THE STATE OF THE WORLD’S CHILDREN 2013: <strong>Children</strong> <strong>with</strong> <strong>Disabilities</strong><br />
Annual no.<br />
of births<br />
(thousands)<br />
2011<br />
Annual no.<br />
of under-5<br />
deaths<br />
(thousands)<br />
2011<br />
GNI per<br />
capita (US$)<br />
2011<br />
Life<br />
expectancy<br />
at birth<br />
(years)<br />
2011<br />
Total adult<br />
literacy rate<br />
(%)<br />
2007–2011*<br />
Primary<br />
school net<br />
enrolment<br />
ratio (%)<br />
2008–2011*
Countries<br />
and areas<br />
Under-5<br />
mortality<br />
rank<br />
Under-5 mortality rate<br />
(U5MR)<br />
U5MR by sex<br />
2011<br />
Infant mortality rate<br />
(under 1)<br />
1990 2011 male female 1990 2011<br />
TABLE 1 BASIC INdICATORS<br />
Gambia 23 165 101 107 94 78 58 34 1,776 67 6 610 58 50 69<br />
Georgia 91 47 21 23 18 40 18 15 4,329 51 1 2,860 74 100 100<br />
Germany 169 9 4 4 4 7 3 2 82,163 699 3 43,980 80 – 100<br />
Ghana 34 121 78 83 72 76 52 30 24,966 776 60 1,410 64 67 84<br />
Greece 169 13 4 5 4 12 4 3 11,390 117 1 25,030 80 97 –<br />
Grenada 125 21 13 13 12 17 10 7 105 2 0 7,220 76 – 97<br />
Guatemala 74 78 30 33 28 56 24 15 14,757 473 14 2,870 71 75 99<br />
Guinea 12 228 126 128 123 135 79 39 10,222 394 48 440 54 41 77<br />
Guinea-Bissau 7 210 161 174 147 125 98 44 1,547 59 9 600 48 54 75<br />
Guyana 68 63 36 40 32 48 29 20 756 13 0 2,900 x 70 – 84<br />
Haiti 40 143 70 74 66 99 53 25 10,124 266 19 700 62 49 x –<br />
Holy See – – – – – – – – 0 – – – – – –<br />
Honduras 91 55 21 23 20 43 18 11 7,755 205 4 1,970 73 85 96<br />
Hungary 157 19 6 7 6 17 5 4 9,966 100 1 12,730 74 99 98<br />
Iceland 184 6 3 3 2 5 2 1 324 5 0 35,020 82 – 99<br />
India 49 114 61 59 64 81 47 32 1,241,492 27,098 1,655 1,410 65 63 98<br />
Indonesia 71 82 32 34 29 54 25 15 242,326 4,331 134 2,940 69 93 99<br />
Iran (Islamic Republic of) 83 61 25 25 25 47 21 14 74,799 1,255 33 4,520 x 73 85 –<br />
Iraq 67 46 38 41 35 37 31 20 32,665 1,144 42 2,640 69 78 –<br />
Ireland 169 9 4 4 4 8 3 2 4,526 72 0 38,580 81 – 100<br />
Israel 169 12 4 5 4 10 4 2 7,562 156 1 28,930 82 – 97<br />
Italy 169 10 4 4 3 8 3 2 60,789 557 2 35,330 82 99 99<br />
Jamaica 102 35 18 21 16 28 16 11 2,751 50 1 4,980 73 87 82<br />
Japan 184 6 3 4 3 5 2 1 126,497 1,073 4 45,180 83 – 100<br />
Jordan 91 37 21 22 19 31 18 12 6,330 154 3 4,380 73 93 91<br />
Kazakhstan 78 57 28 32 24 48 25 14 16,207 345 11 8,220 67 100 100<br />
Kenya 38 98 73 78 67 64 48 27 41,610 1,560 107 820 57 87 84<br />
Kiribati 58 88 47 50 45 64 38 19 101 – 0 2,110 – – –<br />
Kuwait 133 17 11 12 10 14 9 5 2,818 50 1 48,900 x 75 94 98<br />
Kyrgyzstan 72 70 31 34 28 58 27 16 5,393 131 4 920 68 99 95<br />
Lao People’s<br />
Democratic Republic 63 148 42 44 39 102 34 18 6,288 140 6 1,130 67 73 x 97<br />
Latvia 145 21 8 9 8 17 7 5 2,243 24 0 12,350 73 100 96<br />
Lebanon 141 33 9 10 9 27 8 5 4,259 65 1 9,110 73 90 93<br />
Lesotho 29 88 86 93 79 71 63 39 2,194 60 5 1,220 48 90 74<br />
Liberia 34 241 78 83 74 161 58 27 4,129 157 12 240 57 61 –<br />
Libya 107 44 16 17 16 33 13 10 6,423 144 2 12,320 x 75 89 –<br />
Liechtenstein – – – – – – – – 36 – – 137,070 x – – 99<br />
Lithuania 157 17 6 6 5 14 5 3 3,307 35 0 12,280 72 100 96<br />
Luxembourg 184 8 3 3 3 7 2 2 516 6 0 78,130 80 – 97<br />
Madagascar 47 161 62 65 58 98 43 23 21,315 747 45 430 67 64 –<br />
Malawi 31 227 83 87 79 134 53 27 15,381 686 52 340 54 75 97<br />
Malaysia 151 17 7 7 6 15 6 3 28,859 579 4 8,420 74 93 –<br />
Maldives 133 105 11 12 10 76 9 7 320 5 0 6,530 77 98 x 97<br />
Mali 3 257 176 182 169 132 98 49 15,840 728 121 610 51 31 66<br />
Malta 157 11 6 7 5 10 5 4 418 4 0 18,620 x 80 92 x 94<br />
Marshall Islands 80 52 26 29 23 41 22 12 55 − 0 3,910 – – 99<br />
Mauritania 18 125 112 120 104 81 76 40 3,542 118 13 1,000 59 58 74<br />
Mauritius 115 24 15 16 14 21 13 9 1,307 16 0 8,240 73 89 93<br />
Mexico 107 49 16 17 14 38 13 7 114,793 2,195 34 9,240 77 93 100<br />
Micronesia<br />
(Federated States of) 63 56 42 47 36 44 34 17 112 3 0 2,900 69 – –<br />
Monaco 169 8 4 4 3 6 3 2 35 − 0 183,150 x – – –<br />
Mongolia 72 107 31 35 26 76 26 12 2,800 65 2 2,320 68 97 99<br />
Montenegro 151 18 7 8 7 16 7 5 632 8 0 7,060 75 98 83<br />
Morocco 69 81 33 35 30 64 28 19 32,273 620 21 2,970 72 56 94<br />
Mozambique 22 226 103 107 99 151 72 34 23,930 889 86 470 50 56 92<br />
Myanmar 47 107 62 69 56 77 48 30 48,337 824 53 d 65 92 –<br />
Namibia 63 73 42 45 38 49 30 18 2,324 60 2 4,700 62 89 86<br />
Nauru 66 40 40 56 24 32 32 22 10 − 0 − – – –<br />
Nepal 57 135 48 49 47 94 39 27 30,486 722 34 540 69 60 –<br />
Netherlands 169 8 4 4 4 7 3 3 16,665 181 1 49,730 81 – 100<br />
New Zealand 157 11 6 7 5 9 5 3 4,415 64 0 29,350 x 81 – 99<br />
Nicaragua 80 66 26 29 22 50 22 13 5,870 138 4 1,170 74 78 x 94<br />
Niger 13 314 125 127 122 133 66 32 16,069 777 89 360 55 29 x 58<br />
Neonatal<br />
mortality<br />
rate<br />
2011<br />
Total<br />
population<br />
(thousands)<br />
2011<br />
Annual no.<br />
of births<br />
(thousands)<br />
2011<br />
Annual no.<br />
of under-5<br />
deaths<br />
(thousands)<br />
2011<br />
GNI per<br />
capita (US$)<br />
2011<br />
Life<br />
expectancy<br />
at birth<br />
(years)<br />
2011<br />
Total adult<br />
literacy rate<br />
(%)<br />
2007–2011*<br />
Primary<br />
school net<br />
enrolment<br />
ratio (%)<br />
2008–2011*<br />
STATISTICAL TABLES 101
TABLE 1 BASIC INdICATORS<br />
Countries<br />
and areas<br />
Nigeria 14 214 124 129 119 127 78 39 162,471 6,458 756 1,200 52 61 58<br />
Niue 91 14 21 21 21 12 18 10 1 – 0 – – – –<br />
Norway 184 8 3 3 3 7 3 2 4,925 61 0 88,890 81 – 99<br />
Oman 141 48 9 9 8 36 7 5 2,846 50 0 19,260 x 73 87 98<br />
Pakistan 39 122 72 76 68 95 59 36 176,745 4,764 352 1,120 65 55 74<br />
Palau 100 32 19 23 14 27 14 9 21 – 0 7,250 – – –<br />
Panama 98 33 20 21 18 26 17 9 3,571 70 1 7,910 76 94 99<br />
Papua New Guinea 50 88 58 60 55 64 45 23 7,014 208 12 1,480 63 61 –<br />
Paraguay 87 53 22 25 20 41 19 13 6,568 158 3 2,970 72 94 86<br />
Peru 102 75 18 20 17 54 14 9 29,400 591 11 5,500 74 90 98<br />
Philippines 83 57 25 29 22 40 20 12 94,852 2,358 57 2,210 69 95 89<br />
Poland 157 17 6 6 5 15 5 4 38,299 410 2 12,480 76 100 96<br />
Portugal 184 15 3 4 3 11 3 2 10,690 97 0 21,250 79 95 99<br />
Qatar 145 20 8 8 7 17 6 4 1,870 21 0 80,440 78 96 96<br />
Republic of Korea 165 8 5 5 4 6 4 2 48,391 479 3 20,870 81 – 99<br />
Republic of Moldova 107 35 16 17 15 29 14 8 3,545 44 1 1,980 69 99 90<br />
Romania 125 37 13 14 11 31 11 8 21,436 221 3 7,910 74 98 88<br />
Russian Federation 128 27 12 13 10 23 10 7 142,836 1,689 20 10,400 69 100 96<br />
Rwanda 51 156 54 57 51 95 38 21 10,943 449 23 570 55 71 99<br />
Saint Kitts and Nevis 151 28 7 8 6 22 6 5 53 – 0 12,480 – – 86<br />
Saint Lucia 107 23 16 17 14 18 14 9 176 3 0 6,680 75 – 90<br />
Saint Vincent and<br />
the Grenadines 91 27 21 23 19 21 20 13 109 2 0 6,100 72 – 98<br />
Samoa 100 30 19 21 16 25 16 8 184 4 0 3,190 72 99 95<br />
San Marino 195 12 2 2 2 11 2 1 32 – 0 50,400 x – – 92<br />
Sao Tome and Principe 28 96 89 92 86 62 58 29 169 5 0 1,360 65 89 99<br />
Saudi Arabia 141 43 9 10 8 34 8 5 28,083 605 6 17,820 74 87 90<br />
Senegal 45 136 65 69 60 69 47 26 12,768 471 30 1,070 59 50 78<br />
Serbia 151 29 7 8 6 25 6 4 9,854 110 1 5,680 75 98 95<br />
Seychelles 122 17 14 15 13 14 12 9 87 − 0 11,130 – 92 –<br />
Sierra Leone 1 267 185 194 176 158 119 49 5,997 227 42 340 48 42 –<br />
Singapore 184 8 3 3 2 6 2 1 5,188 47 0 42,930 81 96 –<br />
Slovakia 145 18 8 9 7 16 7 4 5,472 58 0 16,070 75 – –<br />
Slovenia 184 10 3 3 3 9 2 2 2,035 20 0 23,610 79 100 97<br />
Solomon Islands 87 42 22 21 22 34 18 11 552 17 0 1,110 68 – –<br />
Somalia 2 180 180 190 170 108 108 50 9,557 416 71 d 51 – –<br />
South Africa 58 62 47 50 44 48 35 19 50,460 1,052 47 6,960 53 89 90<br />
South Sudan s 15 217 121 122 119 129 76 38 10,314 − 43 a – – –<br />
Spain 169 11 4 5 4 9 4 3 46,455 499 2 30,990 81 98 100<br />
Sri Lanka 128 29 12 13 11 24 11 8 21,045 373 5 2,580 75 91 94<br />
State of Palestine 87 43 22 23 21 36 20 13 4,152 137 3 a 73 95 89<br />
Sudan s 29 123 86 91 81 77 57 31 34,318 − 95 − – – –<br />
Suriname 74 52 30 33 26 44 26 16 529 10 0 7,640 x 71 95 91<br />
Swaziland 21 83 104 113 94 61 69 35 1,203 35 4 3,300 49 87 86<br />
Sweden 184 7 3 3 3 6 2 2 9,441 113 0 53,230 81 – 99<br />
Switzerland 169 8 4 5 4 7 4 3 7,702 77 0 76,380 82 – 99<br />
Syrian Arab Republic 115 36 15 16 14 30 13 9 20,766 466 7 2,750 x 76 83 99<br />
Tajikistan 46 114 63 70 56 89 53 25 6,977 194 12 870 68 100 98<br />
Thailand 128 35 12 13 11 29 11 8 69,519 824 10 4,420 74 94 x 90<br />
The former Yugoslav<br />
Republic of Macedonia 135 38 10 11 9 34 9 6 2,064 22 0 4,730 75 97 98<br />
Timor-Leste 51 180 54 57 51 135 46 24 1,154 44 2 2,730 x 62 58 86<br />
Togo 19 147 110 118 102 85 73 36 6,155 195 21 560 57 57 94<br />
Tonga 115 25 15 18 13 21 13 8 105 3 0 3,580 72 99 x –<br />
Trinidad and Tobago 78 37 28 31 24 32 25 18 1,346 20 1 15,040 70 99 97<br />
Tunisia 107 51 16 18 15 40 14 10 10,594 179 3 4,070 75 78 99<br />
Turkey 115 72 15 16 14 60 12 9 73,640 1,289 20 10,410 74 91 97<br />
Turkmenistan 54 94 53 57 48 75 45 22 5,105 109 5 4,110 65 100 –<br />
Tuvalu 74 58 30 33 27 45 25 14 10 − 0 5,010 – – –<br />
Uganda 26 178 90 97 83 106 58 28 34,509 1,545 131 510 54 73 91<br />
Ukraine 135 19 10 11 9 17 9 5 45,190 494 5 3,120 68 100 91<br />
United Arab Emirates 151 22 7 7 6 19 6 4 7,891 94 1 40,760 77 90 x –<br />
United Kingdom 165 9 5 6 5 8 4 3 62,417 761 4 37,780 80 – 100<br />
United Republic<br />
of Tanzania 41 158 68 70 65 97 45 25 46,218 1,913 122 540 58 73 98<br />
United States 145 11 8 8 7 9 6 4 313,085 4,322 32 48,450 79 – 96<br />
102<br />
Under-5<br />
mortality<br />
rank<br />
Under-5 mortality rate<br />
(U5MR)<br />
U5MR by sex<br />
2011<br />
Infant mortality rate<br />
(under 1)<br />
1990 2011 male female 1990 2011<br />
Neonatal<br />
mortality<br />
rate<br />
2011<br />
Total<br />
population<br />
(thousands)<br />
2011<br />
THE STATE OF THE WORLD’S CHILDREN 2013: <strong>Children</strong> <strong>with</strong> <strong>Disabilities</strong><br />
Annual no.<br />
of births<br />
(thousands)<br />
2011<br />
Annual no.<br />
of under-5<br />
deaths<br />
(thousands)<br />
2011<br />
GNI per<br />
capita (US$)<br />
2011<br />
Life<br />
expectancy<br />
at birth<br />
(years)<br />
2011<br />
Total adult<br />
literacy rate<br />
(%)<br />
2007–2011*<br />
Primary<br />
school net<br />
enrolment<br />
ratio (%)<br />
2008–2011*
Countries<br />
and areas<br />
Under-5<br />
mortality<br />
rank<br />
Under-5 mortality rate<br />
(U5MR)<br />
U5MR by sex<br />
2011<br />
Infant mortality rate<br />
(under 1)<br />
1990 2011 male female 1990 2011<br />
Uruguay 135 23 10 11 9 20 9 5 3,380 49 1 11,860 77 98 99<br />
Uzbekistan 56 75 49 55 42 62 42 15 27,760 589 30 1,510 68 99 92<br />
Vanuatu 125 39 13 14 12 31 11 7 246 7 0 2,870 71 83 –<br />
Venezuela<br />
(Bolivarian Republic of) 115 31 15 17 13 26 13 8 29,437 598 9 11,920 74 96 95<br />
Viet Nam 87 50 22 25 19 36 17 12 88,792 1,458 32 1,260 75 93 98<br />
Yemen 36 126 77 80 73 89 57 32 24,800 940 70 1,070 65 64 78<br />
Zambia 31 193 83 86 80 114 53 27 13,475 622 46 1,160 49 71 93<br />
Zimbabwe 43 79 67 73 61 53 43 30 12,754 377 24 640 51 – –<br />
MEMORANDUM<br />
Sudan and<br />
South Sudan s – – – – – – – – – 1,447 – 1,300 x 61 – –<br />
SUMMARY INDICATORS #<br />
Sub-Saharan Africa 178 109 114 103 107 69 34 876,497 32,584 3,370 1,269 55 63 76<br />
Eastern and<br />
Southern Africa 162 84 89 79 100 55 29 418,709 14,399 1,177 1,621 56 68 86<br />
West and<br />
Central Africa 197 132 138 126 116 83 39 422,564 16,712 2,096 937 53 57 67<br />
Middle East and<br />
North Africa 72 36 38 34 54 28 16 415,633 10,017 351 6,234 71 77 90<br />
South Asia 119 62 61 63 85 48 32 1,653,679 37,402 2,309 1,319 66 62 92<br />
East Asia and Pacific 55 20 21 19 41 17 11 2,032,532 28,448 590 4,853 73 94 96<br />
Latin America<br />
and Caribbean 53 19 21 17 42 16 10 591,212 10,790 203 8,595 74 91 95<br />
CEE/CIS 48 21 23 19 40 18 10 405,743 5,823 125 7,678 70 98 95<br />
Least developed<br />
countries 171 98 102 93 107 65 33 851,103 28,334 2,649 695 59 60 80<br />
World 87 51 53 50 61 37 22 6,934,761 135,056 6,914 9,513 69 84 91<br />
s Due to the cession in July 2011 of the Republic of South Sudan by the Republic of the Sudan, and its subsequent admission to the United Nations on 14 July 2011, disaggregated data for the Sudan<br />
and South Sudan as separate States are not yet available for all indicators. Aggregated data presented are for the Sudan pre-cession (see Memorandum item).<br />
# For a complete list of countries and areas in the regions, subregions and country categories, see page 98.<br />
DEFINITIONS OF THE INDICATORS<br />
Under-5 mortality rate – Probability of dying between birth and exactly 5 years of age,<br />
expressed per 1,000 live births.<br />
Infant mortality rate – Probability of dying between birth and exactly 1 year of age, expressed<br />
per 1,000 live births.<br />
Neonatal mortality rate – Probability of dying during the first 28 completed days of life,<br />
expressed per 1,000 live births.<br />
GNI per capita – Gross national income (GNI) is the sum of value added by all resident<br />
producers, plus any product taxes (less subsidies) not included in the valuation of output, plus<br />
net receipts of primary income (compensation of employees and property income) from abroad.<br />
GNI per capita is GNI divided by midyear population. GNI per capita in US dollars is converted<br />
using the World Bank Atlas method.<br />
Life expectancy at birth – Number of years newborn children would live if subject to the<br />
mortality risks prevailing for the cross section of population at the time of their birth.<br />
Total adult literacy rate – Number of literate persons aged 15 and above, expressed as a<br />
percentage of the total population in that age group.<br />
Primary school net enrolment ratio – Number of children enrolled in primary or secondary<br />
school who are of official primary school age, expressed as a percentage of the total number of<br />
children of official primary school age. Because of the inclusion of primary-school-aged children<br />
enrolled in secondary school, this indicator can also be referred to as a primary adjusted net<br />
enrolment ratio.<br />
Neonatal<br />
mortality<br />
rate<br />
2011<br />
Total<br />
population<br />
(thousands)<br />
2011<br />
Annual no.<br />
of births<br />
(thousands)<br />
2011<br />
Annual no.<br />
of under-5<br />
deaths<br />
(thousands)<br />
2011<br />
TABLE 1 BASIC INdICATORS<br />
GNI per<br />
capita (US$)<br />
2011<br />
Life<br />
expectancy<br />
at birth<br />
(years)<br />
2011<br />
Total adult<br />
literacy rate<br />
(%)<br />
2007–2011*<br />
Primary<br />
school net<br />
enrolment<br />
ratio (%)<br />
2008–2011*<br />
MAIN DATA SOURCES<br />
Under-5 and infant mortality rates – United Nations Inter-agency Group for Child Mortality<br />
Estimation (UNICEF, World Health Organization, United Nations Population Division and the<br />
World Bank).<br />
Neonatal mortality rate – World Health Organization, using civil registrations, surveillance<br />
systems and household surveys.<br />
Total population and births – United Nations Population Division.<br />
Under-5 deaths – United Nations Inter-agency Group for Child Mortality Estimation (UNICEF,<br />
World Health Organization, United Nations Population Division and the World Bank).<br />
GNI per capita – The World Bank.<br />
Life expectancy at birth – United Nations Population Division.<br />
Total adult literacy rate and primary school net enrolment ratio – UNESCO Institute for<br />
Statistics.<br />
NOTES<br />
a low-income country (GNI per capita is $1,025 or less).<br />
b lower-middle-income country (GNI per capita is $1,026 to $4,035).<br />
c upper-middle-income country (GNI per capita is $4,036 to $12,475).<br />
d high-income country (GNI per capita is $12,476 or more).<br />
− Data not available.<br />
x Data refer to years or periods other than those specified in the column heading. Such data<br />
are not included in the calculation of regional and global averages.<br />
z Data provided by the Chinese Ministry of Education. The UNESCO Institute for Statistics<br />
dataset does not currently include net enrolment rates for China.<br />
* Data refer to the most recent year available during the period specified in the column heading.<br />
STATISTICAL TABLES 103
TABLE 2: NuTRITION<br />
Countries<br />
and areas<br />
Afghanistan – – – 29 x 54 x 33 x 12 x 59 x 9 x 5 x 100 28 x<br />
Albania 7 x 43 39 78 31 5 2 19 9 23 – 76 y<br />
Algeria 6 x 50 x 7 x 39 x, y 22 x 3 x 1 x 15 x 4 x 13 x – 61 x<br />
Andorra – – – – – – – – – – – –<br />
Angola 12 x 55 11 x 77 x 37 x 16 y 7 y 29 y 8 y – 55 45<br />
Antigua and Barbuda 5 – – – – – – – – – – –<br />
Argentina 7 – – – 28 2 x 0 x 8 x 1 x 10 x – –<br />
Armenia 7 36 35 48 y 23 5 1 19 4 17 – 97 x<br />
Australia 7 x – – – – – – – – – – –<br />
Austria 7 x – – – – – – – – – – –<br />
Azerbaijan 10 x 32 x 12 x 83 x 16 x 8 x 2 x 25 x 7 x 14 x – 54 x<br />
Bahamas 11 – – – – – – – – – – –<br />
Bahrain – – – – – – – – – – – –<br />
Bangladesh 22 x 36 x 64 71 90 36 10 41 16 2 94 84 x<br />
Barbados 12 – – – – – – – – – – –<br />
Belarus 4 x 21 x 9 x 38 x 4 x 1 x 1 x 4 x 2 x 10 x – 94 y<br />
Belgium – – – – – – – – – – – –<br />
Belize 14 51 x 10 x – 27 x 4 x 1 x 22 x 2 x 14 x – –<br />
Benin 15 x 32 43 x 76 y 92 18 x 5 x 43 x 8 x 11 x 98 86<br />
Bhutan 10 59 49 67 66 13 3 34 6 8 – 96 x<br />
Bolivia (Plurinational<br />
State of) 6 64 60 83 40 4 1 27 1 9 21 89 y<br />
Bosnia and Herzegovina 5 x 57 x 18 x 29 x 10 x 1 x 0 x 10 x 4 x 26 x – 62 x<br />
Botswana 13 40 20 46 y 6 11 4 31 7 11 75 65<br />
Brazil 8 43 x 41 y 70 x 25 x 2 x – 7 x 2 x 7 – 96 x<br />
Brunei Darussalam – – – – – – – – – – – –<br />
Bulgaria 9 – – – – – – – – 14 x – 100 x<br />
Burkina Faso 16 x 20 x 25 61 80 26 7 35 11 – 87 34 x<br />
Burundi 11 x – 69 70 y 79 29 8 58 6 3 83 98 x<br />
Cambodia 11 65 74 82 y 43 28 7 40 11 2 92 83 y<br />
Cameroon 11 x 20 x 20 63 x, y 24 15 5 33 6 6 – 49 x<br />
Canada 6 x – – – – – – – – – – –<br />
Cape Verde 6 x 73 x 60 x 80 x 13 x – – – – – – 75<br />
Central African Republic 14 43 34 56 x, y 32 24 8 41 7 2 0 65<br />
Chad 20 29 3 46 59 30 13 39 16 3 – 54<br />
Chile 6 – – – – – – – – 10 – –<br />
China 3 41 28 43 y – 4 – 10 3 7 – 97 y<br />
Colombia 6 x 57 43 86 33 3 1 13 1 5 – –<br />
Comoros 25 x 25 x 21 x 34 x 45 x – – – – 22 x – 82 x<br />
Congo 13 x 39 x 19 x 78 x 21 x 11 x 3 x 30 x 8 x 9 x – 82 x<br />
Cook Islands 3 x – – – – – – – – – – –<br />
Costa Rica 7 – 15 x 92 40 1 – 6 1 8 – –<br />
Côte d’Ivoire 17 x 25 x 4 x 51 x 37 x 16 y 5 y 27 y 5 y – 100 84 x<br />
Croatia 5 x – – – – – – – – – – –<br />
Cuba 5 70 x 49 77 17 – – – – – – 88 x<br />
Cyprus – – – – – – – – – – – –<br />
Czech Republic 7 x – – – – – – – – 4 x – –<br />
Democratic People’s<br />
Republic of Korea 6 18 65 x 31 x 36 19 4 32 5 – 100 25 y<br />
Democratic Republic<br />
of the Congo 10 43 37 52 53 24 8 43 9 – 98 59<br />
Denmark 5 x – – – – – – – – – – –<br />
Djibouti 10 x 67 1 x 35 x 18 x 23 y 5 y 31 y 10 y 10 x 95 0 x<br />
Dominica 10 – – – – – – – – – – –<br />
Dominican Republic 11 65 8 88 12 3 0 10 2 8 – 19 x<br />
Ecuador 8 – 40 x 77 x 23 x 6 x – – – 5 x – –<br />
Egypt 13 56 53 70 35 6 1 29 7 21 – 79<br />
El Salvador 9 33 31 72 y 54 6 y 1 y 19 y 1 y 6 – 62 x<br />
Equatorial Guinea 13 x – 24 x – – 11 x – 35 x 3 x 8 x – 33 x<br />
Eritrea 14 x 78 x 52 x 43 x 62 x 35 x 13 x 44 x 15 x 2 x 46 68 x<br />
Estonia 4 x – – – – – – – – – – –<br />
Ethiopia 20 x 52 52 55 x 82 29 9 44 10 2 71 15 y<br />
Fiji 10 x 57 x 40 x – – – – – – – – –<br />
Finland 4 x – – – – – – – – – – –<br />
France – – – – – – – – – – – –<br />
104<br />
Low<br />
birthweight<br />
(%)<br />
2007–2011*<br />
Early<br />
initiation of<br />
breastfeeding<br />
(%)<br />
2007–2011*<br />
Introduction<br />
Exclusive<br />
breastfeeding<br />
of solid,<br />
semi-solid or<br />
Countries<br />
and areas<br />
Low<br />
birthweight<br />
(%)<br />
2007–2011*<br />
Early<br />
initiation of<br />
breastfeeding<br />
(%)<br />
2007–2011*<br />
Introduction<br />
Exclusive<br />
breastfeeding<br />
of solid,<br />
semi-solid or<br />
TABLE 2 NuTRITION<br />
Countries<br />
and areas<br />
Niger 27 x 42 27 65 y – 39 y 12 y 51 y 12 y 4 x 95 32<br />
Nigeria 12 38 13 76 32 23 9 41 14 11 73 97 x<br />
Niue 0 x – – – – – – – – – – –<br />
Norway 5 x – – – – – – – – – – –<br />
Oman 12 85 x – 91 x 73 x 9 1 10 7 2 – 69 x<br />
Pakistan 32 29 37 36 y 55 32 12 44 15 6 90 69<br />
Palau – – – – – – – – – – – –<br />
Panama 10 x – – – – 4 y – 19 y 1 y – – –<br />
Papua New Guinea 11 x – 56 x 76 x, y 72 x 18 x 5 x 43 x 5 x 3 x 12 92 x<br />
Paraguay 6 47 24 67 y 14 3 x – 18 x 1 x 7 x – 93<br />
Peru 8 51 71 82 55 y 4 1 20 0 – – 91<br />
Philippines 21 54 34 90 34 22 y – 32 y 7 y 3 91 45 x<br />
Poland 6 x – – – – – – – – – – –<br />
Portugal 8 x – – – – – – – – – – –<br />
Qatar – – – – – – – – – – – –<br />
Republic of Korea 4 x – – – – – – – – – – –<br />
Republic of Moldova 6 x 65 x 46 x 18 x 2 x 3 x 1 x 10 x 5 x 9 x – 60 x<br />
Romania 8 x – 16 x 41 x – 4 x 1 x 13 x 4 x 8 x – 74 x<br />
Russian Federation 6 – – – – – – – – – – 35 x<br />
Rwanda 7 71 85 79 84 11 2 44 3 7 76 99<br />
Saint Kitts and Nevis 8 – – – – – – – – – – 100 x<br />
Saint Lucia 11 – – – – – – – – – – –<br />
Saint Vincent and<br />
the Grenadines 8 – – – – – – – – – – –<br />
Samoa 10 88 51 71 y 74 – – – – – – –<br />
San Marino – – – – – – – – – – – –<br />
Sao Tome and Principe 8 x 45 51 74 20 13 3 29 11 12 44 86<br />
Saudi Arabia – – – – – – – – – 6 x – –<br />
Senegal 19 23 x 39 61 x 51 18 5 27 10 3 – 47<br />
Serbia 5 8 14 84 15 2 1 7 4 16 – 32<br />
Seychelles – – – – – – – – – – – –<br />
Sierra Leone 11 45 32 25 48 22 8 44 9 10 99 63<br />
Singapore 8 x – – – – 3 x 0 x 4 x 4 x 3 x – –<br />
Slovakia 7 x – – – – – – – – – – –<br />
Slovenia – – – – – – – – – – – –<br />
Solomon Islands 13 75 74 81 y 67 12 2 33 4 3 – –<br />
Somalia – 26 x 9 x 16 x 35 x 32 x 12 x 42 x 13 x 5 x 12 1 x<br />
South Africa – 61 x 8 x 49 x 31 x 9 – 24 5 – 44 –<br />
South Sudan s – – 45 21 38 28 12 31 23 – – 54<br />
Spain – – – – – – – – – – – –<br />
Sri Lanka 17 80 76 87 y 84 21 4 17 15 1 – 92 y<br />
State of Palestine 7 x – 27 x – – – – – – – – 86 x<br />
Sudan s – – 41 51 40 32 13 35 16 – – 10<br />
Suriname 11 x 34 x 2 x 58 x 15 x 7 x 1 x 11 x 5 x 4 x – –<br />
Swaziland 9 55 44 66 11 6 1 31 1 11 41 52<br />
Sweden – – – – – – – – – – – –<br />
Switzerland – – – – – – – – – – – –<br />
Syrian Arab Republic 10 46 43 – 25 10 – 28 12 18 – 79 x<br />
Tajikistan 10 x 57 y 25 x 15 x 34 x 15 6 39 7 – 99 62<br />
Thailand 7 50 x 15 – – 7 x 1 x 16 x 5 x 8 x – 47 x<br />
The former Yugoslav<br />
Republic of Macedonia 6 21 23 41 13 1 0 5 2 16 x – 94 x<br />
Timor-Leste 12 x 82 52 82 33 45 15 58 19 6 59 60<br />
Togo 11 46 62 44 64 17 4 30 5 2 22 32<br />
Tonga 3 x – – – – – – – – – – –<br />
Trinidad and Tobago 19 x 41 x 13 x 83 x 22 x – – – – 5 x – 28 x<br />
Tunisia 5 x 87 x 6 x 61 x, y 15 x 3 x – 9 x 3 x 9 x – 97 x<br />
Turkey 11 39 42 68 y 22 2 0 12 1 – – 69<br />
Turkmenistan 4 x 60 x 11 x 54 x 37 x 8 x 2 x 19 x 7 x – – 87 x<br />
Tuvalu 6 15 35 40 y 51 2 0 10 3 6 – –<br />
Uganda 14 x 42 x 62 75 x 46 14 3 33 5 3 60 96 x<br />
Ukraine 4 41 18 86 6 – – – – – – 18 x<br />
United Arab Emirates – – – – – – – – – – – –<br />
United Kingdom 8 x – – – – – – – – – – –<br />
106<br />
Low<br />
birthweight<br />
(%)<br />
2007–2011*<br />
Early<br />
initiation of<br />
breastfeeding<br />
(%)<br />
2007–2011*<br />
Introduction<br />
Exclusive<br />
breastfeeding<br />
of solid,<br />
semi-solid or<br />
Countries<br />
and areas<br />
Low<br />
birthweight<br />
(%)<br />
2007–2011*<br />
Early<br />
initiation of<br />
breastfeeding<br />
(%)<br />
2007–2011*<br />
Introduction<br />
Exclusive<br />
breastfeeding<br />
of solid,<br />
semi-solid or<br />
TABLE 3: HEALTH<br />
Countries<br />
and areas<br />
Afghanistan 50 78 42 37 60 30 – 68 86 66 66 62 66 66 60 61 64 53 – – –<br />
Albania 95 96 94 94 95 93 – 99 99 99 99 99 99 99 87 70 60 54 – – –<br />
Algeria 83 85 79 95 98 88 – 99 99 95 95 95 95 95 90 53 x 59 x 19 x – – –<br />
Andorra 100 100 100 100 100 100 – – 99 99 99 99 99 99 – – – – – – –<br />
Angola 51 60 38 58 85 19 – 88 99 86 85 88 86 86 70 – – – 28 26 35<br />
Antigua and Barbuda – 95 – – 98 – – – 99 99 99 99 99 99 – – – – – – –<br />
Argentina – 98 – – – – – 99 98 93 95 93 93 93 – – – – – – –<br />
Armenia 98 99 97 90 95 80 – 96 98 95 96 97 95 95 – 57 36 33 – – –<br />
Australia 100 100 100 100 100 100 – – 92 92 92 94 92 92 – – – – – – –<br />
Austria 100 100 100 100 100 100 – – 93 83 83 76 83 83 – – – – – – –<br />
Azerbaijan 80 88 71 82 86 78 78 82 79 74 80 67 48 38 – 36 x – 21 x 1 x 1 x –<br />
Bahamas – 98 – 100 100 100 – – 99 98 97 90 95 98 92 – – – – – –<br />
Bahrain – 100 – – 100 – 100 – 99 99 99 99 99 99 94 – – – – – –<br />
Bangladesh 81 85 80 56 57 55 30 95 99 96 96 96 96 96 94 35 71 78 – – –<br />
Barbados 100 100 100 100 100 100 – – 93 91 91 93 91 91 – – – – – – –<br />
Belarus 100 100 99 93 91 97 – 99 99 98 98 99 98 21 – 90 x 67 x 36 x – – –<br />
Belgium 100 100 100 100 100 100 – – 99 98 98 95 97 98 – – – – – – –<br />
Belize 98 98 99 90 93 87 – 98 98 95 95 98 95 95 88 71 x 44 x 27 x – – –<br />
Benin 75 84 68 13 25 5 17 97 94 85 85 72 85 85 92 31 – 50 38 71 80<br />
Bhutan 96 100 94 44 73 29 4 95 98 95 95 95 95 – 89 74 49 61 – – –<br />
Bolivia (Plurinational<br />
State of) 88 96 71 27 35 10 – 90 90 82 82 84 82 82 74 51 64 35 – – –<br />
Bosnia and Herzegovina 99 100 98 95 99 92 – 94 94 88 89 89 88 85 – 91 x 73 x 35 x – – –<br />
Botswana 96 99 92 62 75 41 100 99 98 96 96 94 93 96 92 14 x – 49 x – – –<br />
Brazil 98 100 85 79 85 44 – 99 99 96 97 97 96 97 92 50 – – – – –<br />
Brunei Darussalam – – – – – – – 96 99 97 99 91 93 96 95 – – – – – –<br />
Bulgaria 100 100 100 100 100 100 – 98 96 95 95 95 96 95 – – – – – – –<br />
Burkina Faso 79 95 73 17 50 6 32 99 93 91 90 63 91 91 88 56 47 21 35 47 57<br />
Burundi 72 83 71 46 49 46 3 90 99 96 94 92 96 96 80 55 43 38 17 45 52<br />
Cambodia 64 87 58 31 73 20 23 94 96 94 94 93 94 94 91 64 39 34 – 4 x 5 x<br />
Cameroon 77 95 52 49 58 36 9 80 90 66 67 76 66 66 75 30 – 17 21 21 36<br />
Canada 100 100 99 100 100 99 – – 98 95 99 98 70 95 – – – – – – –<br />
Cape Verde 88 90 85 61 73 43 100 99 99 90 90 96 90 90 92 – – – – – –<br />
Central African Republic 67 92 51 34 43 28 – 74 64 54 47 62 54 54 80 30 31 16 32 36 47<br />
Chad 51 70 44 13 30 6 11 53 45 22 31 28 22 22 60 26 31 13 36 10 42<br />
Chile 96 99 75 96 98 83 – 91 98 94 93 91 94 94 – – – – – – –<br />
China 91 98 85 64 74 56 100 99 99 99 99 99 99 – – – – – – – –<br />
Colombia 92 99 72 77 82 63 – 83 95 85 85 88 85 85 79 64 – 54 – – 3 x<br />
Comoros 95 91 97 36 50 30 – 76 94 83 85 72 83 83 85 56 x – 19 x 63 x 9 x –<br />
Congo 71 95 32 18 20 15 9 95 90 90 90 90 90 90 83 52 – 35 25 26 27<br />
Cook Islands – 98 – 100 100 100 – 98 98 93 93 89 93 93 – – – – – – –<br />
Costa Rica 97 100 91 95 95 96 – 78 87 85 82 83 84 81 – – – – – – –<br />
Côte d’Ivoire 80 91 68 24 36 11 30 74 75 62 58 49 62 62 82 38 – 17 18 39 68<br />
Croatia 99 100 97 99 99 98 – 99 97 96 96 96 97 96 – – – – – – –<br />
Cuba 94 96 89 91 94 81 – 99 96 96 99 99 96 96 – 97 70 51 – – –<br />
Cyprus 100 100 100 100 100 100 – – 99 99 99 87 96 96 – – – – – – –<br />
Czech Republic 100 100 100 98 99 97 – – 99 99 99 98 99 99 – – – – – – –<br />
Democratic People’s<br />
Republic of Korea 98 99 97 80 86 71 – 98 95 94 99 99 94 – 93 80 88 74 – – –<br />
Democratic Republic<br />
of the Congo 45 79 27 24 24 24 0 67 79 70 78 71 70 70 70 40 42 27 39 38 51<br />
Denmark 100 100 100 100 100 100 – – 94 91 91 87 – 91 – – – – – – –<br />
Djibouti 88 99 54 50 63 10 0 89 89 87 87 84 87 87 79 62 x 43 x 62 x 1 20 30<br />
Dominica – 96 – – – – – 99 99 98 99 99 98 98 – – – – – – –<br />
Dominican Republic 86 87 84 83 87 75 – 98 91 84 84 79 80 71 90 70 57 41 – – –<br />
Ecuador 94 96 89 92 96 84 – 99 99 99 99 98 98 99 85 – – – – – –<br />
Egypt 99 100 99 95 97 93 100 98 97 96 96 96 96 – 86 73 58 28 – – –<br />
El Salvador 88 94 76 87 89 83 – 91 90 89 89 89 90 90 88 67 51 58 – – –<br />
Equatorial Guinea – – – – – – 100 73 65 33 39 51 – – 75 – – 29 x 49 x 1 x –<br />
Eritrea – – – – – 4 3 99 99 99 99 99 99 99 93 44 x – 45 x 13 49 71<br />
Estonia 98 99 97 95 96 94 100 99 96 93 93 94 94 93 – – – – – – –<br />
Ethiopia 44 97 34 21 29 19 – 69 61 51 62 57 51 51 88 27 7 26 10 33 53<br />
Fiji 98 100 95 83 94 71 – 99 99 99 99 94 99 99 94 – – – – – –<br />
Finland 100 100 100 100 100 100 100 – 99 99 99 97 – 99 – – – – – – –<br />
108<br />
Use of improved<br />
drinking water<br />
sources (%) 2010<br />
Use of improved<br />
sanitation facilities<br />
(%) 2010<br />
Routine<br />
EPI<br />
vaccines<br />
financed<br />
by govt.<br />
(%)<br />
2011<br />
Immunization coverage (%)<br />
2011<br />
total urban rural total urban rural BCG DPT1 b DPT3 b Polio3 MCV HepB3 Hib3<br />
THE STATE OF THE WORLD’S CHILDREN 2013: <strong>Children</strong> <strong>with</strong> <strong>Disabilities</strong><br />
Newborns<br />
protected<br />
against<br />
tetanus l<br />
Pneumonia (%)<br />
2007–2012*<br />
Careseeking<br />
for<br />
suspected<br />
pneumonia<br />
Antibiotic<br />
treatment<br />
for<br />
suspected<br />
pneumonia<br />
Diarrhoea<br />
(%)<br />
2007–2012*<br />
Treatment<br />
<strong>with</strong> oral<br />
rehydration<br />
salts (ORS)<br />
Antimalarial<br />
treatment<br />
among<br />
febrile<br />
children<br />
Malaria (%)<br />
2007–2012*<br />
<strong>Children</strong><br />
sleeping<br />
under<br />
ITNs<br />
Households<br />
<strong>with</strong> at<br />
least<br />
one ITN
Countries<br />
and areas<br />
Use of improved<br />
drinking water<br />
sources (%) 2010<br />
Use of improved<br />
sanitation facilities<br />
(%) 2010<br />
Routine<br />
EPI<br />
vaccines<br />
financed<br />
by govt.<br />
(%)<br />
2011<br />
Immunization coverage (%)<br />
2011<br />
total urban rural total urban rural BCG DPT1 b DPT3 b Polio3 MCV HepB3 Hib3<br />
Pneumonia (%)<br />
2007-2012*<br />
Diarrhoea<br />
(%)<br />
2007-2012*<br />
Malaria (%)<br />
2007-2012*<br />
France 100 100 100 100 100 100 – – 99 99 99 89 65 97 – – – – – – –<br />
Gabon 87 95 41 33 33 30 100 89 69 45 44 55 45 45 75 48 x – 25 x – 55 70<br />
Gambia 89 92 85 68 70 65 100 90 99 96 95 91 96 96 91 69 70 39 30 33 51<br />
Georgia 98 100 96 95 96 93 78 96 95 94 90 94 92 92 – 74 x 56 x 40 x – – –<br />
Germany 100 100 100 100 100 100 – – 99 99 95 99 93 93 – – – – – – –<br />
Ghana 86 91 80 14 19 8 – 98 94 91 91 91 91 91 88 41 56 35 53 39 48<br />
Greece 100 100 99 98 99 97 – 91 99 99 99 99 95 83 – – – – – – –<br />
Grenada – 97 – 97 96 97 – – 98 94 95 95 94 94 – – – – – – –<br />
Guatemala 92 98 87 78 87 70 – 89 91 85 86 87 85 85 85 64 x – 37 – – –<br />
Guinea 74 90 65 18 32 11 24 93 86 59 57 58 59 59 80 42 x – 33 x 74 5 8<br />
Guinea-Bissau 64 91 53 20 44 9 – 93 92 76 73 61 76 76 80 52 35 19 51 36 53<br />
Guyana 94 98 93 84 88 82 – 97 97 93 93 98 93 93 90 65 18 50 6 24 26<br />
Haiti 69 85 51 17 24 10 – 75 83 59 59 59 – – 70 31 x 3 x 40 x 5 x – –<br />
Holy See – – – – – – – – – – – – – – – – – – – – –<br />
Honduras 87 95 79 77 85 69 – 99 99 98 98 99 98 98 94 56 x 54 x 56 x 1 x – –<br />
Hungary 100 100 100 100 100 100 100 99 99 99 99 99 – 99 – – – – – – –<br />
Iceland 100 100 100 100 100 100 – – 98 96 96 93 – 96 – – – – – – –<br />
India 92 97 90 34 58 23 100 87 83 72 70 74 47 – 87 69 x 13 x 26 x 8 x – –<br />
Indonesia 82 92 74 54 73 39 100 82 86 63 70 89 63 – 85 66 – 35 1 3 3<br />
Iran (Islamic Republic of) 96 97 92 100 100 100 100 99 99 99 99 99 99 – 95 93 x – – – – –<br />
Iraq 79 91 56 73 76 67 – 92 90 77 78 76 76 – 85 82 x 82 x 31 x 1 x 0 x –<br />
Ireland 100 100 100 99 100 98 – 41 98 95 95 92 95 95 – – – – – – –<br />
Israel 100 100 100 100 100 100 – – 96 94 94 98 99 93 – – – – – – –<br />
Italy 100 100 100 – – – – – 98 96 96 90 96 96 – – – – – – –<br />
Jamaica 93 98 88 80 78 82 – 99 99 99 99 88 99 99 80 75 x 52 x 40 x – – –<br />
Japan 100 100 100 100 100 100 – 94 99 98 96 94 – – – – – – – – –<br />
Jordan 97 98 92 98 98 98 100 95 98 98 98 98 98 98 90 75 79 20 – – –<br />
Kazakhstan 95 99 90 97 97 98 – 96 99 99 99 99 99 95 – 71 x 32 x 74 x – – –<br />
Kenya 59 82 52 32 32 32 57 92 95 88 88 87 88 88 73 56 50 39 23 47 56<br />
Kiribati – – – – – – – 86 99 99 95 90 95 95 – 81 51 62 – – –<br />
Kuwait 99 99 99 100 100 100 – 99 99 99 99 99 99 99 95 – – – – – –<br />
Kyrgyzstan 90 99 85 93 94 93 – 98 97 96 94 97 96 96 – 62 x 45 x 20 x – – –<br />
Lao People’s<br />
Democratic Republic 67 77 62 63 89 50 6 77 83 78 79 69 78 78 80 32 x 52 x 46 x 8 x 41 x 45 x<br />
Latvia 99 100 96 – – – 100 95 97 94 94 99 91 93 – – – – – – –<br />
Lebanon 100 100 100 – 100 – – – 84 81 75 79 81 81 – 74 x – 44 x – – –<br />
Lesotho 78 91 73 26 32 24 42 95 93 83 91 85 83 83 83 66 – 51 – – –<br />
Liberia 73 88 60 18 29 7 91 73 61 49 56 40 49 49 91 62 – 53 57 37 50<br />
Libya – – – 97 97 96 – 99 98 98 98 98 98 98 – – – – – – –<br />
Liechtenstein – – – – – – – – – – – – – – – – – – – – –<br />
Lithuania – 98 – – 95 – 100 98 95 92 92 94 95 92 – – – – – – –<br />
Luxembourg 100 100 100 100 100 100 – – 99 99 99 96 95 99 – – – – – – –<br />
Madagascar 46 74 34 15 21 12 21 82 96 89 88 70 89 89 78 42 – 17 20 46 57<br />
Malawi 83 95 80 51 49 51 – 99 98 97 86 96 97 97 87 70 – 69 43 39 57<br />
Malaysia 100 100 99 96 96 95 – 99 99 99 99 95 97 99 90 – – – – – –<br />
Maldives 98 100 97 97 98 97 100 98 97 96 96 96 96 – 95 22 x – 57 – – –<br />
Mali 64 87 51 22 35 14 – 89 85 72 71 56 72 72 89 38 x – 14 x 35 70 85<br />
Malta 100 100 100 100 100 100 – – 99 96 96 84 82 96 – – – – – – –<br />
Marshall Islands 94 92 99 75 83 53 2 99 99 94 95 97 97 92 – – – – – – –<br />
Mauritania 50 52 48 26 51 9 21 86 91 75 73 67 75 75 80 45 24 20 21 – 12<br />
Mauritius 99 100 99 89 91 88 100 99 99 98 98 99 98 98 95 – – – – – –<br />
Mexico 96 97 91 85 87 79 – 99 99 97 97 98 98 97 88 – – – – – –<br />
Micronesia<br />
(Federated States of) – – – – – – – 75 96 84 83 92 83 72 – – – – – – –<br />
Monaco 100 100 – 100 100 – – 89 99 99 99 99 99 99 – – – – – – –<br />
Mongolia 82 100 53 51 64 29 69 99 99 99 99 98 99 99 – 87 72 38 x – – –<br />
Montenegro 98 99 96 90 92 87 100 97 98 95 95 91 91 90 – 89 x 57 x 16 x – – –<br />
Morocco 83 98 61 70 83 52 – 99 99 99 98 95 98 99 89 70 – 23 x – – –<br />
Mozambique 47 77 29 18 38 5 20 91 90 76 73 82 76 76 83 65 22 55 30 18 28<br />
Myanmar 83 93 78 76 83 73 – 93 99 99 99 99 52 – 93 69 34 61 – 11 –<br />
Namibia 93 99 90 32 57 17 – 89 88 82 85 74 82 82 83 53 x – 63 20 34 54<br />
Nauru 88 88 – 65 65 – 100 99 99 99 99 99 99 99 – 69 47 – – – –<br />
Nepal 89 93 88 31 48 27 20 97 96 92 92 88 92 92 82 50 7 39 1 – –<br />
Netherlands 100 100 100 100 100 100 100 – 99 97 97 96 – 97 – – – – – – –<br />
Newborns<br />
protected<br />
against<br />
tetanus l<br />
Careseeking<br />
for<br />
suspected<br />
pneumonia<br />
Antibiotic<br />
treatment<br />
for<br />
suspected<br />
pneumonia<br />
TABLE 3 HEALTH<br />
Treatment<br />
<strong>with</strong> oral<br />
rehydration<br />
salts (ORS)<br />
Antimalarial<br />
treatment<br />
among<br />
febrile<br />
children<br />
<strong>Children</strong><br />
sleeping<br />
under<br />
ITNs<br />
Households<br />
<strong>with</strong> at<br />
least<br />
one ITN<br />
STATISTICAL TABLES 109
TABLE 3 HEALTH<br />
Countries<br />
and areas<br />
New Zealand 100 100 100 – – – 100 – 95 95 95 93 95 94 – – – – – – –<br />
Nicaragua 85 98 68 52 63 37 – 98 99 98 99 99 98 98 81 58 x – 59 2 x – –<br />
Niger 49 100 39 9 34 4 14 61 80 75 44 76 75 75 84 51 – 34 – 64 76<br />
Nigeria 58 74 43 31 35 27 – 64 53 47 73 71 50 – 60 45 23 26 49 29 42<br />
Niue 100 100 100 100 100 100 5 99 99 98 98 99 98 99 – – – – – – –<br />
Norway 100 100 100 100 100 100 100 – 99 94 94 93 – 95 – – – – – – –<br />
Oman 89 93 78 99 100 95 – 99 99 99 99 99 99 99 91 – – – – – –<br />
Pakistan 92 96 89 48 72 34 – 85 88 80 75 80 80 80 75 69 50 41 3 – 0<br />
Palau 85 83 96 100 100 100 0 – 99 84 98 85 91 85 – – – – – – –<br />
Panama – 97 – – – – – 97 95 87 91 97 87 87 – – – – – – –<br />
Papua New Guinea 40 87 33 45 71 41 45 83 83 61 58 60 62 61 61 63 x – – – – –<br />
Paraguay 86 99 66 71 90 40 – 94 97 90 87 93 90 90 85 – – – – – –<br />
Peru 85 91 65 71 81 37 – 91 94 91 91 96 91 91 85 68 51 32 – – –<br />
Philippines 92 93 92 74 79 69 – 84 85 80 80 79 76 14 76 50 42 47 0 x – –<br />
Poland – 100 – – 96 – – 93 99 99 96 98 98 99 – – – – – – –<br />
Portugal 99 99 100 100 100 100 100 96 99 98 97 96 97 97 – – – – – – –<br />
Qatar 100 100 100 100 100 100 – 97 94 93 93 99 93 93 – – – – – – –<br />
Republic of Korea 98 100 88 100 100 100 – 99 99 99 98 99 99 – – – – – – – –<br />
Republic of Moldova 96 99 93 85 89 82 – 98 96 93 96 91 96 78 – 60 x – 33 x – – –<br />
Romania – 99 – – – – 100 99 96 89 89 93 96 89 – – – – – – –<br />
Russian Federation 97 99 92 70 74 59 – 95 97 97 97 98 97 – – – – – – – –<br />
Rwanda 65 76 63 55 52 56 11 99 98 97 93 95 97 97 85 50 – 29 11 70 82<br />
Saint Kitts and Nevis 99 99 99 96 96 96 – 99 99 97 98 99 98 98 – – – – – – –<br />
Saint Lucia 96 98 95 65 71 63 – 97 98 97 97 95 97 97 – – – – – – –<br />
Saint Vincent and<br />
the Grenadines – – – – – 96 – 99 98 95 95 99 96 96 – – – – – – –<br />
Samoa 96 96 96 98 98 98 100 99 99 91 91 67 91 91 – – – 68 – – –<br />
San Marino – – – – – – – – 90 86 86 83 86 85 – – – – – – –<br />
Sao Tome and Principe 89 89 88 26 30 19 15 99 98 96 96 91 96 96 – 75 – 49 8 56 61<br />
Saudi Arabia – 97 – – 100 – – 98 99 98 98 98 98 98 – – – – – – –<br />
Senegal 72 93 56 52 70 39 32 95 94 83 73 82 83 83 88 50 – 22 8 35 63<br />
Serbia 99 99 98 92 96 88 – 99 91 91 91 95 89 91 – 90 82 36 – – –<br />
Seychelles – 100 – – 98 – 100 99 99 99 99 99 99 99 – – – – – – –<br />
Sierra Leone 55 87 35 13 23 6 2 96 94 84 81 80 84 84 85 74 58 73 62 30 36<br />
Singapore 100 100 – 100 100 – – 99 98 96 96 95 96 – – – – – – – –<br />
Slovakia 100 100 100 100 100 99 100 97 99 99 99 98 99 99 – – – – – – –<br />
Slovenia 99 100 99 100 100 100 – – 98 96 96 95 – 96 – – – – – – –<br />
Solomon Islands – – – – 98 – 47 89 94 88 93 73 88 88 85 73 23 – 19 40 49<br />
Somalia 29 66 7 23 52 6 0 41 52 41 49 46 – – 64 13 x 32 x 13 x 8 x 11 x 12 x<br />
South Africa 91 99 79 79 86 67 100 78 77 72 73 78 76 72 77 65 x – 40 x – – –<br />
South Sudan s – – – – – – 0 57 58 46 46 64 – – 44 48 33 39 36 25 53<br />
Spain 100 100 100 100 100 100 – – 99 97 97 95 97 97 – – – – – – –<br />
Sri Lanka 91 99 90 92 88 93 39 99 99 99 99 99 99 99 95 58 – 50 0 3 5<br />
State of Palestine 85 86 81 92 92 92 – 98 99 99 99 99 98 – – 65 x – – – – –<br />
Sudan s – – – – – – 2 92 98 93 93 87 93 93 74 56 66 22 65 – 25<br />
Suriname 92 97 81 83 90 66 – – 90 86 86 85 86 86 93 74 x 37 x 44 x – 3 x –<br />
Swaziland 71 91 65 57 64 55 – 98 98 91 85 98 91 91 86 58 61 57 2 2 10<br />
Sweden 100 100 100 100 100 100 – 23 99 98 98 96 – 98 – – – – – – –<br />
Switzerland 100 100 100 100 100 100 0 – 95 95 95 92 – 95 – – – – – – –<br />
Syrian Arab Republic 90 93 86 95 96 93 – 90 86 72 75 80 66 72 94 77 x 71 x 50 x – – –<br />
Tajikistan 64 92 54 94 95 94 18 97 98 96 97 98 96 96 – 64 x 41 x 73 2 x 1 x 2 x<br />
Thailand 96 97 95 96 95 96 100 99 99 99 99 98 98 – 91 84 x 65 x 57 x – – –<br />
The former Yugoslav<br />
Republic of Macedonia 100 100 99 88 92 82 – 98 95 95 95 98 90 89 – 93 x 74 x 62 – – –<br />
Timor-Leste 69 91 60 47 73 37 100 68 69 67 66 62 67 – 81 71 45 71 6 42 42<br />
Togo 61 89 40 13 26 3 25 90 95 81 81 67 81 81 81 32 41 11 34 57 57<br />
Tonga 100 100 100 96 98 96 100 99 99 99 99 99 99 99 – – – – – – –<br />
Trinidad and Tobago 94 98 93 92 92 92 – – 96 90 91 92 90 90 – 74 x 34 x – – – –<br />
Tunisia – 99 – – 96 – – 98 98 98 98 96 98 43 96 59 x – 55 x – – –<br />
Turkey 100 100 99 90 97 75 – 97 98 97 97 97 96 97 90 41 x – – – – –<br />
Turkmenistan – 97 – 98 99 97 – 98 98 97 97 99 97 71 – 83 x 50 x 40 x – – –<br />
Tuvalu 98 98 97 85 88 81 – 99 99 96 96 98 96 96 – – – – – – –<br />
Uganda 72 95 68 34 34 34 19 86 91 82 82 75 82 82 85 79 47 44 65 43 60<br />
Ukraine 98 98 98 94 96 89 – 90 73 50 58 67 21 26 – – – – – – –<br />
United Arab Emirates 100 100 100 98 98 95 – 98 94 94 94 94 94 94 – – – – – – –<br />
110<br />
Use of improved<br />
drinking water<br />
sources (%) 2010<br />
Use of improved<br />
sanitation facilities<br />
(%) 2010<br />
Routine<br />
EPI<br />
vaccines<br />
financed<br />
by govt.<br />
(%)<br />
2011<br />
Immunization coverage (%)<br />
2011<br />
total urban rural total urban rural BCG DPT1 b DPT3 b Polio3 MCV HepB3 Hib3<br />
THE STATE OF THE WORLD’S CHILDREN 2013: <strong>Children</strong> <strong>with</strong> <strong>Disabilities</strong><br />
Newborns<br />
protected<br />
against<br />
tetanus l<br />
Pneumonia (%)<br />
2007-2012*<br />
Careseeking<br />
for<br />
suspected<br />
pneumonia<br />
Antibiotic<br />
treatment<br />
for<br />
suspected<br />
pneumonia<br />
Diarrhoea<br />
(%)<br />
2007-2012*<br />
Treatment<br />
<strong>with</strong> oral<br />
rehydration<br />
salts (ORS)<br />
Antimalarial<br />
treatment<br />
among<br />
febrile<br />
children<br />
Malaria (%)<br />
2007-2012*<br />
<strong>Children</strong><br />
sleeping<br />
under<br />
ITNs<br />
Households<br />
<strong>with</strong> at<br />
least<br />
one ITN
Countries<br />
and areas<br />
Use of improved<br />
drinking water<br />
sources (%) 2010<br />
Use of improved<br />
sanitation facilities<br />
(%) 2010<br />
Routine<br />
EPI<br />
vaccines<br />
financed<br />
by govt.<br />
(%)<br />
2011<br />
United Kingdom 100 100 100 100 100 100 – – 98 95 95 90 – 95 – – – – – – –<br />
United Republic<br />
of Tanzania 53 79 44 10 20 7 23 99 96 90 88 93 90 90 88 71 – 44 59 64 64<br />
United States 99 100 94 100 100 99 – – 98 94 94 90 91 88 – – – – – – –<br />
Uruguay 100 100 100 100 100 99 – 99 99 95 95 95 95 95 – – – – – – –<br />
Uzbekistan 87 98 81 100 100 100 – 99 99 99 99 99 99 99 – 68 x 56 x 28 x _ – –<br />
Vanuatu 90 98 87 57 64 54 16 81 78 68 67 52 59 – 75 – – 23 53 56 68<br />
Venezuela (Bolivarian<br />
Republic of) – – – – – – – 95 90 78 78 86 78 78 50 72 x – 38 x – – –<br />
Viet Nam 95 99 93 76 94 68 30 98 97 95 96 96 95 95 87 73 68 47 1 9 10<br />
Yemen 55 72 47 53 93 34 13 59 89 81 81 71 81 81 66 44 x 38 x 33 x – – –<br />
Zambia 61 87 46 48 57 43 19 88 87 81 83 83 81 81 81 68 47 60 34 50 64<br />
Zimbabwe 80 98 69 40 52 32 – 98 99 99 99 92 93 93 66 48 31 21 2 10 29<br />
MEMORANDUM<br />
Sudan and South Sudan s 58 † 67 † 52 † 26 † 44 † 14 † – – – – – – – – – – – – – – –<br />
SUMMARY INDICATORS #<br />
Sub-Saharan Africa 61 83 49 30 43 23 27 79 79 71 76 74 70 60 76 49 34 32 38 38 50<br />
Eastern and<br />
Southern Africa 61 87 50 35 54 27 39 85 85 79 79 79 76 76 81 55 30 39 31 41 54<br />
West and Central Africa 62 82 47 26 35 20 17 73 71 62 72 69 63 44 72 44 33 27 42 36 49<br />
Middle East and<br />
North Africa 86 93 76 82 91 70 75 93 96 92 92 90 91 48 85 – – – – – –<br />
South Asia 90 96 88 38 60 28 90 87 85 75 73 77 57 23 85 65 24 34 7 – –<br />
East Asia and Pacific 90 97 84 67 77 58 95 95 95 91 92 95 89 10 85 ** 64 ** – 43 ** – 6 ** –<br />
Latin America<br />
and Caribbean 94 98 81 79 84 60 – 95 96 92 92 93 90 90 85 – – – – – –<br />
CEE/CIS 96 99 91 85 87 80 – 96 95 92 93 94 89 58 – – – – – – –<br />
Least developed countries 63 82 56 35 48 30 19 82 87 78 79 76 75 74 81 50 43 42 36 41 53<br />
World 89 96 81 63 79 47 84 88 89 83 84 84 75 43 82 ** 60 ** 31 ** 35 ** 19 ** – –<br />
s Due to the cession in July 2011 of the Republic of South Sudan by the Republic of the Sudan, and its subsequent admission to the United Nations on 14 July 2011, disaggregated data for the Sudan and South Sudan as separate<br />
States are not yet available for all indicators. Aggregated data presented are for the Sudan pre-cession (see Memorandum item).<br />
# For a complete list of countries and areas in the regions, subregions and country categories, see page 98.<br />
DEFINITIONS OF THE INDICATORS<br />
Use of improved drinking water sources – Percentage of the population using any of the following as the<br />
main drinking water source: drinking water supply piped into dwelling, plot, yard or neighbour’s yard; public tap or<br />
standpipe; tube well or borehole; protected dug well; protected spring; rainwater; bottled water plus one of the<br />
previous sources as a secondary source.<br />
Use of improved sanitation facilities – Percentage of the population using any of the following sanitation facilities,<br />
not shared <strong>with</strong> other households: flush or pour-flush latrine connected to a piped sewerage system, septic tank or pit<br />
latrine; ventilated improved pit latrine; pit latrine <strong>with</strong> a slab; covered pit; composting toilet.<br />
Routine EPI vaccines financed by government – Percentage of EPI vaccines that are routinely administered in<br />
a country to protect children and are financed by the national government (including loans).<br />
EPI – Expanded programme on immunization: The immunizations in this programme include those against<br />
tuberculosis (TB); diphtheria, pertussis (whooping cough) and tetanus (DPT); polio; and measles, as well as<br />
vaccination of pregnant women to protect babies against neonatal tetanus. Other vaccines, e.g., against hepatitis B<br />
(HepB), Haemophilus influenzae type b (Hib) or yellow fever, may be included in the programme in some countries.<br />
BCG – Percentage of live births who received bacille Calmette-Guérin (vaccine against tuberculosis).<br />
DPT1 – Percentage of surviving infants who received their first dose of diphtheria, pertussis and tetanus vaccine.<br />
DPT3 – Percentage of surviving infants who received three doses of diphtheria, pertussis and tetanus vaccine.<br />
Polio3 – Percentage of surviving infants who received three doses of the polio vaccine.<br />
MCV – Percentage of surviving infants who received the first dose of the measles-containing vaccine.<br />
HepB3 – Percentage of surviving infants who received three doses of hepatitis B vaccine.<br />
Hib3 – Percentage of surviving infants who received three doses of Haemophilus influenzae type b vaccine.<br />
Newborns protected against tetanus – Percentage of newborns protected at birth against tetanus.<br />
Care-seeking for suspected pneumonia – Percentage of children under age 5 <strong>with</strong> suspected pneumonia<br />
(cough and fast or difficult breathing due to a problem in the chest) in the two weeks preceding the survey and who<br />
were taken to an appropriate health-care provider.<br />
Antibiotic treatment for suspected pneumonia – Percentage of children under age 5 <strong>with</strong> suspected<br />
pneumonia (cough and fast or difficult breathing due to a problem in the chest) in the two weeks preceding the<br />
survey who received antibiotics.<br />
Diarrhoea treatment <strong>with</strong> oral rehydration salts (ORS) – Percentage of children under age 5 who had<br />
diarrhoea in the two weeks preceding the survey and who received oral rehydration salts (ORS packets or<br />
pre-packaged ORS fluids).<br />
Antimalarial treatment among febrile children – Percentage of children under age 5 who were ill <strong>with</strong> fever in<br />
the two weeks preceding the survey and received any antimalarial medicine. NB: This indicator refers to antimalarial<br />
treatment among all febrile children, rather than among confirmed malaria cases, and thus should be interpreted<br />
<strong>with</strong> caution. For more information, please refer to http://www.childinfo.org/malaria_maltreatment.php.<br />
<strong>Children</strong> sleeping under ITNs – Percentage of children under age 5 who slept under an insecticide-treated<br />
mosquito net the night prior to the survey.<br />
Households <strong>with</strong> at least one ITN – Percentage of households <strong>with</strong> at least one insecticide-treated mosquito net.<br />
Immunization coverage (%)<br />
2011<br />
total urban rural total urban rural BCG DPT1 b DPT3 b Polio3 MCV HepB3 Hib3<br />
Newborns<br />
protected<br />
against<br />
tetanus l<br />
Pneumonia (%)<br />
2007-2012*<br />
Careseeking<br />
for<br />
suspected<br />
pneumonia<br />
Antibiotic<br />
treatment<br />
for<br />
suspected<br />
pneumonia<br />
Diarrhoea<br />
(%)<br />
2007-2012*<br />
Treatment<br />
<strong>with</strong> oral<br />
rehydration<br />
salts (ORS)<br />
TABLE 3 HEALTH<br />
Antimalarial<br />
treatment<br />
among<br />
febrile<br />
children<br />
Malaria (%)<br />
2007-2012*<br />
<strong>Children</strong><br />
sleeping<br />
under<br />
ITNs<br />
MAIN DATA SOURCES<br />
Use of improved drinking water sources and improved sanitation facilities – UNICEF and<br />
World Health Organization (WHO), Joint Monitoring Programme.<br />
Routine EPI vaccines financed by government – As reported by governments on UNICEF and<br />
WHO Joint Reporting Form.<br />
Immunization – UNICEF and WHO.<br />
Suspected pneumonia care-seeking and treatment – Demographic and Health Surveys (DHS),<br />
Multiple Indicator Cluster Surveys (MICS) and other national household surveys.<br />
Diarrhoea treatment – DHS, MICS and other national household surveys.<br />
Malaria prevention and treatment – DHS, MICS, Malaria Indicator Surveys (MIS) and other<br />
national household surveys.<br />
NOTES<br />
– Data not available.<br />
x Data refer to years or periods other than those specified in the column heading. Such data are not<br />
included in the calculation of regional and global averages, <strong>with</strong> the exception of 2005–2006 data<br />
from India. Estimates from data years prior to 2000 are not displayed.<br />
b Coverage for DPT1 should be at least as high as DPT3. Discrepancies where DPT1 coverage is less<br />
than DPT3 reflect deficiencies in the data collection and reporting process. UNICEF and WHO are<br />
working <strong>with</strong> national and territorial systems to eliminate these discrepancies.<br />
l WHO and UNICEF have employed a model to calculate the percentage of births that can be<br />
considered as protected against tetanus because pregnant women were given two doses or<br />
more of tetanus toxoid (TT) vaccine. The model aims to improve the accuracy of this indicator by<br />
capturing or including other potential scenarios where women might be protected (e.g., women<br />
who receive doses of TT in supplemental immunization activities). A fuller explanation of the<br />
methodology can be found at .<br />
† The WHO/UNICEF Joint Monitoring Programme for Water Supply and Sanitation (JMP) closed its<br />
databases for these estimates before the cession of the Republic of South Sudan by the Republic<br />
of the Sudan. Aggregated data presented are for the Sudan pre-cession. Disaggregated data for<br />
the Sudan and South Sudan as separate States will be published by the JMP in 2013.<br />
* Data refer to the most recent year available during the period specified in the column heading.<br />
** Excludes China.<br />
Households<br />
<strong>with</strong> at<br />
least<br />
one ITN<br />
STATISTICAL TABLES 111
TABLE 4: HIV/AIdS<br />
Countries<br />
and areas<br />
Afghanistan
Countries<br />
and areas<br />
Adult HIV<br />
prevalence<br />
(%)<br />
2011<br />
TABLE 4 HIV/AIdS<br />
Prevention among young people (aged 15–24) Orphans<br />
Women <strong>Children</strong><br />
living living<br />
People of all ages living <strong>with</strong> HIV <strong>with</strong> HIV <strong>with</strong> HIV<br />
(thousands) 2011 (thousands) (thousands)<br />
HIV prevalence among young<br />
people (%) 2011<br />
Comprehensive<br />
knowledge of HIV (%)<br />
2007–2011*<br />
<strong>Children</strong><br />
Condom use among <strong>Children</strong> orphaned Orphan<br />
young people <strong>with</strong> orphaned due to all school<br />
multiple partners (%) by AIDS causes attendance<br />
2007–2011* (thousands) (thousands) ratio (%)<br />
estimate low high 2011 2011 total male female male female male female 2011 2011 2007–2011*<br />
France 0.4 160 130 200 46 – 0.1 0.2 0.1 – – – – – – –<br />
Gabon 5.0 46 34 67 24 3 2.1 1.2 3.0 – – – – 21 64 –<br />
Gambia 1.5 14 7 28 8 – 0.8 0.4 1.2 – 33 – 49 p – – 103<br />
Georgia 0.2 5 2 8 1 – 0.2 0.2 0.1 – – – – – – –<br />
Germany 0.1 73 66 82 11 – 0.1 0.1
TABLE 4 HIV/AIdS<br />
Countries<br />
and areas<br />
New Zealand 0.1 3 2 3
Countries<br />
and areas<br />
Adult HIV<br />
prevalence<br />
(%)<br />
2011<br />
Ukraine 0.8 230 180 310 94 – 0.1 0.1 0.1 43 45 64 63 – – –<br />
United Arab Emirates – – – – – – – – – – – – – – – –<br />
United Kingdom 0.3 94 74 120 29 – 0.1 0.1 0.1 – – – – – – –<br />
United Republic<br />
of Tanzania 5.8 1,600 1,500 1,700 760 230 2.9 1.8 4.0 43 48 36 32 1,300 3,000 90<br />
United States 0.6 1,300 1,000 2,000 300 – 0.2 0.3 0.2 – – – – – – –<br />
Uruguay 0.6 12 6 33 4 – 0.3 0.4 0.2 – – – – – – –<br />
Uzbekistan – – – – – – – – – – 31 x – – – – –<br />
Vanuatu – – – – – – – – – – 15 – – – – 92<br />
Venezuela (Bolivarian<br />
Republic of) 0.5 99 51 230 25 – 0.2 0.4 0.1 – – – – – – –<br />
Viet Nam 0.5 250 200 330 48 – 0.2 0.3 0.2 – 51 – – – – –<br />
Yemen 0.2 22 19 25 9 – 0.1 0.1 0.1 – 2 x,y – – – – –<br />
Zambia 12.5 970 900 1,100 460 170 5.0 3.1 7.0 41 38 43 42 p 680 1,200 92<br />
Zimbabwe 14.9 1,200 1,200 1,300 600 200 5.6 3.6 7.6 47 52 51 39 p 1,000 1,300 95<br />
MEMORANDUM<br />
Sudan and South Sudan s – – – – – – – – – – – – – – – –<br />
SUMMARY INDICATORS #<br />
Sub-Saharan Africa 4.8 23,500 22,100 24,900 11,800 3,100 2.2 1.3 3.0 36 28 49 30 15,200 53,600 95<br />
Eastern and Southern<br />
Africa 7.0 17,200 16,300 17,800 8,700 2,200 3.1 1.9 4.3 40 36 44 30 10,700 27,200 89<br />
West and Central Africa 2.6 6,300 5,700 6,800 3,200 850 1.3 0.7 1.8 33 21 56 30 4,500 26,300 100<br />
Middle East and North<br />
Africa 0.1 260 220 320 74 32 0.1 0.1 0.1 – – – – 160 6,000 –<br />
South Asia 0.2 2,500 1,600 3,400 890 110 0.1 0.1 0.1 34 17 33 17 600 42,900 72<br />
East Asia and Pacific 0.2 2,400 2,100 2,700 720 64 0.1 0.1 0.1 – 23 ** – – 510 28,700 –<br />
Latin America and<br />
Caribbean 0.4 1,600 1,300 1,900 540 58 0.2 0.2 0.2 – – – – 600 9,500 –<br />
CEE/CIS 0.6 1,500 1,100 1,800 410 18 0.1 0.1 0.1 – – – – 170 6,500 –<br />
Least developed countries 1.9 10,300 9,600 10,900 5,000 1,600 0.9 0.6 1.3 30 24 – – 7,800 43,200 88<br />
World 0.8 34,000 31,400 35,900 15,000 3,400 0.4 0.3 0.5 – 21 ** – – 17,300 151,000 –<br />
s Due to the cession in July 2011 of the Republic of South Sudan by the Republic of the Sudan, and its subsequent admission to the United Nations on 14 July 2011, disaggregated data for the Sudan<br />
and South Sudan as separate States are not yet available for all indicators. Aggregated data presented are for the Sudan pre-cession (see Memorandum item).<br />
# For a complete list of countries and areas in the regions, subregions and country categories, see page 98.<br />
DEFINITIONS OF THE INDICATORS<br />
Adult HIV prevalence – Estimated percentage of adults (aged 15–49) living <strong>with</strong><br />
HIV as of 2011.<br />
People living <strong>with</strong> HIV – Estimated number of people (all ages) living <strong>with</strong> HIV as<br />
of 2011.<br />
Women living <strong>with</strong> HIV – Estimated number of women (aged 15+) living <strong>with</strong> HIV<br />
as of 2011.<br />
<strong>Children</strong> living <strong>with</strong> HIV – Estimated number of children (aged 0–14) living <strong>with</strong><br />
HIV as of 2011.<br />
HIV prevalence among young people – Estimated percentage of young men and<br />
women (aged 15–24) living <strong>with</strong> HIV as of 2011.<br />
Comprehensive knowledge of HIV – Percentage of young men and women<br />
(aged 15–24) who correctly identify the two major ways of preventing the sexual<br />
transmission of HIV (using condoms and limiting sex to one faithful, uninfected<br />
partner), who reject the two most common local misconceptions about HIV<br />
transmission and who know that a healthy-looking person can be HIV-positive.<br />
Condom use among young people <strong>with</strong> multiple partners – Among young<br />
people (aged 15–24) who reported having had more than one sexual partner in the<br />
past 12 months, the percentage who reported using a condom the last time they had<br />
sex <strong>with</strong> any partner.<br />
<strong>Children</strong> orphaned by AIDS – Estimated number of children (aged 0–17) who have<br />
lost one or both parents to AIDS as of 2011.<br />
<strong>Children</strong> orphaned due to all causes – Estimated number of children (aged 0–17)<br />
who have lost one or both parents to any cause as of 2011.<br />
Orphan school attendance ratio – Percentage of children (aged 10–14) who<br />
have lost both biological parents and who are currently attending school as a<br />
percentage of non-orphaned children of the same age who live <strong>with</strong> at least one<br />
parent and who are attending school.<br />
TABLE 4 HIV/AIdS<br />
Prevention among young people (aged 15–24) Orphans<br />
Women <strong>Children</strong><br />
living living<br />
People of all ages living <strong>with</strong> HIV <strong>with</strong> HIV <strong>with</strong> HIV<br />
(thousands) 2011 (thousands) (thousands)<br />
HIV prevalence among young<br />
people (%) 2011<br />
Comprehensive<br />
knowledge of HIV (%)<br />
2007–2011*<br />
<strong>Children</strong><br />
Condom use among <strong>Children</strong> orphaned Orphan<br />
young people <strong>with</strong> orphaned due to all school<br />
multiple partners (%) by AIDS causes attendance<br />
2007–2011* (thousands) (thousands) ratio (%)<br />
estimate low high 2011 2011 total male female male female male female 2011 2011 2007–2011*<br />
MAIN DATA SOURCES<br />
Estimated adult HIV prevalence – UNAIDS, Report on the Global AIDS Epidemic, 2012.<br />
Estimated number of people living <strong>with</strong> HIV – UNAIDS, Report on the Global AIDS Epidemic, 2012.<br />
Estimated number of women living <strong>with</strong> HIV – UNAIDS, Report on the Global AIDS Epidemic, 2012.<br />
Estimated number of children living <strong>with</strong> HIV – UNAIDS, Report on the Global AIDS Epidemic, 2012.<br />
HIV prevalence among young people – UNAIDS, Report on the Global AIDS Epidemic, 2012.<br />
Comprehensive knowledge of HIV – AIDS Indicator Surveys (AIS), Demographic and Health Surveys<br />
(DHS), Multiple Indicator Cluster Surveys (MICS) and other national household surveys; HIV/AIDS Survey<br />
Indicators Database, .<br />
Condom use among young people <strong>with</strong> multiple partners – AIS, DHS, MICS and other national<br />
household surveys; HIV/AIDS Survey Indicators Database, .<br />
<strong>Children</strong> orphaned by AIDS – UNAIDS, Report on the Global AIDS Epidemic, 2012.<br />
<strong>Children</strong> orphaned by all causes – UNAIDS, Report on the Global AIDS Epidemic, 2012.<br />
Orphan school attendance ratio – AIS, DHS, MICS and other national household surveys; HIV/AIDS<br />
Survey Indicators Database, .<br />
NOTES<br />
– Data not available.<br />
x Data refer to years or periods other than those specified in the column heading. Such data are not<br />
included in the calculation of regional and global averages, <strong>with</strong> the exception of 2005–2006 data from<br />
India. Estimates from data years prior to 2000 are not displayed.<br />
y Data differ from the standard definition or refer to only part of a country. If they fall <strong>with</strong>in the noted<br />
reference period, such data are included in the calculation of regional and global averages.<br />
p Based on small denominators (typically 25–49 unweighted cases).<br />
* Data refer to the most recent year available during the period specified in the column heading.<br />
** Excludes China.<br />
STATISTICAL TABLES 115
TABLE 5: EduCATION<br />
Countries<br />
and areas<br />
Afghanistan – – 54 5 – – 114 79 – – 66 x 40 x – 90 x – – 18 x 6 x<br />
Albania 99 99 96 49 56 55 87 87 80 80 90 91 95 100 – – 84 82<br />
Algeria 94 x 89 x 99 14 79 76 113 107 98 96 97 x 96 x 95 93 x – – 57 x 65 x<br />
Andorra – – 75 81 104 99 84 85 78 79 – – – – 74 75 – –<br />
Angola 80 66 48 15 103 105 137 112 93 78 77 75 32 83 x 12 11 21 17<br />
Antigua and Barbuda – – 182 82 76 76 106 97 91 84 – – – – 85 85 – –<br />
Argentina 99 99 135 48 73 75 118 117 – – – – 94 – 78 87 – –<br />
Armenia 100 100 104 – 29 34 101 104 – – 99 x 98 x – 100 x 85 88 93 x 95 x<br />
Australia – – 108 79 79 78 105 105 97 98 – – – – 85 86 – –<br />
Austria – – 155 80 100 100 100 99 – – – – 97 – – – – –<br />
Azerbaijan 100 100 109 50 26 25 94 93 85 84 74 x 72 x 96 100 x – – 83 82<br />
Bahamas – – 86 65 – – 113 115 – – – – 89 – 82 88 – –<br />
Bahrain 100 100 128 77 – – – – – – 86 x 87 x – 99 x – – 77 x 85 x<br />
Bangladesh 75 78 56 5 14 13 – – – – 85 y 88 y 66 94 x 45 50 – –<br />
Barbados – – 127 72 108 108 119 122 – – – – – – 81 88 – –<br />
Belarus 100 100 112 40 100 98 100 100 – – 93 x 94 x 100 100 x – – 95 x 97 x<br />
Belgium – – 117 78 118 118 105 104 99 99 – – 93 – – – – –<br />
Belize – – 64 – 45 47 127 116 – – 95 x 95 x 90 98 x – – 58 x 60 x<br />
Benin 66 45 85 4 18 19 135 117 – – 65 x 58 x – 89 x – – 34 x 23 x<br />
Bhutan 80 x 68 x 66 21 2 2 110 112 88 91 91 93 91 94 50 54 54 56<br />
Bolivia (Plurinational<br />
State of) 100 99 83 30 45 45 105 104 – – 97 97 – 96 68 69 78 75<br />
Bosnia and Herzegovina 100 100 85 60 17 17 111 113 86 88 97 x 98 x 99 100 x – – 89 x 89 x<br />
Botswana 94 97 143 7 19 19 112 108 87 88 86 88 93 – 57 65 36 x 44 x<br />
Brazil 97 99 123 45 – – – – – – 95 x 95 x – 88 x – – 74 x 80 x<br />
Brunei Darussalam 100 100 109 56 88 88 107 109 – – – – 96 – 95 99 – –<br />
Bulgaria 98 98 141 51 80 79 103 102 99 100 – – 97 – 84 82 – –<br />
Burkina Faso 47 33 45 3 3 3 79 72 61 56 49 x 44 x 64 89 x 18 14 17 x 15 x<br />
Burundi 78 78 14 1 9 9 157 155 – – 73 74 56 82 x 18 15 7 7<br />
Cambodia 88 86 70 3 13 13 130 124 96 95 85 y 85 y – 92 x – – 45 y 44 y<br />
Cameroon 89 77 52 5 28 29 129 111 – – 82 x 77 x 66 87 x – – 39 x 37 x<br />
Canada – – 75 83 71 71 99 98 – – – – – – – – – –<br />
Cape Verde 97 99 79 32 70 70 114 105 95 92 – – – – 61 71 – –<br />
Central African Republic 72 58 25 2 6 6 109 78 81 61 56 x 47 x 46 62 x 18 10 12 x 9 x<br />
Chad 53 41 32 2 2 2 107 78 – – 56 48 28 94 x – – 20 12<br />
Chile 99 99 130 54 55 58 108 103 94 94 – – – – 81 84 – –<br />
China 99 99 73 38 54 54 110 113 100 z 100 z – – 99 z – – – – –<br />
Colombia 98 99 98 40 49 49 116 114 92 91 90 92 85 95 72 77 73 79<br />
Comoros 86 85 29 6 22 21 109 100 – – 31 x 31 x – 19 x – – 10 x 11 x<br />
Congo 87 x 78 x 94 6 12 13 118 112 92 89 86 x 87 x – 93 x – – 39 x 40 x<br />
Cook Islands – – – – 166 149 107 110 98 99 – – – – 76 82 – –<br />
Costa Rica 98 99 92 42 71 72 110 109 – – 96 96 89 – – – 59 x 65 x<br />
Côte d’Ivoire 72 62 86 2 4 4 96 80 67 56 59 x 51 x 61 90 x – – 32 x 22 x<br />
Croatia 100 100 116 71 62 61 93 93 95 97 – – 99 – 88 94 – –<br />
Cuba 100 100 12 23 100 100 104 102 100 100 – – 95 – 86 85 – –<br />
Cyprus 100 100 98 58 81 81 106 105 99 99 – – – – 96 96 – –<br />
Czech Republic – – 122 73 107 105 106 106 – – – – 100 – – – – –<br />
Democratic People’s<br />
Republic of Korea 100 100 4 – – – – – – – 99 99 – – – – 98 98<br />
Democratic Republic<br />
of the Congo 68 62 23 1 3 3 100 87 – – 78 72 55 75 – – 35 28<br />
Denmark – – 126 90 97 96 99 99 95 97 – – 99 – 88 91 – –<br />
Djibouti – – 21 7 4 4 62 56 47 42 67 x 66 x 64 92 x 28 20 45 x 37 x<br />
Dominica – – 164 51 111 114 113 111 – – – – 88 – – – – –<br />
Dominican Republic 96 98 87 36 38 38 115 102 96 90 95 96 – 78 58 67 56 68<br />
Ecuador 98 99 105 31 109 115 114 115 – – 92 y 93 y – – – – 71 y 73 y<br />
Egypt 91 84 101 36 24 23 103 98 – – 90 87 – 99 71 69 70 70<br />
El Salvador 96 96 126 18 63 65 117 111 95 95 – – 86 – 57 59 – –<br />
Equatorial Guinea 98 98 59 – 47 63 88 85 57 56 61 x 60 x 62 – – – 23 x 22 x<br />
Eritrea 92 87 4 6 14 13 48 41 37 33 69 x 64 x 69 – 32 25 23 x 21 x<br />
Estonia 100 100 139 77 96 96 100 98 96 96 – – 98 – 91 93 – –<br />
Ethiopia 63 47 17 1 5 5 106 97 85 80 64 65 47 84 x – – 16 16<br />
Fiji – – 84 28 17 19 106 104 99 99 – – 91 – – – – –<br />
Finland – – 166 89 68 68 99 99 98 98 – – 100 – 94 94 – –<br />
116<br />
Youth (15–24 years)<br />
literacy rate (%)<br />
2007–2011*<br />
male female<br />
Number per 100<br />
population<br />
2011<br />
mobile<br />
phones<br />
Pre-primary school<br />
participation Primary school participation Secondary school participation<br />
Gross enrolment<br />
ratio (%)<br />
2008–2011*<br />
Gross enrolment<br />
ratio (%)<br />
2008–2011*<br />
Net enrolment<br />
ratio (%)<br />
2008–2011*<br />
THE STATE OF THE WORLD’S CHILDREN 2013: <strong>Children</strong> <strong>with</strong> <strong>Disabilities</strong><br />
Net attendance<br />
ratio (%)<br />
2007–2011*<br />
Internet<br />
users male female male female male female male female<br />
Survival rate to last<br />
primary grade (%)<br />
2008–2011*2007–2011*<br />
admin.<br />
data<br />
Net enrolment<br />
ratio (%)<br />
2008–2011*<br />
Net attendance<br />
ratio (%)<br />
2007–2011*<br />
survey<br />
data male female male female
Countries<br />
and areas<br />
Youth (15–24 years)<br />
literacy rate (%)<br />
2007–2011*<br />
male female<br />
Number per 100<br />
population<br />
2011<br />
mobile<br />
phones<br />
Pre-primary school<br />
participation Primary school participation Secondary school participation<br />
Gross enrolment<br />
ratio (%)<br />
2008–2011*<br />
Gross enrolment<br />
ratio (%)<br />
2008–2011*<br />
Net enrolment<br />
ratio (%)<br />
2008–2011*<br />
Net attendance<br />
ratio (%)<br />
2007–2011*<br />
Internet<br />
users male female male female male female male female<br />
Survival rate to last<br />
primary grade (%)<br />
2008–2011*2007–2011*<br />
Net enrolment<br />
ratio (%)<br />
2008–2011*<br />
Net attendance<br />
ratio (%)<br />
2007–2011*<br />
France – – 105 80 109 108 111 109 99 99 – – – – 98 99 – –<br />
Gabon 99 97 117 8 41 43 184 179 – – 94 x 94 x – – – – 34 x 36 x<br />
Gambia 72 62 89 11 30 31 82 84 68 70 40 45 61 93 – – 34 34<br />
Georgia 100 100 102 37 52 64 107 111 – – 95 96 96 98 x – – 85 x 88 x<br />
Germany – – 132 83 114 113 103 102 – – – – 96 – – – – –<br />
Ghana 82 80 85 14 68 70 107 107 84 85 72 74 72 81 51 47 40 44<br />
Greece 99 99 106 53 – – – – – – – – – – – – – –<br />
Grenada – – – – 95 102 103 103 96 99 – – – – 95 86 – –<br />
Guatemala 89 85 140 12 70 72 119 114 100 98 – – – – 43 40 23 x 24 x<br />
Guinea 70 57 44 1 14 14 103 86 83 70 55 x 48 x 66 96 x 36 22 27 x 17 x<br />
Guinea-Bissau 79 65 26 3 7 7 127 119 77 73 69 65 – 79 – – 27 20<br />
Guyana – – 69 32 74 78 83 86 82 86 94 96 83 100 78 83 70 79<br />
Haiti 74 70 41 – – – – – – – 48 x 52 x – 85 x – – 18 x 21 x<br />
Holy See – – – – – – – – – – – – – – – – – –<br />
Honduras 94 96 104 16 43 44 116 116 95 97 87 x 90 x – – – – 35 x 43 x<br />
Hungary 99 99 117 59 85 84 102 101 98 98 – – 98 – 91 91 – –<br />
Iceland – – 106 95 97 97 99 100 99 100 – – – – 87 89 – –<br />
India 88 74 72 10 54 56 116 116 99 98 85 x 81 x – 95 x – – 59 x 49 x<br />
Indonesia 100 99 98 18 43 44 117 119 – – 98 98 – – 68 67 57 y 59 y<br />
Iran (Islamic Republic of) 99 99 75 21 41 44 114 115 – – 94 x 91 x 94 – 92 80 – –<br />
Iraq 85 81 78 5 – – – – – – 91 x 80 x – 93 x – – 46 x 34 x<br />
Ireland – – 108 77 99 97 108 108 99 100 – – – – 98 100 – –<br />
Israel – – 122 70 103 109 103 103 97 97 – – 99 – 97 100 – –<br />
Italy 100 100 152 57 100 96 102 101 100 99 – – 100 – 94 94 – –<br />
Jamaica 93 98 108 32 113 113 91 87 83 81 97 x 98 x 95 99 x 80 87 89 x 93 x<br />
Japan – – 103 80 – – 103 103 – – – – 100 – 99 100 – –<br />
Jordan 99 99 118 35 33 31 92 92 91 91 99 99 – – 83 88 85 89<br />
Kazakhstan 100 100 143 45 48 47 111 111 – – 99 x 98 x 100 100 x 89 88 95 x 95 x<br />
Kenya 92 94 65 28 52 52 115 112 84 85 72 75 – 96 52 48 40 42<br />
Kiribati – – 14 10 – – 111 115 – – – – – – – – 55 y 63 y<br />
Kuwait 99 99 – 74 81 83 104 107 97 100 – – 96 – 86 93 – –<br />
Kyrgyzstan 100 100 105 20 19 19 100 99 95 95 91 x 93 x 98 99 x 79 79 88 x 91 x<br />
Lao People’s Democratic<br />
Republic 89 x 79 x 87 9 22 22 131 122 98 95 81 x 77 x – 65 x 42 38 39 x 32 x<br />
Latvia 100 100 103 72 85 82 101 100 95 97 – – 95 – 83 84 – –<br />
Lebanon 98 99 79 52 82 81 106 103 94 93 98 98 92 93 x 71 79 77 85<br />
Lesotho 86 98 48 4 – – 104 102 72 75 87 91 69 84 x 23 37 26 40<br />
Liberia 71 82 49 3 – – 101 91 – – 32 28 – – – – 14 14<br />
Libya 100 100 156 17 – – – – – – – – – – – – – –<br />
Liechtenstein – – 102 85 102 105 109 102 100 98 – – 79 – 64 64 – –<br />
Lithuania 100 100 151 65 75 73 96 95 96 96 – – 98 – 91 91 – –<br />
Luxembourg – – 148 91 87 86 99 100 96 98 – – – – 84 86 – –<br />
Madagascar 66 64 38 2 9 9 150 147 – – 78 80 35 89 23 24 27 28<br />
Malawi 87 87 25 3 – – 133 138 – – 76 x 79 x 53 81 x 28 27 19 20<br />
Malaysia 98 98 127 61 64 69 – – – – – – 98 – 65 71 – –<br />
Maldives 99 99 166 34 113 115 111 107 97 97 82 84 – 99 – – 52 63<br />
Mali 56 34 68 2 3 3 86 75 71 61 62 55 75 96 x 35 24 38 24<br />
Malta 97 99 125 69 119 115 101 101 93 94 – – 80 – 82 80 – –<br />
Marshall Islands – – – – 45 47 102 101 – – – – 83 – – – – –<br />
Mauritania 71 65 93 5 – – 99 105 73 76 56 59 71 77 – – 21 17<br />
Mauritius 96 98 99 35 97 96 99 100 92 94 – – 98 – – – – –<br />
Mexico 98 98 82 36 101 102 115 113 99 100 97 x 97 x 94 – 70 73 – –<br />
Micronesia<br />
(Federated States of) – – – – – – – – – – – – – – – – – –<br />
Monaco – – 86 – – – – – – – – – – – – – – –<br />
Mongolia 94 97 105 20 76 79 123 121 100 99 95 97 94 99 – – 91 95<br />
Montenegro 99 99 – 40 32 30 107 106 – – 97 x 98 x – 97 x – – 90 x 92 x<br />
Morocco 87 72 113 51 65 50 115 108 95 93 91 x 88 x 91 – – – 39 x 36 x<br />
Mozambique 79 65 33 4 – – 121 109 95 89 82 80 27 60 17 15 21 20<br />
Myanmar 96 96 3 1 10 10 126 126 – – 90 91 75 93 49 52 52 y 53 y<br />
Namibia 91 95 105 12 – – 108 107 84 89 91 93 83 89 x – – 47 62<br />
Nauru – – 65 – 96 93 90 96 – – – – – – – – 52 y 69 y<br />
Nepal 88 78 44 9 – – – – – – 67 y 70 y – 95 x – – 46 x 38 x<br />
Netherlands – – – 92 93 93 108 107 – – – – – – 87 88 – –<br />
admin.<br />
data<br />
TABLE 5 EducATion<br />
survey<br />
data male female male female<br />
STATISTICAL TABLES 117
TABLE 5 EduCATION<br />
Countries<br />
and areas<br />
New Zealand – – 109 86 91 95 101 101 99 100 – – – – 94 95 – –<br />
Nicaragua 85 x 89 x 82 11 55 56 119 116 93 95 71 y 70 y – 56 x 43 49 35 x 47 x<br />
Niger 52 x 23 x 27 1 4 4 73 60 64 52 44 x 31 x 69 88 x 13 8 13 x 8 x<br />
Nigeria 78 66 59 28 14 14 87 79 60 55 65 60 80 98 – – 45 43<br />
Niue – – – – – – – – – – – – – – – – – –<br />
Norway – – 117 94 100 98 99 99 99 99 – – 99 – 94 94 – –<br />
Oman 98 98 169 68 45 45 107 104 100 97 – – – – 89 90 – –<br />
Pakistan 79 61 62 9 – – 104 85 81 67 70 62 62 – 38 29 35 29<br />
Palau – – 75 – – – – – – – – – – – – – – –<br />
Panama 98 97 204 43 67 67 109 106 99 98 – – 94 – 66 72 – –<br />
Papua New Guinea 65 72 34 2 101 99 63 57 – – – – – – – – – –<br />
Paraguay 99 99 99 24 35 35 101 98 86 86 87 89 78 – 58 62 81 x 80 x<br />
Peru 98 97 110 37 79 79 108 108 98 98 96 96 90 95 77 78 81 y 82 y<br />
Philippines 97 98 92 29 51 52 107 105 88 90 88 x 89 x 76 90 x 56 67 55 x 70 x<br />
Poland 100 100 128 65 65 66 98 97 96 96 – – 98 – 90 92 – –<br />
Portugal 100 100 115 55 82 82 116 112 99 100 – – – – – – – –<br />
Qatar 96 98 123 86 57 54 103 103 96 97 – – – – 76 93 – –<br />
Republic of Korea – – 109 84 118 119 106 105 99 98 – – 99 – 96 95 – –<br />
Republic of Moldova 99 100 105 38 76 75 94 93 90 90 84 x 85 x 95 100 x 78 79 82 x 85 x<br />
Romania 97 97 109 44 79 79 96 95 88 87 – – 97 – 82 83 – –<br />
Russian Federation 100 100 179 49 91 89 99 99 95 96 – – 96 – – – – –<br />
Rwanda 77 78 41 7 10 11 141 144 – – 86 89 – 76 x – – 15 16<br />
Saint Kitts and Nevis – – – – 92 88 93 94 86 86 – – 74 – 89 88 – –<br />
Saint Lucia – – 123 42 62 59 96 92 90 89 – – 92 – 85 85 – –<br />
Saint Vincent<br />
and the Grenadines – – 121 43 79 80 109 101 – – – – – – 85 96 – –<br />
Samoa 99 100 – – 35 41 107 109 93 97 88 y 89 y – – 73 83 51 y 70 y<br />
San Marino – – 112 50 96 89 89 101 91 93 – – – – – – – –<br />
Sao Tome and Principe 95 96 68 20 44 48 131 130 – – 86 85 68 84 44 52 30 31<br />
Saudi Arabia 99 97 191 48 – – 106 106 90 89 – – – – 78 83 – –<br />
Senegal 74 56 73 18 12 14 84 89 76 80 60 63 60 93 x – – 35 32<br />
Serbia 99 99 125 42 53 53 96 96 95 94 98 99 99 99 89 91 88 90<br />
Seychelles 99 99 146 43 106 97 117 117 – – – – – – – – – –<br />
Sierra Leone 69 50 36 – 7 7 129 120 – – 73 76 – 93 – – 40 33<br />
Singapore 100 100 149 75 – – – – – – – – 99 – – – – –<br />
Slovakia – – 109 74 92 89 102 102 – – – – 98 – – – – –<br />
Slovenia 100 100 107 72 87 85 98 97 97 97 – – 100 – 91 92 – –<br />
Solomon Islands – – 50 6 49 50 – – – – 63 y 69 y – – – – 29 y 30 y<br />
Somalia – – 7 1 – – – – – – 18 x 15 x – 85 x – – 12 x 8 x<br />
South Africa 97 98 127 21 65 65 104 100 90 91 80 x 83 x – – – – 41 x 48 x<br />
South Sudan s – – – – – – – – – – 32 25 – 65 – – 8 4<br />
Spain 100 100 114 68 126 127 106 105 100 100 – – 99 – 94 96 – –<br />
Sri Lanka 98 99 87 15 – – 99 99 94 94 – – – – – – – –<br />
State of Palestine 99 99 – 55 40 39 92 90 90 88 91 x 92 x – – 81 87 – –<br />
Sudan s – – – – – – – – – – 78 72 – 82 – – 33 30<br />
Suriname 98 99 179 32 85 86 116 111 91 91 95 x 94 x 90 92 x 46 55 56 x 67 x<br />
Swaziland 92 95 64 18 22 23 121 111 86 85 96 97 84 93 29 37 42 52<br />
Sweden – – 119 91 95 95 102 101 100 99 – – 99 – 94 94 – –<br />
Switzerland – – 130 85 99 100 103 102 99 99 – – – – 84 82 – –<br />
Syrian Arab Republic 96 94 63 23 10 9 119 116 100 98 87 x 86 x 95 100 x 67 67 63 x 63 x<br />
Tajikistan 100 100 91 13 9 8 104 100 99 96 99 y 96 y 99 100 x 90 80 89 x 74 x<br />
Thailand 98 x 98 x 113 24 98 101 91 90 90 89 98 x 98 x – 99 x 68 76 77 x 83 x<br />
The former Yugoslav<br />
Republic of Macedonia 99 99 109 57 25 26 89 91 97 99 99 98 – 99 – – 84 81<br />
Timor-Leste 80 79 53 1 – – 119 115 86 86 71 73 67 91 34 39 43 48<br />
Togo 88 75 50 4 9 9 147 132 – – 91 87 59 90 – – 51 40<br />
Tonga 99 x 100 x 53 25 – – – – – – – – – – – – – –<br />
Trinidad and Tobago 100 100 136 55 – – 107 103 98 97 98 x 98 x 89 98 x – – 84 x 90 x<br />
Tunisia 98 96 117 39 – – 111 107 – – 95 x 93 x 95 – – – – –<br />
Turkey 99 97 89 42 22 21 103 101 98 97 94 y 92 y 92 95 x 77 71 – –<br />
Turkmenistan 100 100 69 5 – – – – – – 99 x 99 x – 100 x – – 84 x 84 x<br />
Tuvalu – – 22 30 – – – – – – – – – – – – 35 y 47 y<br />
Uganda 90 85 48 13 14 14 120 122 90 92 82 y 80 y 32 72 x – – 17 y 17 y<br />
Ukraine 100 100 123 31 99 96 99 100 91 91 70 76 98 100 86 86 85 85<br />
118<br />
Youth (15–24 years)<br />
literacy rate (%)<br />
2007–2011*<br />
male female<br />
Number per 100<br />
population<br />
2011<br />
mobile<br />
phones<br />
Pre-primary school<br />
participation Primary school participation Secondary school participation<br />
Gross enrolment<br />
ratio (%)<br />
2008–2011*<br />
Gross enrolment<br />
ratio (%)<br />
2008–2011*<br />
Net enrolment<br />
ratio (%)<br />
2008–2011*<br />
THE STATE OF THE WORLD’S CHILDREN 2013: <strong>Children</strong> <strong>with</strong> <strong>Disabilities</strong><br />
Net attendance<br />
ratio (%)<br />
2007–2011*<br />
Internet<br />
users male female male female male female male female<br />
Survival rate to last<br />
primary grade (%)<br />
2008–2011*2007–2011*<br />
admin.<br />
data<br />
Net enrolment<br />
ratio (%)<br />
2008–2011*<br />
Net attendance<br />
ratio (%)<br />
2007–2011*<br />
survey<br />
data male female male female
Countries<br />
and areas<br />
Youth (15–24 years)<br />
literacy rate (%)<br />
2007–2011*<br />
male female<br />
Number per 100<br />
population<br />
2011<br />
mobile<br />
phones<br />
United Arab Emirates 94 x 97 x 149 70 – – – – – – – – – – – – – –<br />
United Kingdom – – 131 82 81 82 106 106 100 100 – – – – 95 97 – –<br />
United Republic<br />
of Tanzania 78 76 56 12 33 34 101 103 98 98 79 82 81 91 x – – 26 24<br />
United States – – 106 78 68 70 102 101 95 96 – – 93 – 89 90 – –<br />
Uruguay 98 99 141 51 89 89 115 111 100 99 – – 95 – 66 73 – –<br />
Uzbekistan 100 100 92 30 26 26 95 93 93 91 96 x 96 x 98 100 x 93 91 91 x 90 x<br />
Vanuatu 94 94 – – 58 59 120 114 – – 80 82 71 88 46 49 38 36<br />
Venezuela<br />
(Bolivarian Republic of) 98 99 98 40 71 76 104 101 95 95 91 x 93 x 92 82 x 68 76 30 x 43 x<br />
Viet Nam 97 96 143 35 84 79 109 103 – – 98 98 – 99 – – 78 84<br />
Yemen 96 74 47 15 1 1 96 78 86 70 75 x 64 x – 73 x 49 31 49 x 27 x<br />
Zambia 82 67 61 12 – – 115 116 91 94 81 82 53 87 – – 38 36<br />
Zimbabwe – – 72 16 – – – – – – 87 89 – 79 x – – 48 49<br />
MEMORANDUM<br />
Sudan and South Sudan s – – 56 19 – – – – – – – – – – – – – –<br />
SUMMARY INDICATORS #<br />
Sub-Saharan Africa 76 67 53 13 18 18 103 96 78 74 72 70 60 – – – 31 29<br />
Eastern and<br />
Southern Africa 80 72 51 11 21 22 113 108 88 85 75 75 49 – 33 30 23 23<br />
West and Central<br />
Africa 73 61 54 14 14 14 96 86 69 64 68 64 68 90 – – 40 36<br />
Middle East and<br />
North Africa 94 89 94 29 25 23 103 97 92 87 – – – – 68 63 – –<br />
South Asia 86 73 69 9 48 49 107 105 93 91 83 79 – 95 54 46 55 46<br />
East Asia and Pacific 99 99 81 35 56 56 110 112 96 96 96 ** 97 ** 95 – 70 74 61 ** 63 **<br />
Latin America<br />
and Caribbean 97 97 107 39 70 70 116 112 96 95 – – 91 – 71 76 – –<br />
CEE/CIS 99 99 132 42 57 56 100 99 95 95 – – 96 – 83 82 – –<br />
Least developed countries 76 68 42 6 13 13 106 100 82 78 76 75 56 – 35 29 27 24<br />
World 92 87 85 33 48 48 107 105 92 90 82 ** 79 ** 81 – 64 61 49 ** 45 **<br />
s Due to the cession in July 2011 of the Republic of South Sudan by the Republic of the Sudan, and its subsequent admission to the United Nations on 14 July 2011, disaggregated data for the Sudan and South Sudan as separate<br />
States are not yet available for all indicators. Aggregated data presented are for the Sudan pre-cession (see Memorandum item).<br />
# For a complete list of countries and areas in the regions, subregions and country categories, see page 98.<br />
DEFINITIONS OF THE INDICATORS<br />
Youth literacy rate – Number of literate persons aged 15–24 years, expressed as a percentage of the total population in<br />
that group.<br />
Mobile phones – The number of active subscriptions to a public mobile telephone service, including the number of prepaid<br />
SIM cards active during the past three months.<br />
Internet users – The estimated number of Internet users, including those using the Internet from any device (including<br />
mobile phones) in the last 12 months.<br />
Pre-primary school gross enrolment ratio – Number of children enrolled in pre-primary school, regardless of age,<br />
expressed as a percentage of the total number of children of official pre-primary school age.<br />
Primary school gross enrolment ratio – Number of children enrolled in primary school, regardless of age, expressed as a<br />
percentage of the total number of children of official primary school age.<br />
Primary school net enrolment ratio – Number of children enrolled in primary or secondary school who are of official<br />
primary school age, expressed as a percentage of the total number of children of official primary school age. Because of the<br />
inclusion of primary-school-aged children enrolled in secondary school, this indicator can also be referred to as a primary<br />
adjusted net enrolment ratio.<br />
Primary school net attendance ratio – Number of children attending primary or secondary school who are of official<br />
primary school age, expressed as a percentage of the total number of children of official primary school age. Because of<br />
the inclusion of primary-school-aged children attending secondary school, this indicator can also be referred to as a primary<br />
adjusted net attendance ratio.<br />
Survival rate to last primary grade – Percentage of children entering the first grade of primary school who eventually<br />
reach the last grade of primary school.<br />
Secondary school net enrolment ratio – Number of children enrolled in secondary school who are of official secondary<br />
school age, expressed as a percentage of the total number of children of official secondary school age. Secondary net<br />
enrolment ratio does not include secondary-school-aged children enrolled in tertiary education owing to challenges in age<br />
reporting and recording at that level.<br />
Secondary school net attendance ratio – Number of children attending secondary or tertiary school who are of official<br />
secondary school age, expressed as a percentage of the total number of children of official secondary school age. Because of<br />
the inclusion<br />
of secondary-school-aged children attending tertiary school, this indicator can also be referred to as a secondary adjusted net<br />
attendance ratio.<br />
All data refer to official International Standard Classifications of Education (ISCED) for the primary and<br />
secondary education levels and thus may not directly correspond to a country-specific school system.<br />
Pre-primary school<br />
participation Primary school participation Secondary school participation<br />
Gross enrolment<br />
ratio (%)<br />
2008–2011*<br />
Gross enrolment<br />
ratio (%)<br />
2008–2011*<br />
Net enrolment<br />
ratio (%)<br />
2008–2011*<br />
Net attendance<br />
ratio (%)<br />
2007–2011*<br />
Internet<br />
users male female male female male female male female<br />
Survival rate to last<br />
primary grade (%)<br />
2008–2011*2007–2011*<br />
admin.<br />
data<br />
TABLE 5 EduCATION<br />
Net enrolment<br />
ratio (%)<br />
2008–2011*<br />
Net attendance<br />
ratio (%)<br />
2007–2011*<br />
survey<br />
data male female male female<br />
MAIN DATA SOURCES<br />
Youth literacy – UNESCO Institute for Statistics (UIS).<br />
Phone and Internet use – International Telecommunications Union, Geneva.<br />
Pre-primary, primary and secondary enrolment – UIS. Estimates based on<br />
administrative data from International Education Management Information Systems (EMIS)<br />
<strong>with</strong> United Nations population estimates.<br />
Primary and secondary school attendance – Demographic and Health Surveys (DHS),<br />
Multiple Indicator Cluster Surveys (MICS) and other national household surveys.<br />
Survival rate to last primary grade – Administrative data: UIS; survey data: DHS and<br />
MICS. Regional and global averages calculated by UNICEF.<br />
NOTES<br />
− Data not available.<br />
x Data refer to years or periods other than those specified in the column heading. Such<br />
data are not included in the calculation of regional and global averages, <strong>with</strong> the<br />
exception of 2005–2006 data from India. Estimates from data years prior to 2000 are not<br />
displayed.<br />
y Data differ from the standard definition or refer to only part of a country. If they fall <strong>with</strong>in<br />
the noted reference period, such data are included in the calculation of regional and global<br />
averages.<br />
z Data provided by the Chinese Ministry of Education. The UNESCO Institute for Statistics<br />
dataset does not currently include net enrolment rates or primary school survival for<br />
China.<br />
* Data refer to the most recent year available during the period specified in the column<br />
heading.<br />
** Excludes China.<br />
STATISTICAL TABLES 119
TABLE 6: dEmOGRApHIC INdICATORS<br />
Countries<br />
and areas<br />
Afghanistan 32,358 17,219 5,686 4.3 2.6 29 22 16 52 52 43 35 42 49 6.2 24 5.6 4.1<br />
Albania 3,216 877 203 -0.1 0.1 8 6 6 33 25 13 67 72 77 1.5 53 1.7 1.5<br />
Algeria 35,980 11,641 3,464 1.7 1.0 16 6 5 49 32 20 53 67 73 2.2 73 3.3 1.7<br />
Andorra 86 16 4 2.3 1.4 – – – – – – – – – – 87 1.9 1.0<br />
Angola 19,618 10,399 3,393 3.1 2.4 27 23 14 52 53 41 37 41 51 5.3 59 5.3 3.3<br />
Antigua and Barbuda 90 28 8 1.7 0.8 – – – – – – – – – – 30 0.9 1.5<br />
Argentina 40,765 12,105 3,423 1.1 0.7 9 8 8 23 22 17 66 72 76 2.2 93 1.4 0.8<br />
Armenia 3,100 763 225 -0.6 0.0 5 8 9 23 21 15 70 68 74 1.7 64 -0.9 0.3<br />
Australia 22,606 5,190 1,504 1.3 1.1 9 7 7 20 15 14 71 77 82 2.0 89 1.5 1.2<br />
Austria 8,413 1,512 381 0.4 0.1 13 11 9 15 11 9 70 75 81 1.4 68 0.6 0.5<br />
Azerbaijan 9,306 2,430 846 1.2 0.8 7 7 7 29 27 20 65 65 71 2.2 54 1.2 1.4<br />
Bahamas 347 95 27 1.4 0.9 6 6 5 26 24 15 66 69 76 1.9 84 1.7 1.1<br />
Bahrain 1,324 311 102 4.7 1.2 7 3 3 38 29 19 64 72 75 2.5 89 4.7 1.3<br />
Bangladesh 150,494 55,515 14,421 1.7 1.0 23 10 6 47 36 20 42 59 69 2.2 28 3.4 2.7<br />
Barbados 274 59 15 0.3 0.1 9 8 9 22 16 11 69 75 77 1.6 44 1.7 1.1<br />
Belarus 9,559 1,766 527 -0.3 -0.4 7 11 14 16 14 11 71 71 70 1.5 75 0.3 0.0<br />
Belgium 10,754 2,182 619 0.4 0.2 12 11 10 15 12 11 71 76 80 1.8 97 0.4 0.3<br />
Belize 318 131 37 2.4 1.7 8 5 4 42 37 24 66 72 76 2.7 45 2.2 1.8<br />
Benin 9,100 4,568 1,546 3.1 2.5 26 17 12 48 47 39 40 49 56 5.2 45 4.3 3.7<br />
Bhutan 738 258 70 1.3 1.0 23 14 7 47 38 20 41 53 67 2.3 36 5.0 2.6<br />
Bolivia (Plurinational<br />
State of) 10,088 4,254 1,230 2.0 1.5 20 11 7 46 36 26 46 59 67 3.3 67 2.9 2.0<br />
Bosnia and Herzegovina 3,752 686 167 -0.7 -0.4 7 9 10 23 15 8 66 67 76 1.1 48 0.3 0.6<br />
Botswana 2,031 788 229 1.8 0.8 13 7 13 46 35 23 55 64 53 2.7 62 3.7 1.5<br />
Brazil 196,655 59,010 14,662 1.3 0.6 10 7 6 35 24 15 59 66 73 1.8 85 1.9 0.8<br />
Brunei Darussalam 406 124 37 2.3 1.3 7 4 3 36 29 19 67 73 78 2.0 76 3.0 1.7<br />
Bulgaria 7,446 1,249 378 -0.8 -0.8 9 12 15 16 12 10 71 71 73 1.5 73 -0.3 -0.2<br />
Burkina Faso 16,968 8,824 3,047 2.9 2.8 23 17 12 48 47 43 41 49 55 5.8 27 6.0 5.2<br />
Burundi 8,575 3,813 1,221 2.0 1.5 20 19 14 44 46 34 44 46 50 4.2 11 4.7 4.0<br />
Cambodia 14,305 5,480 1,505 1.9 1.0 20 12 8 42 44 22 44 56 63 2.5 20 3.1 2.4<br />
Cameroon 20,030 9,420 3,102 2.4 1.9 19 14 14 45 42 36 46 53 52 4.4 52 3.7 2.8<br />
Canada 34,350 6,926 1,936 1.0 0.8 7 7 8 17 14 11 73 77 81 1.7 81 1.3 0.9<br />
Cape Verde 501 190 50 1.7 0.8 15 9 5 41 39 20 53 65 74 2.3 63 3.4 1.7<br />
Central African Republic 4,487 2,098 658 2.0 1.8 23 17 16 43 41 35 42 49 48 4.5 39 2.3 2.8<br />
Chad 11,525 5,992 2,047 3.1 2.5 22 17 16 46 47 44 44 51 50 5.9 22 3.3 3.5<br />
Chile 17,270 4,615 1,222 1.3 0.6 10 6 6 29 23 14 62 74 79 1.8 89 1.6 0.8<br />
China 1,347,565 317,892 82,205 0.8 0.2 9 7 7 36 21 12 63 69 73 1.6 51 3.9 1.8<br />
Colombia 46,927 15,951 4,509 1.6 1.0 9 6 5 38 27 19 61 68 74 2.3 75 2.1 1.3<br />
Comoros 754 366 124 2.6 2.3 18 11 9 47 37 37 48 56 61 4.9 28 2.6 3.0<br />
Congo 4,140 1,940 637 2.6 2.1 14 12 11 43 38 35 53 56 57 4.5 64 3.4 2.7<br />
Cook Islands 20 8 2 0.7 0.4 – – – – – – – – – – 74 1.9 0.8<br />
Costa Rica 4,727 1,405 359 2.1 1.0 7 4 4 33 27 16 67 76 79 1.8 65 3.2 1.6<br />
Côte d’Ivoire 20,153 9,539 2,992 2.3 2.1 21 13 12 52 41 34 44 53 55 4.3 51 3.5 3.2<br />
Croatia 4,396 806 215 -0.1 -0.3 10 11 12 15 12 10 69 72 77 1.5 58 0.2 0.3<br />
Cuba 11,254 2,343 543 0.3 -0.1 7 7 7 29 17 10 70 74 79 1.5 75 0.4 0.0<br />
Cyprus 1,117 244 65 1.8 0.8 7 7 7 19 19 12 73 77 80 1.5 70 2.0 1.1<br />
Czech Republic 10,534 1,836 567 0.1 0.1 12 12 10 16 12 11 70 72 78 1.5 73 0.0 0.2<br />
Democratic People’s<br />
Republic of Korea 24,451 6,757 1,706 0.9 0.4 7 5 10 35 21 14 62 71 69 2.0 60 1.1 0.7<br />
Democratic Republic<br />
of the Congo 67,758 35,852 12,037 3.0 2.4 21 19 16 48 50 43 44 47 48 5.7 34 4.0 3.8<br />
Denmark 5,573 1,212 327 0.4 0.3 10 12 10 15 12 11 73 75 79 1.9 87 0.5 0.4<br />
Djibouti 906 382 115 2.3 1.8 20 14 10 49 42 29 43 51 58 3.7 77 2.4 1.9<br />
Dominica 68 21 6 -0.2 0.1 – – – – – – – – – – 67 -0.3 0.4<br />
Dominican Republic 10,056 3,672 1,051 1.6 1.0 11 6 6 42 30 21 58 68 73 2.5 70 2.7 1.5<br />
Ecuador 14,666 5,234 1,469 1.7 1.0 12 6 5 42 29 20 58 69 76 2.4 67 2.7 1.7<br />
Egypt 82,537 30,537 9,092 1.8 1.3 16 9 5 41 32 23 50 62 73 2.7 43 1.8 2.0<br />
El Salvador 6,227 2,394 631 0.7 0.7 13 8 7 43 32 20 57 66 72 2.2 65 2.0 1.3<br />
Equatorial Guinea 720 327 111 3.1 2.2 25 20 14 39 47 36 40 47 51 5.1 39 3.7 3.0<br />
Eritrea 5,415 2,588 879 2.6 2.3 21 16 8 47 41 36 43 48 62 4.4 21 4.0 4.4<br />
Estonia 1,341 250 80 -0.7 -0.2 11 13 13 15 14 12 71 69 75 1.7 69 -0.9 0.0<br />
Ethiopia 84,734 40,698 11,915 2.7 1.8 21 18 9 47 48 31 43 47 59 4.0 17 4.1 3.6<br />
Fiji 868 300 91 0.8 0.5 8 6 7 34 29 21 60 66 69 2.6 52 1.9 1.2<br />
Finland 5,385 1,084 303 0.4 0.2 10 10 10 14 13 11 70 75 80 1.9 84 0.6 0.4<br />
France 63,126 13,837 3,985 0.5 0.4 11 9 9 17 13 13 72 77 82 2.0 86 1.2 0.8<br />
Gabon 1,534 642 188 2.4 1.8 20 11 9 34 38 27 47 61 63 3.2 86 3.4 2.0<br />
120<br />
Population (thousands)<br />
2011<br />
Population annual<br />
growth rate (%) Crude death rate Crude birth rate Life expectancy<br />
Total Urbanized Average annual<br />
fertility population growth rate of urban<br />
rate (%) population (%)<br />
total under 18 under 5 1990–2011 2011–2030 2011 2011<br />
a 1970 1990 2011 1970 1990 2011 1970 1990 2011 1990–2011 2011–2030a THE STATE OF THE WORLD’S CHILDREN 2013: <strong>Children</strong> <strong>with</strong> <strong>Disabilities</strong>
Countries<br />
and areas<br />
TABLE 6 dEmOGRApHIC INdICATORS<br />
Population (thousands)<br />
2011<br />
Population annual<br />
growth rate (%) Crude death rate Crude birth rate Life expectancy<br />
Total Urbanized Average annual<br />
fertility population growth rate of urban<br />
rate (%) population (%)<br />
total under 18 under 5 1990–2011 2011–2030 2011 2011<br />
a 1970 1990 2011 1970 1990 2011 1970 1990 2011 1990–2011 2011–2030a Gambia 1,776 897 292 2.9 2.4 26 13 9 51 47 38 38 53 58 4.8 57 4.8 3.2<br />
Georgia 4,329 892 258 -1.1 -0.7 9 9 11 19 17 12 67 71 74 1.5 53 -1.3 -0.3<br />
Germany 82,163 13,437 3,504 0.2 -0.2 12 11 11 14 11 9 71 75 80 1.4 74 0.2 0.1<br />
Ghana 24,966 11,174 3,591 2.5 2.0 17 11 8 47 39 31 49 57 64 4.1 52 4.2 3.0<br />
Greece 11,390 2,001 600 0.5 0.1 8 9 10 17 10 10 72 77 80 1.5 61 0.7 0.6<br />
Grenada 105 35 10 0.4 0.1 9 8 6 28 28 19 64 69 76 2.2 39 1.2 1.0<br />
Guatemala 14,757 7,072 2,192 2.4 2.3 15 9 5 44 39 32 52 62 71 3.9 50 3.3 3.2<br />
Guinea 10,222 5,045 1,691 2.7 2.3 30 21 13 49 46 38 34 44 54 5.2 35 3.8 3.7<br />
Guinea-Bissau 1,547 739 244 2.0 2.0 26 22 16 46 46 38 37 43 48 5.0 44 4.1 3.2<br />
Guyana 756 297 60 0.2 0.3 12 10 6 37 25 18 56 61 70 2.2 28 0.0 1.0<br />
Haiti 10,124 4,271 1,245 1.7 1.1 18 13 9 39 37 26 47 55 62 3.3 53 4.7 2.6<br />
Holy See 0 0 0 -2.5 -0.1 – – – – – – – – – – 100 -2.5 -0.1<br />
Honduras 7,755 3,338 975 2.2 1.7 15 7 5 47 38 26 52 66 73 3.1 52 3.4 2.6<br />
Hungary 9,966 1,800 493 -0.2 -0.2 11 14 13 15 12 10 69 69 74 1.4 69 0.1 0.4<br />
Iceland 324 81 24 1.1 1.0 7 7 6 21 17 15 74 78 82 2.1 94 1.3 1.1<br />
India 1,241,492 448,336 128,542 1.7 1.1 16 11 8 38 31 22 49 58 65 2.6 31 2.6 2.3<br />
Indonesia 242,326 77,471 21,210 1.3 0.8 15 8 7 40 26 18 52 62 69 2.1 51 3.7 1.9<br />
Iran (Islamic Republic of) 74,799 20,819 6,269 1.5 0.6 16 8 5 42 34 17 51 62 73 1.6 69 2.4 0.9<br />
Iraq 32,665 16,146 5,294 3.0 2.8 12 7 6 45 38 35 58 67 69 4.6 66 2.8 2.9<br />
Ireland 4,526 1,137 370 1.2 0.9 11 9 6 22 14 16 71 75 81 2.1 62 1.6 1.4<br />
Israel 7,562 2,417 754 2.5 1.4 7 6 5 26 22 21 72 76 82 2.9 92 2.6 1.4<br />
Italy 60,789 10,308 2,910 0.3 0.0 10 10 10 17 10 9 71 77 82 1.4 68 0.4 0.4<br />
Jamaica 2,751 956 254 0.7 0.2 8 7 7 36 26 18 68 71 73 2.3 52 1.0 0.6<br />
Japan 126,497 20,375 5,418 0.2 -0.3 7 7 9 19 10 8 72 79 83 1.4 91 1.0 0.0<br />
Jordan 6,330 2,747 817 2.9 1.5 11 5 4 51 36 25 61 70 73 3.0 83 3.6 1.7<br />
Kazakhstan 16,207 4,800 1,726 -0.1 0.8 9 9 10 26 23 21 62 67 67 2.5 54 -0.3 1.0<br />
Kenya 41,610 20,317 6,805 2.7 2.4 15 10 10 51 42 37 52 59 57 4.7 24 4.4 4.1<br />
Kiribati 101 36 10 1.6 1.4 – – – – – – – – – – 44 2.7 2.0<br />
Kuwait 2,818 863 282 1.4 1.9 6 3 3 49 21 18 67 72 75 2.3 98 1.4 1.9<br />
Kyrgyzstan 5,393 1,957 624 1.0 1.1 11 8 7 31 31 24 60 66 68 2.7 35 0.7 1.8<br />
Lao People’s<br />
Democratic Republic 6,288 2,581 682 1.9 1.1 18 13 6 42 42 22 46 54 67 2.7 34 5.7 3.3<br />
Latvia 2,243 382 117 -0.8 -0.4 11 13 14 14 14 11 70 69 73 1.5 68 -0.9 -0.2<br />
Lebanon 4,259 1,271 328 1.8 0.5 9 7 7 33 26 15 65 69 73 1.8 87 2.0 0.6<br />
Lesotho 2,194 970 276 1.4 0.8 17 10 15 43 36 28 49 59 48 3.1 28 4.6 2.9<br />
Liberia 4,129 2,057 700 3.2 2.4 23 21 11 49 46 39 41 42 57 5.2 48 2.2 3.2<br />
Libya 6,423 2,293 717 1.9 1.0 16 4 4 49 26 23 52 68 75 2.5 78 2.0 1.3<br />
Liechtenstein 36 7 2 1.1 0.7 – – – – – – – – – – 14 0.3 1.1<br />
Lithuania 3,307 616 173 -0.5 -0.4 9 11 14 17 15 11 71 71 72 1.5 67 -0.6 -0.1<br />
Luxembourg 516 110 29 1.4 1.1 12 10 8 13 13 12 70 75 80 1.7 85 1.7 1.3<br />
Madagascar 21,315 10,570 3,378 3.0 2.7 21 16 6 48 45 35 44 51 67 4.6 33 4.6 4.3<br />
Malawi 15,381 8,116 2,829 2.4 3.2 24 18 12 52 48 44 41 47 54 6.0 16 3.8 4.7<br />
Malaysia 28,859 10,244 2,796 2.2 1.3 7 5 5 33 28 20 64 70 74 2.6 73 4.0 1.9<br />
Maldives 320 104 26 1.8 0.9 21 9 4 50 41 17 44 61 77 1.7 41 4.0 2.6<br />
Mali 15,840 8,525 2,995 2.9 2.8 30 21 14 49 49 46 34 44 51 6.2 35 4.8 4.3<br />
Malta 418 77 20 0.6 0.2 9 8 8 16 16 9 70 75 80 1.3 95 0.8 0.3<br />
Marshall Islands 55 20 5 0.7 1.1 – – – – – – – – – – 72 1.2 1.5<br />
Mauritania 3,542 1,635 522 2.7 2.0 18 11 9 47 41 33 47 56 59 4.5 41 2.9 3.0<br />
Mauritius 1,307 344 81 1.0 0.3 7 6 7 29 22 13 63 69 73 1.6 42 0.8 0.8<br />
Mexico 114,793 39,440 10,943 1.5 0.9 10 5 5 43 28 19 61 71 77 2.3 78 1.9 1.2<br />
Micronesia<br />
(Federated States of) 112 48 13 0.7 0.8 9 7 6 41 34 24 62 66 69 3.4 23 0.1 1.6<br />
Monaco 35 7 2 0.7 0.0 – – – – – – – – – – 100 0.7 0.0<br />
Mongolia 2,800 934 317 1.2 1.2 15 10 6 44 32 23 56 61 68 2.5 69 2.0 2.0<br />
Montenegro 632 145 39 0.2 0.0 3 5 10 10 11 12 69 76 75 1.6 63 1.5 0.4<br />
Morocco 32,273 10,790 3,048 1.3 0.8 17 8 6 47 30 19 52 64 72 2.2 57 2.0 1.4<br />
Mozambique 23,930 12,086 3,877 2.7 2.1 25 21 14 48 43 37 39 43 50 4.8 31 4.6 3.3<br />
Myanmar 48,337 14,832 3,981 1.0 0.6 16 11 8 40 27 17 50 57 65 2.0 33 2.3 2.2<br />
Namibia 2,324 994 288 2.4 1.4 15 9 8 43 38 26 53 61 62 3.2 38 3.9 2.8<br />
Nauru 10 4 1 0.6 0.4 – – – – – – – – – – 100 0.6 0.4<br />
Nepal 30,486 12,883 3,453 2.2 1.4 21 13 6 44 39 24 43 54 69 2.7 17 5.3 3.4<br />
Netherlands 16,665 3,526 907 0.5 0.2 8 9 8 17 13 11 74 77 81 1.8 83 1.4 0.5<br />
New Zealand 4,415 1,091 320 1.2 0.9 9 8 7 22 17 15 71 75 81 2.2 86 1.3 1.0<br />
Nicaragua 5,870 2,390 684 1.7 1.1 14 7 5 46 37 23 54 64 74 2.6 58 2.1 1.7<br />
Niger 16,069 8,922 3,196 3.4 3.4 26 24 13 56 56 48 38 41 55 7.0 18 4.2 5.3<br />
Nigeria 162,471 79,931 27,195 2.4 2.4 22 19 14 46 44 40 42 46 52 5.5 50 4.1 3.5<br />
STATISTICAL TABLES 121
TABLE 6 dEmOGRApHIC INdICATORS<br />
Countries<br />
and areas<br />
Niue 1 1 0 -2.3 -1.5 – – – – – – – – – – 38 -1.4 -0.5<br />
Norway 4,925 1,117 309 0.7 0.7 10 11 8 17 14 12 74 77 81 1.9 79 1.2 0.9<br />
Oman 2,846 910 290 2.0 1.2 16 5 4 49 38 18 51 71 73 2.2 73 2.5 1.6<br />
Pakistan 176,745 73,756 22,064 2.2 1.5 15 10 7 43 40 27 53 61 65 3.3 36 3.0 2.6<br />
Palau 21 7 2 1.5 1.0 – – – – – – – – – – 84 2.4 1.4<br />
Panama 3,571 1,213 345 1.9 1.2 8 5 5 37 26 20 65 72 76 2.5 75 3.5 1.7<br />
Papua New Guinea 7,014 3,168 975 2.5 2.0 17 10 7 44 35 30 46 56 63 3.9 12 1.6 3.6<br />
Paraguay 6,568 2,587 744 2.1 1.5 7 6 5 37 33 24 65 68 72 2.9 62 3.2 2.1<br />
Peru 29,400 10,421 2,902 1.4 1.0 14 7 5 42 30 20 53 66 74 2.5 77 2.0 1.3<br />
Philippines 94,852 39,205 11,161 2.1 1.5 9 7 6 39 33 25 61 65 69 3.1 49 2.1 2.3<br />
Poland 38,299 7,023 2,008 0.0 -0.1 8 10 10 17 15 11 70 71 76 1.4 61 0.0 0.1<br />
Portugal 10,690 1,930 501 0.4 -0.2 11 10 10 21 11 9 67 74 79 1.3 61 1.5 0.5<br />
Qatar 1,870 302 97 6.5 1.2 6 2 2 36 24 12 66 74 78 2.2 99 6.8 1.3<br />
Republic of Korea 48,391 9,842 2,488 0.6 0.2 9 6 6 32 16 10 61 72 81 1.4 83 1.1 0.4<br />
Republic of Moldova 3,545 740 223 -1.0 -0.6 10 10 13 18 19 12 65 68 69 1.5 48 -0.9 0.6<br />
Romania 21,436 3,928 1,093 -0.4 -0.3 9 11 12 21 14 10 68 69 74 1.4 53 -0.4 0.0<br />
Russian Federation 142,836 26,115 8,264 -0.2 -0.2 9 12 14 14 14 12 69 68 69 1.5 74 -0.1 0.0<br />
Rwanda 10,943 5,352 1,909 2.1 2.5 20 32 12 51 45 41 44 33 55 5.3 19 8.1 4.3<br />
Saint Kitts and Nevis 53 17 5 1.3 0.9 – – – – – – – – – – 32 0.9 1.7<br />
Saint Lucia 176 55 15 1.2 0.7 9 6 6 39 28 17 64 71 75 2.0 18 -1.3 -1.4<br />
Saint Vincent<br />
and the Grenadines 109 35 9 0.1 0.1 11 7 7 40 25 17 61 69 72 2.0 49 0.9 0.8<br />
Samoa 184 81 22 0.6 0.5 10 7 5 39 32 24 55 65 72 3.8 20 0.3 0.3<br />
San Marino 32 6 2 1.3 0.3 – – – – – – – – – – 94 1.5 0.4<br />
Sao Tome and Principe 169 79 24 1.8 1.7 13 10 8 41 38 31 55 61 65 3.6 63 3.5 2.5<br />
Saudi Arabia 28,083 9,923 3,186 2.6 1.7 15 5 4 47 36 22 52 69 74 2.7 82 3.0 1.9<br />
Senegal 12,768 6,425 2,125 2.7 2.4 24 13 9 51 44 37 41 53 59 4.7 43 3.1 3.3<br />
Serbia 9,854 2,089 551 0.1 -0.2 9 10 12 18 15 11 68 72 75 1.6 56 0.7 0.4<br />
Seychelles 87 43 14 1.0 0.3 – – – – – – – – – – 54 1.4 1.0<br />
Sierra Leone 5,997 2,965 984 2.0 1.9 29 25 15 47 44 38 35 39 48 4.9 39 2.8 2.9<br />
Singapore 5,188 1,104 238 2.6 0.7 5 5 5 23 19 9 68 76 81 1.3 100 2.6 0.7<br />
Slovakia 5,472 1,024 281 0.2 0.1 9 10 10 18 15 11 70 71 75 1.3 55 0.0 0.3<br />
Slovenia 2,035 344 102 0.3 0.1 10 10 10 17 11 10 69 73 79 1.5 50 0.2 0.4<br />
Solomon Islands 552 254 81 2.8 2.2 13 11 6 45 40 31 54 57 68 4.2 20 4.7 4.0<br />
Somalia 9,557 4,896 1,701 1.8 2.8 24 20 15 51 45 43 40 45 51 6.3 38 2.9 4.1<br />
South Africa 50,460 18,045 4,989 1.5 0.4 14 8 15 38 29 21 53 62 53 2.4 62 2.3 1.1<br />
South Sudan s 10,314 – – 2.6 2.3 – – – – – – – – – – 18 4.0 3.9<br />
Spain 46,455 8,306 2,546 0.8 0.4 9 9 9 20 10 11 72 77 81 1.5 77 1.0 0.6<br />
Sri Lanka 21,045 6,183 1,886 0.9 0.5 9 7 7 31 20 18 63 70 75 2.3 15 0.3 2.0<br />
State of Palestine 4,152 2,051 635 3.3 2.6 13 5 4 50 45 33 56 68 73 4.4 74 3.7 2.9<br />
Sudan s 34,318 – – 2.5 2.1 – – – – – – – – – – 33 3.2 2.9<br />
Suriname 529 176 47 1.3 0.7 9 7 7 37 23 18 63 67 71 2.3 70 2.0 1.1<br />
Swaziland 1,203 548 158 1.6 1.0 18 10 14 49 43 29 48 59 49 3.3 21 1.2 1.5<br />
Sweden 9,441 1,916 562 0.5 0.5 10 11 10 14 14 12 74 78 81 1.9 85 0.6 0.7<br />
Switzerland 7,702 1,435 382 0.7 0.3 9 9 8 16 12 10 73 78 82 1.5 74 0.7 0.5<br />
Syrian Arab Republic 20,766 8,923 2,446 2.5 1.5 11 5 4 47 36 22 60 71 76 2.9 56 3.1 2.2<br />
Tajikistan 6,977 3,052 883 1.3 1.3 10 8 6 40 39 28 60 63 68 3.2 27 0.5 2.1<br />
Thailand 69,519 17,111 4,270 0.9 0.3 10 5 7 38 19 12 60 73 74 1.6 34 1.6 1.6<br />
The former Yugoslav<br />
Republic of Macedonia 2,064 445 112 0.4 -0.1 8 8 9 24 17 11 66 71 75 1.4 59 0.5 0.4<br />
Timor-Leste 1,154 616 201 2.1 2.9 23 18 8 42 43 38 40 46 62 6.1 28 3.6 4.1<br />
Togo 6,155 2,831 870 2.5 1.8 20 14 11 49 42 32 45 53 57 4.0 38 3.8 3.0<br />
Tonga 105 46 14 0.4 0.8 7 6 6 36 31 27 65 70 72 3.9 23 0.6 1.5<br />
Trinidad and Tobago 1,346 334 96 0.5 0.0 7 7 8 27 21 15 65 69 70 1.6 14 2.7 1.7<br />
Tunisia 10,594 3,001 885 1.2 0.7 14 6 6 39 27 17 54 69 75 2.0 66 1.9 1.1<br />
Turkey 73,640 23,107 6,489 1.5 0.9 16 8 5 39 26 18 50 63 74 2.1 72 2.4 1.6<br />
Turkmenistan 5,105 1,785 499 1.6 1.0 11 8 8 37 35 21 58 63 65 2.4 49 1.9 1.8<br />
Tuvalu 10 4 1 0.4 0.6 – – – – – – – – – – 51 1.5 1.3<br />
Uganda 34,509 19,042 6,638 3.2 2.9 16 17 12 49 50 45 50 47 54 6.1 16 4.8 5.3<br />
Ukraine 45,190 7,977 2,465 -0.6 -0.6 9 13 16 15 13 11 71 70 68 1.5 69 -0.5 -0.2<br />
United Arab Emirates 7,891 1,590 451 7.0 1.5 7 3 1 37 26 13 62 72 77 1.7 84 7.3 1.7<br />
United Kingdom 62,417 13,153 3,858 0.4 0.6 12 11 9 15 14 12 72 76 80 1.9 80 0.5 0.8<br />
United Republic<br />
of Tanzania 46,218 23,690 8,267 2.8 3.0 18 15 10 48 44 41 47 51 58 5.5 27 4.5 4.7<br />
United States 313,085 75,491 21,629 1.0 0.8 9 9 8 16 16 14 71 75 79 2.1 82 1.4 1.0<br />
Uruguay 3,380 912 245 0.4 0.3 10 10 9 21 18 15 69 73 77 2.1 93 0.6 0.4<br />
122<br />
Population (thousands)<br />
2011<br />
Population annual<br />
growth rate (%) Crude death rate Crude birth rate Life expectancy<br />
Total Urbanized Average annual<br />
fertility population growth rate of urban<br />
rate (%) population (%)<br />
total under 18 under 5 1990–2011 2011–2030 2011 2011<br />
a 1970 1990 2011 1970 1990 2011 1970 1990 2011 1990–2011 2011–2030a THE STATE OF THE WORLD’S CHILDREN 2013: <strong>Children</strong> <strong>with</strong> <strong>Disabilities</strong>
Countries<br />
and areas<br />
Population (thousands)<br />
2011<br />
Population annual<br />
growth rate (%) Crude death rate Crude birth rate Life expectancy<br />
Total Urbanized Average annual<br />
fertility population growth rate of urban<br />
rate (%) population (%)<br />
total under 18 under 5 1990–2011 2011–2030 2011 2011<br />
a 1970 1990 2011 1970 1990 2011 1970 1990 2011 1990–2011 2011–2030a Uzbekistan 27,760 9,849 2,802 1.4 1.0 10 7 7 36 35 21 63 67 68 2.3 36 0.9 1.7<br />
Vanuatu 246 109 34 2.5 2.2 14 8 5 42 36 29 52 63 71 3.8 25 3.8 3.4<br />
Venezuela (Bolivarian<br />
Republic of) 29,437 10,215 2,935 1.9 1.2 7 5 5 37 29 20 64 71 74 2.4 94 2.4 1.3<br />
Viet Nam 88,792 25,532 7,202 1.3 0.7 18 8 5 41 30 16 48 66 75 1.8 31 3.4 2.5<br />
Yemen 24,800 12,697 4,179 3.5 2.7 24 12 6 51 52 38 40 56 65 5.1 32 5.5 4.3<br />
Zambia 13,475 7,169 2,509 2.6 3.1 17 17 15 49 44 46 49 47 49 6.3 39 2.5 4.3<br />
Zimbabwe 12,754 5,841 1,706 0.9 1.7 13 9 13 48 37 29 55 61 51 3.2 39 2.3 3.0<br />
MEMORANDUM<br />
Sudan and<br />
South Sudan s – 20,660 6,472 – – 19 14 9 46 41 32 45 53 61 4.3 – – –<br />
SUMMARY INDICATORS #<br />
Sub-Saharan Africa 876,497 428,333 140,617 2.5 2.3 20 16 12 47 44 37 44 50 55 4.9 37 3.8 3.4<br />
Eastern and<br />
Southern Africa 418,709 196,675 63,188 2.5 2.2 19 15 12 47 43 35 47 51 56 4.5 30 3.6 3.4<br />
West and Central Africa 422,564 210,616 70,843 2.6 2.4 22 18 13 47 45 39 42 48 53 5.3 43 3.9 3.5<br />
Middle East and<br />
North Africa 415,633 157,845 48,169 2.1 1.5 16 8 5 44 34 24 52 63 71 2.8 60 2.7 1.9<br />
South Asia 1,653,679 614,255 176,150 1.8 1.1 17 11 8 40 33 23 49 59 66 2.7 31 2.8 2.4<br />
East Asia and Pacific 2,032,532 533,810 141,248 1.0 0.4 10 7 7 36 23 14 61 68 73 1.8 50 3.4 1.8<br />
Latin America<br />
and Caribbean 591,212 195,081 52,898 1.4 0.9 10 7 6 36 27 18 60 68 74 2.2 79 2.0 1.1<br />
CEE/CIS 405,743 95,460 28,590 0.2 0.1 10 11 11 20 18 14 66 68 70 1.8 65 0.3 0.6<br />
Least developed countries 851,103 395,405 124,162 2.4 2.1 22 15 10 47 43 33 43 51 59 4.2 29 3.9 3.6<br />
World 6,934,761 2,207,145 638,681 1.3 0.9 12 9 8 33 26 19 59 65 69 2.4 52 2.2 1.7<br />
s Due to the cession in July 2011 of the Republic of South Sudan by the Republic of the Sudan, and its subsequent admission to the United Nations on 14 July 2011, disaggregated data for the Sudan<br />
and South Sudan as separate States are not yet available for all indicators. Aggregated data presented are for the Sudan pre-cession (see Memorandum item).<br />
# For a complete list of countries and areas in the regions, subregions and country categories, see page 98.<br />
DEFINITIONS OF THE INDICATORS<br />
Crude death rate – Annual number of deaths per 1,000 population.<br />
Crude birth rate – Annual number of births per 1,000 population.<br />
Life expectancy – Number of years newborn children would live if subject to the<br />
mortality risks prevailing for the cross section of population at the time of their birth.<br />
Total fertility rate – Number of children who would be born per woman if she lived<br />
to the end of her childbearing years and bore children at each age in accordance<br />
<strong>with</strong> prevailing age-specific fertility rates.<br />
Urbanized population – Percentage of population living in urban areas as defined<br />
according to the national definition used in the most recent population census.<br />
MAIN DATA SOURCES<br />
Population – United Nations Population Division. Growth rates calculated by UNICEF based on<br />
data from United Nations Population Division.<br />
Crude death and birth rates – United Nations Population Division.<br />
Life expectancy – United Nations Population Division.<br />
Total fertility rate – United Nations Population Division.<br />
NOTES<br />
− Data not available.<br />
a Based on medium-fertility variant projections.<br />
TABLE 6 dEmOGRApHIC INdICATORS<br />
STATISTICAL TABLES 123
TABLE 7: ECONOmIC INdICATORS<br />
Countries<br />
and areas<br />
US$ PPP US$ 1970–1990 1990–2011 1990–2011 2006–2011* health education military 2010 2010 2010 poorest 40% richest 20%<br />
Afghanistan 410 x 910 x, e – – – – 2 – 2 6,374 – – 23 37<br />
Albania 3,980 8,900 -0.7 x 5.3 13 1 3 – 2 338 3 9 20 43<br />
Algeria 4,470 8,370 e 1.6 1.5 12 – 5 4 3 199 0 1 – –<br />
Andorra 41,750 x – -1.4 2.5 x 3 x – 5 4 – – – – – –<br />
Angola 4,060 5,290 – 4.1 205 54 x – 3 5 239 0 4 8 x 62 x<br />
Antigua and Barbuda 12,060 15,670 e 7.8 x 0.6 4 – 4 2 – 19 2 – – –<br />
Argentina 9,740 17,250 -0.8 2.3 8 1 6 6 1 155 0 16 14 49<br />
Armenia 3,360 6,140 – 6.1 47 1 2 4 4 340 4 31 22 40<br />
Australia 46,200 x 36,910 x 1.6 2.2 3 – 6 5 2 – – – – –<br />
Austria 48,300 41,970 2.5 1.8 1 – 8 5 1 – – – 22 x 38 x<br />
Azerbaijan 5,290 9,020 – 5.9 50 0 1 3 3 156 0 1 20 42<br />
Bahamas 21,970 x 29,850 x, e 1.9 0.7 4 – 3 – – – – – – –<br />
Bahrain 15,920 x 21,240 x -1.0 x 1.3 x 3 x – 3 3 3 – – – – –<br />
Bangladesh 770 1,940 0.6 3.6 4 43 1 2 1 1,417 1 3 21 41<br />
Barbados 12,660 x 18,850 x, e 1.7 1.1 x 3 x – 4 7 – 16 – – – –<br />
Belarus 5,830 14,560 – 4.7 113 0 4 5 1 137 0 4 23 36<br />
Belgium 46,160 39,300 2.2 1.6 2 – 7 6 1 – – – 21 x 41 x<br />
Belize 3,690 6,070 e 2.9 1.8 1 – 4 6 1 25 2 11 – –<br />
Benin 780 1,630 0.5 1.3 5 47 x 2 5 1 691 10 – 18 x 46 x<br />
Bhutan<br />
Bolivia (Plurinational<br />
2,070 5,480 – 5.3 7 10 5 5 – 131 9 – 17 45<br />
State of) 2,040 4,920 -1.1 1.6 7 16 3 – 2 676 4 8 9 59<br />
Bosnia and Herzegovina 4,780 9,200 – 8.3 x 5 x 0 7 – 1 492 3 16 18 43<br />
Botswana 7,480 14,560 8.1 3.4 9 – 8 8 3 157 1 1 – –<br />
Brazil 10,720 11,500 2.3 1.6 49 6 4 6 2 664 0 19 10 59<br />
Brunei Darussalam 31,800 x 49,790 x -2.2 x -0.4 x 5 x – – 2 3 – – – – –<br />
Bulgaria 6,550 13,980 3.4 x 3.3 37 0 4 4 2 – – 14 22 37<br />
Burkina Faso 570 1,310 1.3 2.8 3 45 4 5 1 1,065 12 – 17 47<br />
Burundi 250 610 1.2 -1.4 14 81 5 7 3 632 40 1 21 43<br />
Cambodia 830 2,260 – 6.5 x 4 x 23 2 2 1 737 7 1 19 46<br />
Cameroon 1,210 2,360 3.4 0.8 4 10 2 4 2 538 2 4 17 46<br />
Canada 45,560 39,830 2.0 1.8 2 – 7 5 1 – – – 20 x 40 x<br />
Cape Verde 3,540 4,000 – 5.0 2 21 x 3 6 1 329 21 4 12 x 56 x<br />
Central African Republic 470 810 -1.3 -0.5 3 63 2 1 2 264 13 – 10 61<br />
Chad 690 1,370 -0.9 3.1 6 62 x 4 3 6 490 7 – 17 x 47 x<br />
Chile 12,280 16,160 1.5 3.4 6 1 4 5 3 198 0 15 12 58<br />
China 4,930 8,430 6.6 9.3 5 13 2 – 2 648 0 2 15 48<br />
Colombia 6,110 9,640 1.9 1.6 13 8 5 5 4 910 0 19 10 60<br />
Comoros 770 1,120 -0.1 x -0.8 4 46 x 2 8 – 68 13 – 8 x 68 x<br />
Congo 2,270 3,280 3.3 0.4 8 54 x – 6 1 1,314 15 – 13 53<br />
Cook Islands – – – – – – – – – 13 – – – –<br />
Costa Rica 7,660 11,950 e 0.7 2.6 12 3 7 6 – 96 0 7 12 56<br />
Côte d’Ivoire 1,100 1,730 -1.7 -0.6 5 24 1 5 2 848 4 – 16 48<br />
Croatia 13,850 19,330 – 2.8 24 0 7 4 2 149 0 – 20 42<br />
Cuba 5,460 x – 3.9 3.0 x 4 x – 11 14 3 129 – – – –<br />
Cyprus 29,450 x 30,910 x 5.9 x 2.0 3 – 2 8 2 – – – – –<br />
Czech Republic<br />
Democratic People’s<br />
18,520 24,190 – 2.7 5 – 6 5 1 – – – – –<br />
Republic of Korea<br />
Democratic Republic<br />
a – – – – – – – – 79 – – – –<br />
of the Congo 190 350 -2.2 -2.6 211 88 – 3 1 3,413 28 – 15 51<br />
Denmark 60,390 42,330 2.0 1.4 2 – 9 9 1 – – – – –<br />
Djibouti 1,270 x 2,450 x – -1.4 x 3 x 19 x 5 8 4 133 – 7 17 x 46 x<br />
Dominica 7,090 12,460 e 5.2 x 2.2 3 – 4 4 – 32 9 7 – –<br />
Dominican Republic 5,240 9,490 e 2.1 3.9 11 2 2 2 1 177 0 7 13 53<br />
Ecuador 4,140 8,310 1.3 1.5 5 5 3 – 4 153 0 8 13 54<br />
Egypt 2,600 6,160 4.3 2.8 7 2 2 4 2 594 0 5 22 40<br />
El Salvador 3,480 6,690 e -1.9 2.4 4 9 4 4 1 284 1 12 13 53<br />
Equatorial Guinea 14,540 24,110 – 18.2 11 – 3 – – 85 1 – – –<br />
Eritrea 430 580 e – -0.8 x 13 x – 1 – – 161 8 – – –<br />
Estonia 15,200 21,270 – 5.5 x 6 x 1 x 5 6 2 – – – 18 x 43 x<br />
Ethiopia 400 1,110 – 3.3 7 39 x 2 5 1 3,529 12 4 22 39<br />
Fiji 3,680 4,590 0.6 1.3 4 6 3 4 2 76 3 1 16 50<br />
Finland 48,420 37,990 2.9 2.5 2 – 7 7 2 – – – 24 x 37 x<br />
124<br />
GNI per capita<br />
2011<br />
GDP per capita<br />
average annual<br />
growth rate (%)<br />
Average<br />
annual rate<br />
of inflation<br />
THE STATE OF THE WORLD’S CHILDREN 2013: <strong>Children</strong> <strong>with</strong> <strong>Disabilities</strong><br />
(%)<br />
Population<br />
below<br />
international<br />
poverty line<br />
of US$1.25<br />
per day (%)<br />
Public spending as a % of GDP<br />
(2007–2010*)<br />
allocated to:<br />
ODA<br />
inflow in<br />
millions<br />
US$<br />
ODA inflow<br />
as a % of<br />
recipient<br />
GNI<br />
Debt service<br />
as a % of<br />
exports of<br />
goods and<br />
services<br />
Share of household<br />
income<br />
(%, 2005–2011*)
Countries<br />
GNI per capita<br />
2011<br />
GDP per capita<br />
average annual<br />
growth rate (%)<br />
Average<br />
annual rate<br />
of inflation<br />
(%)<br />
Population<br />
below<br />
international<br />
poverty line<br />
of US$1.25<br />
per day (%)<br />
Public spending as a % of GDP<br />
(2007–2010*)<br />
allocated to:<br />
TABLE 7 ECONOmIC INdICATORS<br />
and areas<br />
US$ PPP US$ 1970–1990 1990–2011 1990–2011 2006–2011* health education military 2010 2010 2010 poorest 40% richest 20%<br />
France 42,420 35,860 2.1 1.2 2 – 9 6 3 – – – – –<br />
Gabon 7,980 13,650 0.2 -0.7 6 5 x 1 – 1 104 1 – 16 48<br />
Gambia 610 2,060 0.6 0.9 6 34 x 3 4 – 121 16 5 13 x 53 x<br />
Georgia 2,860 5,390 3.1 2.7 67 15 3 3 6 626 5 15 16 47<br />
Germany 43,980 40,170 2.3 1.3 1 – 8 5 1 – – – 22 x 37 x<br />
Ghana 1,410 1,820 -2.0 2.5 26 29 3 5 0 1,694 6 3 15 49<br />
Greece 25,030 26,040 1.3 2.2 5 – 7 – 3 – – – 19 x 41 x<br />
Grenada 7,220 10,530 e 4.2 x 2.9 4 – 4 – – 34 6 12 – –<br />
Guatemala 2,870 4,800 e 0.2 1.3 7 14 2 3 0 398 1 10 10 60<br />
Guinea 440 1,050 – 2.9 8 43 1 2 – 214 5 5 17 46<br />
Guinea-Bissau 600 1,250 0.0 -1.2 17 49 x 2 – – 141 16 – 19 x 43 x<br />
Guyana 2,900 x 3,460 x, e -1.3 2.8 x 11 x – 7 3 – 153 6 2 – –<br />
Haiti 700 1,190 e – -1.0 x 15 x 62 x 1 – – 3,076 46 6 9 x 63 x<br />
Holy See – – – – – – – – – – – – – –<br />
Honduras 1,970 3,840 e 0.8 1.6 13 18 3 – 2 576 4 5 8 60<br />
Hungary 12,730 20,380 3.0 2.5 11 0 5 5 1 – – – 21 40<br />
Iceland 35,020 31,640 3.2 2.1 5 – 7 8 0 – – – – –<br />
India 1,410 3,620 2.0 4.9 6 33 1 – 3 2,807 0 5 21 42<br />
Indonesia 2,940 4,530 4.6 2.7 14 18 1 4 1 1,393 0 16 20 43<br />
Iran (Islamic Republic of) 4,520 x 11,400 x -2.3 2.7 x 22 x 2 x 2 5 2 122 – – 17 45<br />
Iraq 2,640 3,770 – -1.9 x 13 x 3 3 – 6 2,192 3 – 21 40<br />
Ireland 38,580 33,310 – 0.6 x 1 x – 7 6 1 – – – 20 x 42 x<br />
Israel 28,930 27,290 1.9 1.8 5 – 4 6 6 – – – 16 x 45 x<br />
Italy 35,330 32,350 2.8 0.8 3 – 7 5 2 – – – 18 x 42 x<br />
Jamaica 4,980 7,770 e -1.3 0.5 15 0 x 3 6 1 141 1 19 14 x 52 x<br />
Japan 45,180 35,510 3.4 0.7 -1 – 7 3 1 – – – – –<br />
Jordan 4,380 5,970 2.5 x 2.6 4 0 6 – 6 955 3 4 19 44<br />
Kazakhstan 8,220 11,310 – 4.1 54 0 3 4 1 222 0 70 22 38<br />
Kenya 820 1,720 1.2 0.4 9 43 x – 7 2 1,631 5 4 14 53<br />
Kiribati 2,110 3,480 e -5.3 1.1 3 – 10 – – 23 11 – – –<br />
Kuwait 48,900 x 53,820 x -6.7 x 1.4 x 6 x – 3 – 4 – – – – –<br />
Kyrgyzstan<br />
Lao People’s Democratic<br />
920 2,290 – 0.7 35 6 3 6 4 373 8 14 18 43<br />
Republic 1,130 2,600 – 4.7 21 34 1 2 0 416 6 13 19 45<br />
Latvia 12,350 17,820 3.4 4.4 17 0 4 6 1 – – 74 18 44<br />
Lebanon 9,110 14,000 – 2.5 7 – 4 2 4 449 1 14 – –<br />
Lesotho 1,220 2,070 2.4 2.3 8 43 x 5 13 2 257 10 2 10 x 56 x<br />
Liberia 240 520 -4.0 5.5 30 84 4 3 0 1,423 177 1 18 45<br />
Libya 12,320 x 16,750 x, e – – – – 2 – 1 9 – – – –<br />
Liechtenstein 137,070 x – 2.2 3.0 x 1 x – – 2 – – – – – –<br />
Lithuania 12,280 19,690 – 3.6 20 0 5 6 2 – – 32 18 44<br />
Luxembourg 78,130 63,540 2.6 2.7 3 – 5 – 1 – – – 21 x 39 x<br />
Madagascar 430 950 -2.3 -0.3 13 81 3 3 1 473 5 – 15 50<br />
Malawi 340 870 0.0 1.3 25 74 x 4 – 1 1,027 21 – 18 x 47 x<br />
Malaysia 8,420 15,190 4.0 3.1 4 0 2 6 2 2 0 5 13 51<br />
Maldives 6,530 8,540 – 5.8 x 5 x – 5 9 – 111 8 20 17 x 44 x<br />
Mali 610 1,050 0.1 2.1 5 50 3 4 2 1,093 12 – 20 41<br />
Malta 18,620 x 24,170 x 6.0 2.4 3 – 6 6 1 – – – – –<br />
Marshall Islands 3,910 – – 0.5 2 – 16 – – 91 49 – – –<br />
Mauritania 1,000 2,410 -1.1 1.3 8 23 2 4 3 373 10 – 16 47<br />
Mauritius 8,240 14,760 3.2 x 3.5 6 – 2 3 0 125 1 2 – –<br />
Mexico<br />
Micronesia<br />
9,240 15,120 1.7 1.3 12 1 3 5 1 473 0 8 13 54<br />
(Federated States of) 2,900 3,610 e – 0.4 2 31 x 13 – – 125 41 – 7 x 64 x<br />
Monaco 183,150 x – 1.4 2.1 x 1 x – 3 1 – – – – – –<br />
Mongolia 2,320 4,360 – 3.3 24 – 4 5 1 304 5 4 18 44<br />
Montenegro 7,060 13,720 – 3.4 x 7 x 0 7 – 1 77 2 – 22 39<br />
Morocco 2,970 4,910 1.9 2.5 3 3 2 5 3 994 1 9 17 48<br />
Mozambique 470 980 -1.0 x 4.3 17 60 4 – 1 1,959 21 3 15 51<br />
Myanmar a – 1.6 7.4 x 24 x – 0 – – 358 – 8 – –<br />
Namibia 4,700 6,600 -2.1 x 1.9 9 32 x 4 6 3 259 2 – 8 x 69 x<br />
Nauru – – – – – – – – – 28 – – – –<br />
Nepal 540 1,260 1.1 1.9 7 25 2 5 2 821 5 4 20 41<br />
Netherlands 49,730 43,770 1.6 1.9 2 – 8 6 2 – – – – –<br />
ODA<br />
inflow in<br />
millions<br />
US$<br />
ODA inflow<br />
as a % of<br />
recipient<br />
GNI<br />
Debt service<br />
as a % of<br />
exports of<br />
goods and<br />
services<br />
Share of household<br />
income<br />
(%, 2005–2011*)<br />
STATISTICAL TABLES 125
TABLE 7 ECONOmIC INdICATORS<br />
Countries<br />
and areas<br />
New Zealand 29,350 x 29,140 x 1.1 x 1.8 x 2 x – 8 6 1 – – – – –<br />
Nicaragua 1,170 2,840 e -3.7 1.9 17 12 x 5 – 1 628 10 11 16 47<br />
Niger 360 720 -2.0 -0.2 4 44 3 4 1 749 14 – 20 43<br />
Nigeria 1,200 2,300 -1.3 2.1 20 68 2 – 1 2,069 1 0 13 54<br />
Niue – – – – – – – – – 15 – – – –<br />
Norway 88,890 58,090 3.2 2.0 4 – 8 7 2 – – – 24 x 37 x<br />
Oman 19,260 x 25,770 x 3.1 2.7 5 – 2 4 10 -40 – – – –<br />
Pakistan 1,120 2,880 2.6 1.9 10 21 1 3 3 3,021 2 10 23 40<br />
Palau 7,250 12,330 e – -0.1 x 3 x – 9 – – 26 20 – – –<br />
Panama 7,910 14,740 e 0.3 3.4 2 7 5 4 – 129 1 5 11 56<br />
Papua New Guinea 1,480 2,590 e -1.0 0.1 8 – 2 – 0 513 6 13 – –<br />
Paraguay 2,970 5,310 3.1 0.3 10 7 3 4 1 105 1 4 11 56<br />
Peru 5,500 10,160 -0.6 3.2 10 5 3 3 1 -254 0 15 12 53<br />
Philippines 2,210 4,160 0.5 1.9 7 18 1 3 1 535 0 15 15 50<br />
Poland 12,480 20,450 – 4.4 10 0 5 6 2 – – – 20 42<br />
Portugal 21,250 24,530 2.5 1.5 4 – 8 6 2 – – – – –<br />
Qatar 80,440 87,030 – 0.8 x 11 x – 2 2 2 – – – – –<br />
Republic of Korea 20,870 30,290 6.2 4.1 4 – 4 5 3 – – – – –<br />
Republic of Moldova 1,980 3,670 1.8 x -0.1 38 0 6 10 0 468 7 9 20 41<br />
Romania 7,910 15,140 0.9 x 2.8 44 0 4 4 2 – – 29 21 38<br />
Russian Federation 10,400 20,050 – 2.3 52 0 3 4 4 – – 13 17 47<br />
Rwanda 570 1,240 1.2 2.3 9 63 5 4 1 1,034 19 2 13 57<br />
Saint Kitts and Nevis 12,480 14,490 e 6.3 x 1.6 5 – 4 4 – 11 2 17 – –<br />
Saint Lucia<br />
Saint Vincent<br />
6,680 9,080 e 5.3 x 0.7 3 – 5 4 – 41 5 6 – –<br />
and the Grenadines 6,100 10,560 e 3.3 3.2 4 – 3 5 – 17 3 14 – –<br />
Samoa 3,190 4,430 e – 2.8 6 – 5 5 – 147 27 3 – –<br />
San Marino 50,400 x – 1.7 3.2 x 3 x – 6 – – – – – – –<br />
Sao Tome and Principe 1,360 2,080 – – – 28 x 3 – – – – 5 14 x 56 x<br />
Saudi Arabia 17,820 24,870 -1.4 0.2 5 – 2 6 8 – – – – –<br />
Senegal 1,070 1,960 -0.5 1.1 4 34 x 3 6 2 931 7 – 17 46<br />
Serbia 5,680 11,640 – 1.4 23 x 0 6 5 2 651 2 24 23 37<br />
Seychelles 11,130 25,320 e 2.9 2.0 6 0 3 – 1 56 7 4 9 70<br />
Sierra Leone 340 850 -0.5 1.1 16 53 x 1 4 2 475 25 2 16 x 49 x<br />
Singapore 42,930 59,790 5.9 3.5 1 – 2 4 5 – – – – –<br />
Slovakia 16,070 22,610 – 3.7 6 0 6 5 1 – – – 24 36<br />
Slovenia 23,610 27,110 – 3.2 12 0 x 6 6 2 – – – 21 x 39 x<br />
Solomon Islands 1,110 2,360 e – -0.9 7 – 5 7 – 340 61 6 – –<br />
Somalia a – -0.8 – – – – – – 499 – – – –<br />
South Africa 6,960 10,790 0.1 1.3 8 14 3 5 1 1,032 0 5 7 68<br />
South Sudans b – – – – – – – – – – – – –<br />
Spain 30,990 31,930 1.9 1.9 4 – 7 5 1 – – – 19 x 42 x<br />
Sri Lanka 2,580 5,560 3.0 4.1 10 7 2 3 4 581 1 9 17 48<br />
State of Palestine b – – -2.4 x 4 x 0 – – – 2,519 – – 19 43<br />
Sudans US$ PPP US$ 1970–1990 1990–2011 1990–2011 2006–2011* health education military 2010 2010 2010 poorest 40% richest 20%<br />
– – – – – – – – – – – – – –<br />
Suriname 7,640 x 7,710 x, e -2.2 x 1.7 x 46 x – 4 – – 104 – – – –<br />
Swaziland 3,300 5,970 3.1 1.8 9 41 4 8 3 92 3 2 11 57<br />
Sweden 53,230 42,350 1.8 2.2 2 – 8 7 1 – – – 23 x 37 x<br />
Switzerland 76,380 50,900 1.7 x 0.9 1 – 6 5 1 – – – 20 x 41 x<br />
Syrian Arab Republic 2,750 x 5,090 x 2.2 1.8 x 7 x 2 x 1 5 4 137 0 3 19 x 44 x<br />
Tajikistan 870 2,310 – 0.2 73 7 2 5 – 430 8 18 21 39<br />
Thailand<br />
The former Yugoslav<br />
4,420 8,390 4.7 2.8 3 0 3 4 2 -11 0 5 17 47<br />
Republic of Macedonia 4,730 11,490 – 1.2 22 0 5 – 2 178 2 12 15 49<br />
Timor-Leste 2,730 x 5,210 x, e – 1.9 x 7 x 37 9 16 5 292 11 – 21 41<br />
Togo 560 1,030 -0.3 -0.1 4 39 1 3 2 421 15 – 19 42<br />
Tonga 3,580 4,690 e – 1.5 6 – 5 – – 70 19 – – –<br />
Trinidad and Tobago 15,040 24,940 e 0.5 4.8 5 – 3 – – 4 0 – – –<br />
Tunisia 4,070 9,090 2.5 3.3 4 1 x 3 6 1 551 1 9 16 48<br />
Turkey 10,410 16,730 2.0 2.4 44 0 5 – 3 1,049 0 33 17 45<br />
Turkmenistan 4,110 8,350 e – 5.8 86 – 1 – – 43 0 – – –<br />
Tuvalu 5,010 – – 2.1 3 – 10 – – 13 35 – – –<br />
Uganda 510 1,320 – 3.7 7 38 2 3 2 1,730 10 1 15 51<br />
126<br />
GNI per capita<br />
2011<br />
GDP per capita<br />
average annual<br />
growth rate (%)<br />
Average<br />
annual rate<br />
of inflation<br />
THE STATE OF THE WORLD’S CHILDREN 2013: <strong>Children</strong> <strong>with</strong> <strong>Disabilities</strong><br />
(%)<br />
Population<br />
below<br />
international<br />
poverty line<br />
of US$1.25<br />
per day (%)<br />
Public spending as a % of GDP<br />
(2007–2010*)<br />
allocated to:<br />
ODA<br />
inflow in<br />
millions<br />
US$<br />
ODA inflow<br />
as a % of<br />
recipient<br />
GNI<br />
Debt service<br />
as a % of<br />
exports of<br />
goods and<br />
services<br />
Share of household<br />
income<br />
(%, 2005–2011*)
Countries<br />
and areas<br />
GNI per capita<br />
2011<br />
GDP per capita<br />
average annual<br />
growth rate (%)<br />
Average<br />
annual rate<br />
of inflation<br />
US$ PPP US$ 1970–1990 1990–2011 1990–2011 2006–2011* health education military 2010 2010 2010 poorest 40% richest 20%<br />
Ukraine 3,120 7,080 – 0.6 67 0 4 5 3 624 0 39 24 36<br />
United Arab Emirates 40,760 48,220 e -4.3 x -1.9 5 – 2 1 6 – – – – –<br />
United Kingdom<br />
United Republic<br />
37,780 36,970 2.1 2.4 2 – 8 6 3 – – – – –<br />
of Tanzania 540 1,510 – 2.5 13 68 3 7 1 2,961 13 3 18 45<br />
United States 48,450 48,890 2.1 1.7 2 – 8 5 5 – – – 16 x 46 x<br />
Uruguay 11,860 14,740 0.9 2.1 15 0 5 – 2 49 0 12 14 51<br />
Uzbekistan 1,510 3,440 e – 2.5 78 – 2 – – 229 1 – 19 x 44 x<br />
Vanuatu<br />
Venezuela (Bolivarian<br />
2,870 4,500 e 1.2 x 0.6 3 – 3 5 – 108 15 – – –<br />
Republic of) 11,920 12,620 -1.7 0.4 32 7 3 4 1 53 0 8 14 49<br />
Viet Nam 1,260 3,260 – 6.0 10 17 3 5 2 2,945 3 2 19 43<br />
Yemen 1,070 2,180 – 1.1 15 18 x 2 5 4 666 – 2 18 45<br />
Zambia 1,160 1,490 -2.3 0.8 28 69 4 1 2 913 6 1 10 59<br />
Zimbabwe 640 – -0.4 -3.0 1 – – 2 1 738 11 – – –<br />
MEMORANDUM<br />
Sudan and South Sudan s 1,300 x 2,020 x 0.1 3.4 26 20 2 – – 2,055 4 4 18 42<br />
SUMMARY INDICATORS #<br />
Sub-Saharan Africa 1,269 2,269 0.0 2.0 29 53 3 5 1 40,604 4 3 15 50<br />
Eastern and<br />
Southern Africa 1,621 2,868 0.3 1.9 34 51 3 5 1 19,572 3 4 16 50<br />
West and Central Africa 937 1,721 -0.5 2.0 21 59 – – – 18,844 5 1 15 50<br />
Middle East and<br />
North Africa 6,234 9,655 -0.1 0.8 7 – 2 4 5 11,535 1 5 19 43<br />
South Asia 1,319 3,366 2.0 4.5 6 32 – – – 15,263 1 5 21 42<br />
East Asia and Pacific 4,853 8,185 5.6 7.5 5 14 2 ** 4 ** 2 ** 9,289 0 4 16 47<br />
Latin America<br />
and Caribbean 8,595 11,759 1.4 1.7 28 5 4 5 1 9,272 0 13 12 56<br />
CEE/CIS 7,678 14,216 – 2.5 51 0 3 4 3 6,582 0 23 19 43<br />
Least developed countries 695 1,484 -0.1 3.1 45 51 2 4 2 44,538 8 4 19 45<br />
World 9,513 11,580 2.4 2.6 8 22 6 ** 5 ** 3 ** 90,358 0 9 17 46<br />
s Due to the cession in July 2011 of the Republic of South Sudan by the Republic of the Sudan, and its subsequent admission to the United Nations on 14 July 2011, disaggregated data for the Sudan<br />
and South Sudan as separate States are not yet available for all indicators. Aggregated data presented are for the Sudan pre-cession (see Memorandum item).<br />
# For a complete list of countries and areas in the regions, subregions and country categories, see page 98.<br />
DEFINITIONS OF THE INDICATORS<br />
GNI per capita – Gross national income (GNI) is the sum of value added by all resident producers,<br />
plus any product taxes (less subsidies) not included in the valuation of output, plus net receipts of<br />
primary income (compensation of employees and property income) from abroad. GNI per capita is<br />
GNI divided by midyear population. GNI per capita in US dollars is converted using the World Bank<br />
Atlas method.<br />
GNI per capita (PPP US$) – GNI per capita converted to international dollars, taking into<br />
account differences in price levels (purchasing power) between countries. Based on data from the<br />
International Comparison Programme (ICP).<br />
GDP per capita – Gross domestic product (GDP) is the sum of value added by all resident<br />
producers; plus any product taxes (less subsidies) not included in the valuation of output. GDP per<br />
capita is GDP divided by midyear population. Growth is calculated from constant price GDP data in<br />
local currency.<br />
Population below international poverty line of US$1.25 per day – Percentage of the<br />
population living on less than US$1.25 per day at 2005 prices, adjusted for purchasing power parity<br />
(PPP). The new poverty threshold reflects revisions to PPP exchange rates based on the results of<br />
the 2005 ICP. The revisions reveal that the cost of living is higher across the developing world than<br />
previously estimated. As a result of these revisions, poverty rates for individual countries cannot<br />
be compared <strong>with</strong> poverty rates reported in previous editions. More detailed information on the<br />
definition, methodology and sources of the data presented is available at .<br />
ODA – Net official development assistance.<br />
Debt service – Sum of interest payments and repayments of principal on external public and<br />
publicly guaranteed long-term debts.<br />
Share of household income – Percentage of income received by the 20 per cent of households<br />
<strong>with</strong> the highest income and by the 40 per cent of households <strong>with</strong> the lowest income.<br />
(%)<br />
Population<br />
below<br />
international<br />
poverty line<br />
of US$1.25<br />
per day (%)<br />
Public spending as a % of GDP<br />
(2007–2010*)<br />
allocated to:<br />
TABLE 7 ECONOmIC INdICATORS<br />
ODA<br />
inflow in<br />
millions<br />
US$<br />
ODA inflow<br />
as a % of<br />
recipient<br />
GNI<br />
Debt service<br />
as a % of<br />
exports of<br />
goods and<br />
services<br />
Share of household<br />
income<br />
(%, 2005–2011*)<br />
MAIN DATA SOURCES<br />
GNI per capita – The World Bank.<br />
GDP per capita – The World Bank.<br />
Rate of inflation – The World Bank.<br />
Population below international poverty line of US$1.25 per day – The World Bank.<br />
Spending on health, education and military – The World Bank.<br />
ODA – Organisation for Economic Co-operation and Development.<br />
Debt service – The World Bank.<br />
Share of household income – The World Bank.<br />
NOTES<br />
a low-income country (GNI per capita is $1,025 or less).<br />
b lower-middle-income country (GNI per capita is $1,026 to $4,035).<br />
c upper-middle-income country (GNI per capita is $4,036 to $12,475).<br />
d high-income country (GNI per capita is $12,476 or more).<br />
– Data not available.<br />
x Data refer to years or periods other than those specified in the column heading. Such data<br />
are not included in the calculation of regional and global averages.<br />
e Estimate is based on regression; other PPP figures are extrapolated from the 2005 ICP<br />
benchmark estimates.<br />
* Data refer to the most recent year available during the period specified in the column<br />
heading.<br />
** Excludes China.<br />
STATISTICAL TABLES 127
TABLE 8: WOmEN<br />
Countries<br />
and areas<br />
Afghanistan 101 – 69 51 – 21 48 15 39 33 4 330 460 32<br />
Albania 108 97 99 98 100 69 97 67 99 97 19 21 27 2,200<br />
Algeria 104 79 x 94 102 104 61 x 89 x – 95 x 95 x – – 97 430<br />
Andorra – – 101 105 – – – – – – – – – –<br />
Angola 106 70 81 69 73 6 x 80 – 47 46 – – 450 39<br />
Antigua and Barbuda – 101 92 101 – – 100 – 100 – – 0 – –<br />
Argentina 110 100 99 112 101 78 x 99 x 89 x 95 99 – 44 77 560<br />
Armenia 109 100 102 102 – 55 99 93 100 99 13 9 30 1,700<br />
Australia 106 – 99 95 – 71 x 98 92 – 99 31 – 7 8,100<br />
Austria 107 – 99 96 103 – – – – – 24 – 4 18,200<br />
Azerbaijan 109 100 99 98 102 51 x 77 x 45 x 88 x 78 x 5 x 24 43 1,000<br />
Bahamas 109 – 102 105 96 45 x 98 – 99 – – 0 47 1,100<br />
Bahrain 102 97 – – – – 100 – 97 – – – 20 1,800<br />
Bangladesh 102 85 – 113 114 61 55 26 32 29 17 220 240 170<br />
Barbados 109 – 102 109 – – 100 – 100 – – 0 x 51 1,300<br />
Belarus 118 100 100 – – 73 x 99 x – 100 100 x 22 1 4 16,300<br />
Belgium 107 – 100 97 103 75 x – – – – 18 – 8 7,500<br />
Belize 104 – 91 – 103 34 x 94 x – 94 89 – 55 53 610<br />
Benin 107 55 87 – – 13 86 61 x 84 87 4 x 400 x 350 53<br />
Bhutan 106 59 x 102 101 105 66 97 77 65 63 12 260 x 180 210<br />
Bolivia (Plurinational<br />
State of) 107 91 99 99 – 61 86 72 71 68 19 310 190 140<br />
Bosnia and Herzegovina 107 97 102 103 99 36 x 99 x – 100 x 100 x – 3 8 11,400<br />
Botswana 96 101 96 106 104 53 94 73 95 99 – 160 160 220<br />
Brazil 110 100 – – – 81 x 98 91 97 x 98 50 75 56 910<br />
Brunei Darussalam 106 97 101 103 100 – 99 – 100 100 – – 24 1,900<br />
Bulgaria 110 99 100 95 99 – – – 100 93 31 8 11 5,900<br />
Burkina Faso 104 59 91 76 109 16 94 34 66 66 2 340 300 55<br />
Burundi 106 85 99 72 118 22 99 33 60 60 4 500 800 31<br />
Cambodia 105 80 95 90 – 51 89 59 71 54 3 210 250 150<br />
Cameroon 104 80 86 83 98 23 85 – 64 61 2 x 670 x 690 31<br />
Canada 106 – 100 98 – 74 x 100 99 100 99 26 – 12 5,200<br />
Cape Verde 111 89 92 120 – 61 x 98 x 72 x 78 x 76 11 x 54 79 480<br />
Central African Republic 107 62 71 58 90 15 68 38 54 53 5 540 x 890 26<br />
Chad 106 54 73 42 96 5 53 23 23 16 2 1,100 x 1,100 15<br />
Chile 108 100 95 103 – 58 x – – 100 100 – 20 25 2,200<br />
China 105 94 103 104 – 85 x 94 – 100 98 27 30 37 1,700<br />
Colombia 110 100 98 110 101 79 97 89 99 99 43 63 92 430<br />
Comoros 105 87 92 – – 26 x 75 x – 62 x – – 380 x 280 67<br />
Congo 105 – 95 – – 45 93 – 94 92 3 x 780 x 560 39<br />
Cook Islands – – 102 110 – 29 100 – 100 100 – 0 – –<br />
Costa Rica 106 100 99 106 103 82 90 86 99 99 21 y 23 40 1,300<br />
Côte d’Ivoire 104 72 83 – 96 18 91 – 59 57 6 x 540 x 400 53<br />
Croatia 110 99 100 107 101 – – – 100 – 19 9 17 4,100<br />
Cuba 105 100 98 99 102 74 100 100 100 100 – 41 73 1,000<br />
Cyprus 106 98 99 100 – – 99 – – 100 – – 10 6,300<br />
Czech Republic 108 – 99 101 100 – – – 100 – 20 2 5 12,100<br />
Democratic People’s<br />
Republic of Korea 110 100 – – – 69 x 100 94 100 95 13 77 81 670<br />
Democratic Republic<br />
of the Congo 107 74 87 58 88 17 89 45 80 75 7 550 540 30<br />
Denmark 106 – 100 102 100 – – – – – 21 – 12 4,500<br />
Djibouti 105 – 90 80 101 23 92 x – 93 x 87 x 12 550 x 200 140<br />
Dominica – – 98 109 105 – 100 – 100 – – 0 – –<br />
Dominican Republic 108 100 88 112 – 73 99 95 98 98 42 160 150 240<br />
Ecuador 108 97 101 103 – 73 x 84 x 58 x, y 98 x 85 x 26 x 61 110 350<br />
Egypt 105 79 96 96 – 60 74 66 79 72 28 55 66 490<br />
El Salvador 114 94 95 101 101 73 94 78 y 96 85 25 56 81 490<br />
Equatorial Guinea 105 93 97 – 108 10 x 86 x – 65 x – – – 240 88<br />
Eritrea 108 73 84 76 94 8 x 70 x 41 x 28 x 26 x 3 x – 240 86<br />
Estonia 115 100 99 102 100 – – – 100 x – – 7 x 2 25,100<br />
Ethiopia 106 59 91 82 100 29 43 19 10 10 2 680 350 67<br />
Fiji 108 – 98 109 95 32 100 – 100 – – 23 26 1,400<br />
Finland 108 – 99 105 100 – 100 x – – 100 16 – 5 12,200<br />
128<br />
Life<br />
Enrolment ratios: females Survival rate<br />
Adult literacy as a % of males 2008–2011* to last grade<br />
expectancy: rate: females<br />
of primary: Contraceptive<br />
females as a as a % of<br />
females as a prevalence<br />
% of males males Primary Secondary % of males (%)<br />
2011 2007–2011* GER<br />
GER 2008–2011* 2007–2012*<br />
Antenatal care (%)<br />
2007–2012*<br />
At least<br />
one visit<br />
At least<br />
four visits<br />
THE STATE OF THE WORLD’S CHILDREN 2013: <strong>Children</strong> <strong>with</strong> <strong>Disabilities</strong><br />
Skilled<br />
attendant<br />
at birth<br />
Delivery care (%)<br />
2007–2012* Maternal mortality ratio †<br />
2007–2011* 2010<br />
Institutional<br />
delivery C-section<br />
Reported Adjusted<br />
Lifetime risk of<br />
maternal death<br />
(1 in:)
Countries<br />
and areas<br />
Life<br />
Enrolment ratios: females Survival rate<br />
Adult literacy as a % of males 2008–2011* to last grade<br />
expectancy: rate: females<br />
of primary: Contraceptive<br />
females as a as a % of<br />
females as a prevalence<br />
% of males males Primary Secondary % of males (%)<br />
2011 2007–2011* GER<br />
GER 2008–2011* 2007–2012*<br />
Antenatal care (%)<br />
2007–2012*<br />
TABLE 8 WOmEN<br />
Delivery care (%)<br />
2007–2012* Maternal mortality ratio †<br />
2007–2011* 2010<br />
France 108 – 99 101 – 71 x 100 x – – – 21 – 8 6,200<br />
Gabon 103 92 97 – – 33 x 94 x 63 x 86 x 85 x 6 x 520 x 230 130<br />
Gambia 104 67 102 95 94 13 98 72 57 56 3 730 x 360 56<br />
Georgia 110 100 103 – 105 53 98 90 100 98 24 19 67 960<br />
Germany 106 – 100 95 101 – 100 x – – – 29 – 7 10,600<br />
Ghana 103 84 100 91 91 34 96 87 68 67 11 450 350 68<br />
Greece 106 98 – – – 76 x – – – – – – 3 25,500<br />
Grenada 104 – 100 103 – 54 x 100 – 99 – – 0 24 1,700<br />
Guatemala 111 87 96 93 – 54 93 – 52 51 16 140 120 190<br />
Guinea 106 58 84 59 76 9 x 88 50 46 39 2 980 x 610 30<br />
Guinea-Bissau 107 60 94 – – 14 93 70 44 42 – 410 x 790 25<br />
Guyana 109 – 104 111 96 43 92 79 92 89 13 86 280 150<br />
Haiti 104 84 x – – – 32 x 85 x 54 x 26 x 25 x 3 x 630 x 350 83<br />
Holy See – – – – – – – – – – – – – –<br />
Honduras 107 100 100 123 – 65 x 92 x 81 x 67 x 67 x 13 x – 100 270<br />
Hungary 111 100 99 99 100 – – – 100 – 31 19 21 3,300<br />
Iceland 104 – 100 103 – – – – – – 17 – 5 8,900<br />
India 105 68 x 100 92 – 55 74 x 37 x 52 47 9 x 210 200 170<br />
Indonesia 105 94 102 100 – 61 93 82 79 55 15 230 220 210<br />
Iran (Islamic Republic of) 105 90 101 86 100 79 x 98 x 94 x 97 x 96 x 40 x 25 x 21 2,400<br />
Iraq 110 82 – – – 50 x 84 x – 80 65 21 x 84 x 63 310<br />
Ireland 106 – 100 105 – 65 x 100 x – 100 x 100 25 – 6 8,100<br />
Israel 106 – 101 102 98 – – – – – – – 7 5,100<br />
Italy 107 99 99 99 100 – 99 x 68 x – 99 x 40 – 4 20,300<br />
Jamaica 107 112 95 103 102 72 99 87 98 97 15 95 x 110 370<br />
Japan 109 – 100 100 100 54 x – – – 100 x – – 5 13,100<br />
Jordan 104 93 100 106 – 59 99 94 99 99 19 19 63 470<br />
Kazakhstan 118 100 100 97 100 51 x 100 x – 100 100 x – 17 51 770<br />
Kenya 104 93 98 90 – 46 92 47 44 43 6 490 360 55<br />
Kiribati – – 104 111 – 22 88 71 80 66 10 0 – –<br />
Kuwait 102 97 103 107 100 – 100 – 100 – – – 14 2,900<br />
Kyrgyzstan 113 99 99 99 99 48 x 97 x – 99 97 x – 64 71 480<br />
Lao People’s<br />
Democratic Republic 104 77 x 93 83 – 38 x 35 x – 20 x 17 x 2 410 x 470 74<br />
Latvia 115 100 99 98 100 – 92 x – 100 x – – 32 34 2,000<br />
Lebanon 106 92 97 112 103 54 96 x – 98 x – – – 25 2,100<br />
Lesotho 97 115 98 138 124 47 92 70 62 59 7 1,200 620 53<br />
Liberia 104 88 91 – – 11 79 66 46 37 4 990 770 24<br />
Libya 107 86 – – – – 93 – 100 – – – 58 620<br />
Liechtenstein – – 94 103 96 – – – – – – – – –<br />
Lithuania 117 100 99 98 100 – 100 x – 100 x – – 9 8 9,400<br />
Luxembourg 107 – 101 102 – – – – 100 x 100 x 29 – 20 3,200<br />
Madagascar 105 91 98 94 105 40 86 49 44 35 2 500 240 81<br />
Malawi 100 84 104 91 103 46 95 46 71 73 5 680 460 36<br />
Malaysia 106 95 – 107 100 – 91 – 99 99 – 30 29 1,300<br />
Maldives 103 100 x 96 – – 35 99 85 95 95 32 140 x 60 870<br />
Mali 104 47 87 70 95 8 x 70 x 35 x 49 x 45 x 2 x 460 x 540 28<br />
Malta 106 103 x 101 89 91 – 100 x – – 100 – – 8 8,900<br />
Marshall Islands – – 99 103 91 45 81 77 99 85 9 140 – –<br />
Mauritania 106 79 105 85 99 9 75 16 x 61 48 3 x 690 510 44<br />
Mauritius 109 95 101 100 99 76 x – – 98 x 98 x – 22 x 60 1,000<br />
Mexico 106 97 99 107 102 73 96 86 95 80 43 52 50 790<br />
Micronesia<br />
(Federated States of) 103 – – – – 55 80 – 100 – – 0 100 290<br />
Monaco – – – – – – – – – – – – – –<br />
Mongolia 112 101 98 107 102 55 99 – 99 99 21 47 63 600<br />
Montenegro 107 98 98 101 – 39 x 97 x – 100 100 – 13 8 7,400<br />
Morocco 107 64 94 – 100 67 77 – 74 73 16 130 100 400<br />
Mozambique 104 61 90 82 94 12 92 – 55 58 2 x 500 490 43<br />
Myanmar 105 95 100 106 107 46 83 – 71 36 – 320 x 200 250<br />
Namibia 102 99 99 – 107 55 95 70 81 81 13 450 200 160<br />
Nauru – – 106 120 – 36 95 40 97 99 8 300 x – –<br />
Nepal 103 66 – – – 50 58 50 36 35 5 280 x 170 190<br />
Netherlands 105 – 99 99 – 69 – – – 100 14 – 6 10,500<br />
At least<br />
one visit<br />
At least<br />
four visits<br />
Skilled<br />
attendant<br />
at birth<br />
Institutional<br />
delivery C-section<br />
Reported Adjusted<br />
Lifetime risk of<br />
maternal death<br />
(1 in:)<br />
STATISTICAL TABLES 129
TABLE 8 WOmEN<br />
Countries<br />
and areas<br />
New Zealand 105 – 100 105 – – – – – – 23 – 15 3,300<br />
Nicaragua 109 100 x 98 110 – 72 90 78 74 74 20 63 95 350<br />
Niger 102 35 x 82 66 94 18 46 x 15 x 18 x 17 x 1 x 650 x 590 23<br />
Nigeria 103 70 91 88 107 15 58 45 39 35 2 550 630 29<br />
Niue – – – – – 23 x 100 – 100 – – 0 x – –<br />
Norway 106 – 100 98 100 88 x – – – – 16 – 7 7,900<br />
Oman 107 90 97 99 – 24 99 96 99 99 14 26 32 1,200<br />
Pakistan 103 59 82 76 92 27 61 28 43 41 7 280 260 110<br />
Palau – – – – – 22 90 81 100 100 – 0 – –<br />
Panama 107 99 97 107 100 52 96 – 89 88 – 60 92 410<br />
Papua New Guinea 107 90 89 – – 32 x 79 x 55 x 53 x 52 x – 730 x 230 110<br />
Paraguay 106 98 97 105 106 79 96 91 82 – 33 100 99 310<br />
Peru 107 89 100 98 101 75 95 94 85 85 23 93 67 570<br />
Philippines 110 101 98 108 111 51 91 78 62 44 10 160 x 99 300<br />
Poland 112 100 99 99 100 – – – 100 x – 21 2 5 14,400<br />
Portugal 108 97 97 104 – 67 x 100 x – 100 x – 31 – 8 9,200<br />
Qatar 99 99 100 121 – – 100 – 100 – – – 7 5,400<br />
Republic of Korea 109 – 99 99 100 80 – – – – 32 – 16 4,800<br />
Republic of Moldova 111 99 100 102 104 68 x 98 x 89 x 100 99 9 x 15 41 1,500<br />
Romania 110 99 99 99 100 70 x 94 x 76 x 99 98 x 19 x 21 27 2,600<br />
Russian Federation 119 100 100 98 – 80 – – 100 – – 17 34 2,000<br />
Rwanda 105 90 102 102 – 52 98 35 69 69 7 480 340 54<br />
Saint Kitts and Nevis – – 100 99 90 54 100 – 100 – – 0 – –<br />
Saint Lucia 108 – 96 99 97 – 99 – 100 – – 0 x 35 1,400<br />
Saint Vincent<br />
and the Grenadines 106 – 93 102 – 48 x 100 – 99 – – 0 x 48 940<br />
Samoa 109 100 102 114 – 29 93 58 81 81 13 29 x 100 260<br />
San Marino – – 113 102 – – – – – – – – – –<br />
Sao Tome and Principe 105 90 100 103 121 38 98 72 82 79 5 160 70 330<br />
Saudi Arabia 103 90 99 95 – 24 97 – 97 – – – 24 1,400<br />
Senegal 104 63 106 88 105 13 93 50 65 73 6 390 370 54<br />
Serbia 106 97 99 102 100 61 99 94 100 100 25 9 12 4,900<br />
Seychelles – 101 100 109 – – – – – – – 57 x – –<br />
Sierra Leone 103 59 93 – – 11 93 75 63 50 5 860 890 23<br />
Singapore 106 96 – – 100 – – – – 100 x – – 3 25,300<br />
Slovakia 111 – 99 101 100 – 97 x – 100 – 24 10 6 12,200<br />
Slovenia 109 100 99 100 100 – 100 x – 100 – – 10 12 5,900<br />
Solomon Islands 104 – – – – 35 74 65 86 85 6 150 93 240<br />
Somalia 106 – – – – 15 x 26 x 6 x 33 x 9 x – 1,000 x 1,000 16<br />
South Africa 102 96 96 105 – 60 x 97 87 91 x 89 x 21 x 400 x 300 140<br />
South Sudan s – – – – – 4 40 17 19 12 1 2,100 x – –<br />
Spain 108 98 99 102 101 66 x – – – – 26 – 6 12,000<br />
Sri Lanka 109 97 100 – – 68 99 93 99 98 24 39 x 35 1,200<br />
State of Palestine 105 94 98 108 – 50 x 99 x – 99 x 97 x 15 x – 64 330<br />
Sudan s – – – – – 9 56 47 23 21 7 94 x – –<br />
Suriname 110 99 95 123 122 46 x 90 x – 90 x 88 x – 180 130 320<br />
Swaziland 98 99 92 100 107 65 97 77 82 80 12 590 x 320 95<br />
Sweden 105 – 99 99 100 – 100 x – – – – – 4 14,100<br />
Switzerland 106 – 100 97 – – – – – – 30 – 8 9,500<br />
Syrian Arab Republic 104 86 98 100 101 54 88 64 96 78 26 65 x 70 460<br />
Tajikistan 110 100 96 87 101 37 89 49 88 88 – 45 65 430<br />
Thailand 109 96 x 99 108 – 80 99 80 100 99 24 12 x 48 1,400<br />
The former Yugoslav<br />
Republic of Macedonia 106 97 101 99 – 40 99 94 98 98 25 4 10 6,300<br />
Timor-Leste 103 83 96 101 111 22 84 55 29 22 2 560 300 55<br />
Togo 106 61 90 – 123 15 72 55 59 67 9 – 300 80<br />
Tonga 108 100 x – – – 32 98 – 98 98 – 36 110 230<br />
Trinidad and Tobago 110 99 97 107 106 43 x 96 x – 98 x 97 x – – 46 1,300<br />
Tunisia 106 82 96 106 102 60 x 96 x 68 x 95 x 89 x 21 x – 56 860<br />
Turkey 106 89 98 91 103 73 92 74 91 90 37 29 x 20 2,200<br />
Turkmenistan 114 100 – – – 48 x 99 x 83 x 100 x 98 x 3 x 12 67 590<br />
Tuvalu – – – – – 31 97 67 98 93 7 0 x – –<br />
Uganda 103 78 101 85 101 30 93 48 57 57 5 440 310 49<br />
Ukraine 118 100 101 98 101 67 99 75 99 99 10 16 32 2,200<br />
130<br />
Life<br />
Enrolment ratios: females Survival rate<br />
Adult literacy as a % of males 2008–2011* to last grade<br />
expectancy: rate: females<br />
of primary: Contraceptive<br />
females as a as a % of<br />
females as a prevalence<br />
% of males males Primary Secondary % of males (%)<br />
2011 2007–2011* GER<br />
GER 2008–2011* 2007–2012*<br />
Antenatal care (%)<br />
2007–2012*<br />
At least<br />
one visit<br />
At least<br />
four visits<br />
THE STATE OF THE WORLD’S CHILDREN 2013: <strong>Children</strong> <strong>with</strong> <strong>Disabilities</strong><br />
Skilled<br />
attendant<br />
at birth<br />
Delivery care (%)<br />
2007–2012* Maternal mortality ratio †<br />
2007–2011* 2010<br />
Institutional<br />
delivery C-section<br />
Reported Adjusted<br />
Lifetime risk of<br />
maternal death<br />
(1 in:)
Countries<br />
and areas<br />
Life<br />
Enrolment ratios: females Survival rate<br />
Adult literacy as a % of males 2008–2011* to last grade<br />
expectancy: rate: females<br />
of primary: Contraceptive<br />
females as a as a % of<br />
females as a prevalence<br />
% of males males Primary Secondary % of males (%)<br />
2011 2007–2011* GER<br />
GER 2008–2011* 2007–2012*<br />
United Arab Emirates 103 102 x – – – – 100 – 100 100 – 0 12 4,000<br />
United Kingdom 105 – 100 102 – 84 – – – – 26 – 12 4,600<br />
United Republic<br />
of Tanzania 103 85 102 – 113 34 88 43 49 50 5 450 460 38<br />
United States 107 – 99 101 89 79 – – – – 31 13 21 2,400<br />
Uruguay 110 101 97 – 104 78 x 96 90 100 – 34 34 29 1,600<br />
Uzbekistan 110 100 97 99 101 65 x 99 x – 100 x 97 x – 21 28 1,400<br />
Vanuatu 106 96 95 102 94 38 84 – 74 80 – 86 110 230<br />
Venezuela<br />
(Bolivarian Republic of) 108 100 97 110 105 – 94 x – 95 x 95 x – 63 92 410<br />
Viet Nam 105 96 94 109 – 78 94 60 93 92 20 69 59 870<br />
Yemen 105 58 82 62 – 28 x 47 x 14 x 36 x 24 x 9 x 370 x 200 90<br />
Zambia 102 77 101 – 95 41 94 60 47 48 3 590 440 37<br />
Zimbabwe 97 – – – – 59 90 65 66 65 5 960 570 52<br />
MEMORANDUM<br />
Sudan and South Sudan s 106 – – – – – – – – – – – 730 31<br />
SUMMARY INDICATORS #<br />
Sub-Saharan Africa 104 76 93 82 101 24 77 46 49 47 4 – 500 39<br />
Eastern and<br />
Southern Africa 104 82 96 89 103 34 81 44 44 43 4 – 410 52<br />
West and Central Africa 104 70 89 76 100 17 74 47 55 52 4 – 570 32<br />
Middle East and<br />
North Africa 105 82 94 92 – 48 77 – 73 62 – – 170 190<br />
South Asia 104 69 98 91 – 52 70 35 49 44 9 – 220 150<br />
East Asia and Pacific 105 94 102 104 – 64 ** 93 77 ** 92 84 23 – 82 680<br />
Latin America<br />
and Caribbean 109 98 97 108 102 – 96 89 90 89 40 – 81 520<br />
CEE/CIS 113 98 99 97 101 73 – – 97 – – – 32 1,700<br />
Least developed countries 104 76 94 84 102 35 74 38 48 44 6 – 430 52<br />
World 106 90 97 97 100 ** 55 ** 81 50 ** 66 61 16 – 210 180<br />
s Due to the cession in July 2011 of the Republic of South Sudan by the Republic of the Sudan, and its subsequent admission to the United Nations on 14 July 2011, disaggregated data for the Sudan and South Sudan as separate<br />
States are not yet available for all indicators. Aggregated data presented are for the Sudan pre-cession (see Memorandum item).<br />
# For a complete list of countries and areas in the regions, subregions and country categories, see page 98.<br />
DEFINITIONS OF THE INDICATORS<br />
Life expectancy – Number of years newborn children would live if subject to the mortality<br />
risks prevailing for the cross section of population at the time of their birth.<br />
Adult literacy rate – The number of persons aged 15 years and over who can both read<br />
and write <strong>with</strong> understanding a short, simple statement about everyday life, expressed<br />
as a percentage of the total population in that age group.<br />
Primary gross enrolment ratio (GER) – Total enrolment in primary school, regardless<br />
of age, expressed as a percentage of the official primary-school-aged population.<br />
Secondary gross enrolment ratio (GER) – Total enrolment in secondary school,<br />
regardless of age, expressed as a percentage of the official secondary-school-aged<br />
population.<br />
Survival rate to last grade of primary – Percentage of children entering the first<br />
grade of primary school who eventually reach the last grade (administrative data).<br />
Contraceptive prevalence – Percentage of women (aged 15–49) in union currently<br />
using any contraceptive method.<br />
Antenatal care – Percentage of women (aged 15–49) attended at least once during<br />
pregnancy by skilled health personnel (doctor, nurse or midwife) and the percentage<br />
attended by any provider at least four times.<br />
Skilled attendant at birth – Percentage of births attended by skilled heath personnel<br />
(doctor, nurse or midwife).<br />
Institutional delivery – Percentage of women (aged 15–49) who gave birth in a<br />
health facility.<br />
C-section – Percentage of births delivered by Caesarian section. (C-section rates<br />
between 5 and 15 per cent are expected given adequate levels of emergency<br />
obstetric care.)<br />
Maternal mortality ratio – Number of deaths of women from pregnancy-related<br />
causes per 100,000 live births during the same time period. The ‘reported’ column shows<br />
country-reported figures that are not adjusted for under-reporting or misclassification.<br />
For the ‘adjusted’ column, see note at right (†). Maternal mortality ratio values have been<br />
rounded according to the following scheme: 1,000, rounded to nearest 100.<br />
Lifetime risk of maternal death – Lifetime risk of maternal death takes into account<br />
both the probability of becoming pregnant and the probability of dying as a result of<br />
pregnancy, accumulated across a woman’s reproductive years.<br />
Antenatal care (%)<br />
2007–2012*<br />
At least<br />
one visit<br />
At least<br />
four visits<br />
Skilled<br />
attendant<br />
at birth<br />
TABLE 8 WOmEN<br />
Delivery care (%)<br />
2007–2012* Maternal mortality ratio †<br />
2007–2011* 2010<br />
Institutional<br />
delivery C-section<br />
Reported Adjusted<br />
Lifetime risk of<br />
maternal death<br />
(1 in:)<br />
MAIN DATA SOURCES<br />
Life expectancy – United Nations Population Division.<br />
Adult literacy – UNESCO Institute for Statistics (UIS).<br />
Primary and secondary school enrolment – UIS.<br />
Survival rate to last primary grade – UIS. Regional and global averages calculated by UNICEF.<br />
Contraceptive prevalence rate – Demographic and Health Surveys (DHS), Multiple Indicator Cluster Surveys (MICS) and other<br />
nationally representative sources; United Nations Population Division.<br />
Antenatal care – DHS, MICS and other nationally representative sources.<br />
Skilled attendant at birth – DHS, MICS and other nationally representative sources.<br />
Institutional delivery – DHS, MICS and other nationally representative sources.<br />
C-section – DHS, MICS and other nationally representative sources.<br />
Maternal mortality ratio (reported) – Nationally representative sources, including household surveys and vital registration.<br />
Maternal mortality ratio (adjusted) – United Nations Maternal Mortality Estimation Inter-agency Group (WHO, UNICEF, UNFPA and the<br />
World Bank).<br />
Lifetime risk of maternal death – United Nations Maternal Mortality Estimation Inter-agency Group (WHO, UNICEF, UNFPA and the<br />
World Bank).<br />
NOTES<br />
− Data not available.<br />
x Data refer to years or periods other than those specified in the column heading. Such data are not included in the calculation of regional<br />
and global averages, <strong>with</strong> the exception of 2005–2006 data from India. Estimates from data years prior to 2000 are not<br />
displayed.<br />
* Data refer to the most recent year available during the period specified in the column heading.<br />
** Excludes China.<br />
† The maternal mortality data in the column headed ‘reported’ refer to data reported by national authorities. The data in the column<br />
headed ‘adjusted’ refer to the 2010 United Nations inter-agency maternal mortality estimates that were released in May 2012. Periodically,<br />
the United Nations Maternal Mortality Estimation Inter-agency Group (WHO, UNICEF, UNFPA and the World Bank) produces<br />
internationally comparable sets of maternal mortality data that account for the well-documented problems of under-reporting and<br />
misclassification of maternal deaths, and that also include estimates for countries <strong>with</strong> no data. Please note that these values are not<br />
comparable <strong>with</strong> previously reported maternal mortality ratio ‘adjusted’ values, mainly due to an increase in the number of countries<br />
and data sources included in the latest round of estimation. Comparable time series on maternal mortality ratios for the years 1990,<br />
1995, 2000, 2005 and 2010 are available at .<br />
STATISTICAL TABLES 131
TABLE 9: CHILd pROTECTION<br />
Countries<br />
and areas<br />
Afghanistan 10 11 10 15 40 37 – – – – 90 74 75 74<br />
Albania 12 14 9 0 10 99 – – – 36 30 75 78 71<br />
Algeria 5 y 6 y 4 y 0 2 99 – – – – 68 88 89 87<br />
Andorra – – – – – – – – – – – – – –<br />
Angola 24 x 22 x 25 x – – 29 x – – – – – – – –<br />
Antigua and Barbuda – – – – – – – – – – – – – –<br />
Argentina 7 y 8 y 5 y – – 91 x, y – – – – – – – –<br />
Armenia 4 y 5 y 3 y 0 7 100 – – – 20 9 70 72 67<br />
Australia – – – – – – – – – – – – – –<br />
Austria – – – – – – – – – – – – – –<br />
Azerbaijan 7 y 8 y 5 y 1 12 94 – – – 58 49 75 79 71<br />
Bahamas – – – – – – – – – – – – – –<br />
Bahrain 5 x 6 x 3 x – – – – – – – – – – –<br />
Bangladesh 13 18 8 32 66 10 – – – 36 36 – – –<br />
Barbados – – – – – – – – – – – – – –<br />
Belarus 5 6 4 0 7 – – – – – – 84 87 80<br />
Belgium – – – – – – – – – – – – – –<br />
Belize 6 7 5 3 26 95 – – – – 9 71 71 70<br />
Benin 46 47 45 8 34 60 13 2 1 14 47 – – –<br />
Bhutan 3 3 3 6 26 100 – – – – 68 – – –<br />
Bolivia (Plurinational<br />
State of) 26 y 28 y 24 y 3 22 76 y – – – – 16 – – –<br />
Bosnia and Herzegovina 5 7 4 0 6 100 – – – – 5 38 40 36<br />
Botswana 9 y 11 y 7 y – – 72 – – – – – – – –<br />
Brazil 3 y 4 y 2 y 11 36 93 y – – – – – – – –<br />
Brunei Darussalam – – – – – – – – – – – – – –<br />
Bulgaria – – – – – – – – – – – – – –<br />
Burkina Faso 39 42 36 10 52 77 76 13 y 9 34 44 83 84 82<br />
Burundi 26 26 27 3 20 75 – – – 44 73 – – –<br />
Cambodia 37 y – – 2 18 62 – – – 22 y 46 y – – –<br />
Cameroon 31 31 30 11 36 70 1 1 7 – 56 93 93 93<br />
Canada – – – – – – – – – – – – – –<br />
Cape Verde 3 x, y 4 x, y 3 x, y 3 18 91 – – – 16 y 17 – – –<br />
Central African Republic 29 27 30 29 68 61 24 1 y 11 80 y 80 92 92 92<br />
Chad 26 25 28 29 68 16 44 18 38 – 62 84 85 84<br />
Chile 3 3 2 – – 100 y – – – – – – – –<br />
China – – – – – – – – – – – – – –<br />
Colombia 9 y 12 y 6 y 6 23 97 – – – – – – – –<br />
Comoros 27 x 26 x 28 x – – 83 x – – – – – – – –<br />
Congo 25 24 25 7 33 81 y – – – – 76 – – –<br />
Cook Islands – – – – – – – – – – – – – –<br />
Costa Rica 5 6 3 – – – – – – – – – – –<br />
Côte d’Ivoire 35 36 34 8 35 55 36 9 20 – 65 91 91 91<br />
Croatia – – – – – – – – – – – – – –<br />
Cuba – – – 9 40 100 y – – – – – – – –<br />
Cyprus – – – – – – – – – – – – – –<br />
Czech Republic – – – – – – – – – – – – – –<br />
Democratic People’s<br />
Republic of Korea – – – – – 100 – – – – – – – –<br />
Democratic Republic<br />
of the Congo 15 13 17 9 39 28 – – – – 76 92 92 91<br />
Denmark – – – – – – – – – – – – – –<br />
Djibouti 8 8 8 2 5 89 93 49 37 – – 72 73 71<br />
Dominica – – – – – – – – – – – – – –<br />
Dominican Republic 13 18 8 12 41 79 – – – – 4 67 69 65<br />
Ecuador 8 7 8 4 22 90 – – – – – – – –<br />
Egypt 7 8 5 2 17 99 91 24 y 54 – 39 y 92 y – –<br />
El Salvador 5 y 7 y 3 y 5 25 99 – – – – – – – –<br />
Equatorial Guinea 28 x 28 x 28 x – – 32 x – – – – – – – –<br />
Eritrea – – – 20 47 – 89 63 49 – 71 – – –<br />
Estonia – – – – – – – – – – – – – –<br />
Ethiopia 27 y 31 y 24 y 16 41 7 74 38 – 45 68 – – –<br />
Fiji – – – – – – – – – – – 72 y – –<br />
Finland – – – – – – – – – – – – – –<br />
France – – – – – – – – – – – – – –<br />
Gabon – – – 11 x 34 x 89 x – – – – – – – –<br />
132<br />
Child labour (%) +<br />
2002–2011*<br />
total male female<br />
Child marriage (%)<br />
2002–2011*<br />
married<br />
by 15<br />
Birth<br />
registration<br />
(%) 2005–2011*<br />
Female genital mutilation/cutting (%)<br />
2002–2011*<br />
prevalence attitudes<br />
married<br />
by 18 total women a daughters b<br />
THE STATE OF THE WORLD’S CHILDREN 2013: <strong>Children</strong> <strong>with</strong> <strong>Disabilities</strong><br />
Justification of<br />
wife beating (%)<br />
2002–2011*<br />
Violent discipline (%) +<br />
2005–2011*<br />
support for<br />
the practice c male female total male female
Countries<br />
and areas<br />
Child labour (%) +<br />
2002–2011*<br />
total male female<br />
Child marriage (%)<br />
2002–2011*<br />
married<br />
by 15<br />
Birth<br />
registration<br />
(%) 2005–2011*<br />
Female genital mutilation/cutting (%)<br />
2002–2011*<br />
prevalence attitudes<br />
married<br />
by 18 total women a daughters b<br />
TABLE 9 CHILd pROTECTION<br />
Justification of<br />
wife beating (%)<br />
2002–2011*<br />
Violent discipline (%) +<br />
2005–2011*<br />
support for<br />
the practice c male female total male female<br />
Gambia 19 21 18 7 36 53 76 42 y 64 – 75 90 90 91<br />
Georgia 18 20 17 1 14 99 – – – – 7 67 70 63<br />
Germany – – – – – – – – – – – – – –<br />
Ghana 34 34 34 5 21 63 4 0 y 2 26 y 44 94 94 94<br />
Greece – – – – – – – – – – – – – –<br />
Grenada – – – – – – – – – – – – – –<br />
Guatemala 21 y – – 7 30 97 – – – – – – – –<br />
Guinea 25 26 24 20 63 43 96 57 69 – 86 – – –<br />
Guinea-Bissau 38 40 36 7 22 24 50 39 34 – 40 y 82 82 81<br />
Guyana 16 17 16 6 23 88 – – – 19 16 76 79 74<br />
Haiti 21 22 19 6 30 81 – – – – 29 – – –<br />
Holy See – – – – – – – – – – – – – –<br />
Honduras 16 16 15 11 39 94 – – – – 16 – – –<br />
Hungary – – – – – – – – – – – – – –<br />
Iceland – – – – – – – – – – – – – –<br />
India 12 12 12 18 47 41 – – – 51 54 – – –<br />
Indonesia 7 y 8 y 6 y 4 22 53 – – – 16 y 31 y – – –<br />
Iran (Islamic Republic of) – – – – – – – – – – – – – –<br />
Iraq 11 12 9 3 17 95 – – – – 59 86 87 84<br />
Ireland – – – – – – – – – – – – – –<br />
Israel – – – – – – – – – – – – – –<br />
Italy – – – – – – – – – – – – – –<br />
Jamaica 6 7 5 1 9 98 – – – 22 y 3 y 89 90 87<br />
Japan – – – – – – – – – – – – – –<br />
Jordan 2 y 3 y 0 y 1 10 – – – – – 90 y – – –<br />
Kazakhstan 2 2 2 0 6 100 – – – 17 12 49 54 45<br />
Kenya 26 x 27 x 25 x 6 26 60 27 – 9 44 53 – – –<br />
Kiribati – – – 3 20 94 – – – 60 76 81 y – –<br />
Kuwait – – – – – – – – – – – – – –<br />
Kyrgyzstan 4 4 3 1 10 94 – – – – 38 54 y 58 y 49 y<br />
Lao People’s<br />
Democratic Republic 11 10 13 – – 72 – – – – 81 74 75 72<br />
Latvia – – – – – – – – – – – – – –<br />
Lebanon 2 3 1 1 6 100 – – – – 10 y 82 82 82<br />
Lesotho 23 x 25 x 21 x 2 19 45 – – – 48 37 – – –<br />
Liberia 21 21 21 11 38 4 y 58 – – 30 59 94 94 94<br />
Libya – – – – – – – – – – – – – –<br />
Liechtenstein – – – – – – – – – – – – – –<br />
Lithuania – – – – – – – – – – – – – –<br />
Luxembourg – – – – – – – – – – – – – –<br />
Madagascar 28 y 29 y 27 y 14 48 80 – – – 30 32 – – –<br />
Malawi 26 25 26 12 50 – – – – 13 13 – – –<br />
Malaysia – – – – – – – – – – – – – –<br />
Maldives – – – 0 4 93 – – – 14 y 31 y – – –<br />
Mali 21 22 21 15 55 81 89 75 73 – 87 – – –<br />
Malta – – – – – – – – – – – – – –<br />
Marshall Islands – – – 6 26 96 – – – 58 56 – – –<br />
Mauritania 16 18 15 15 35 56 72 66 53 – – – – –<br />
Mauritius – – – – – – – – – – – – – –<br />
Mexico 5 6 5 5 23 – – – – – – – – –<br />
Micronesia<br />
(Federated States of) – – – – – – – – – – – – – –<br />
Monaco – – – – – – – – – – – – – –<br />
Mongolia 10 10 11 0 5 99 – – – 9 y 10 46 48 43<br />
Montenegro 10 12 8 0 5 98 – – – – 11 63 64 61<br />
Morocco 8 9 8 3 16 85 x, y – – – – 64 91 92 90<br />
Mozambique 22 21 24 21 56 31 – – – – 36 – – –<br />
Myanmar – – – – – 72 – – – – – – – –<br />
Namibia – – – 2 9 67 – – – 41 35 – – –<br />
Nauru – – – 2 27 83 – – – – – – – –<br />
Nepal 34 y 30 y 38 y 10 41 42 – – – 22 23 – – –<br />
Netherlands – – – – – – – – – – – – – –<br />
New Zealand – – – – – – – – – – – – – –<br />
Nicaragua 15 x 18 x 11 x 10 41 81 y – – – – 14 – – –<br />
Niger 43 43 43 36 75 32 y 2 1 3 – 70 – – –<br />
STATISTICAL TABLES 133
TABLE 9 CHILd pROTECTION<br />
Countries<br />
and areas<br />
Nigeria 29 29 29 16 39 30 30 y 30 y 22 30 43 – – –<br />
Niue – – – – – – – – – – – – – –<br />
Norway – – – – – – – – – – – – – –<br />
Oman – – – – – – – – – – – – – –<br />
Pakistan – – – 7 24 27 – – – – – – – –<br />
Palau – – – – – – – – – – – – – –<br />
Panama 7 y 10 y 4 y – – – – – – – – – – –<br />
Papua New Guinea – – – 2 21 – – – – – – – – –<br />
Paraguay 15 17 12 – 18 – – – – – – – – –<br />
Peru 34 y 31 y 36 y 3 19 93 – – – – – – – –<br />
Philippines – – – 2 14 83 x – – – – 14 – – –<br />
Poland – – – – – – – – – – – – – –<br />
Portugal 3 x, y 4 x, y 3 x, y – – – – – – – – – – –<br />
Qatar – – – – – – – – – – – – – –<br />
Republic of Korea – – – – – – – – – – – – – –<br />
Republic of Moldova 16 20 12 1 19 98 x – – – 22 y 21 – – –<br />
Romania 1 x 1 x 1 x – – – – – – – – – – –<br />
Russian Federation – – – – – – – – – – – – – –<br />
Rwanda 29 27 30 1 8 63 – – – 25 56 – – –<br />
Saint Kitts and Nevis – – – – – – – – – – – – – –<br />
Saint Lucia – – – – – – – – – – – – – –<br />
Saint Vincent<br />
and the Grenadines – – – – – – – – – – – – – –<br />
Samoa – – – – – 48 – – – 46 61 – – –<br />
San Marino – – – – – – – – – – – – – –<br />
Sao Tome and Principe 8 8 7 5 34 75 – – – 22 20 – – –<br />
Saudi Arabia – – – – – – – – – – – – – –<br />
Senegal 17 y 18 y 16 y 12 33 75 26 13 y 17 25 60 – – –<br />
Serbia 4 5 4 1 5 99 – – – 7 y 3 67 70 64<br />
Seychelles – – – – – – – – – – – – – –<br />
Sierra Leone 26 27 25 18 44 78 88 10 y 72 – 73 82 81 82<br />
Singapore – – – – – – – – – – – – – –<br />
Slovakia – – – – – – – – – – – – – –<br />
Slovenia – – – – – – – – – – – – – –<br />
Solomon Islands – – – 3 22 – – – – 65 69 72 y – –<br />
Somalia 49 45 54 8 45 3 98 46 65 – 76 y – – –<br />
South Africa – – – 1 6 92 y – – – – – – – –<br />
South Sudan s – – – 9 52 35 – – – – 79 – – –<br />
Spain – – – – – – – – – – – – – –<br />
Sri Lanka – – – 2 12 97 – – – – 53 y – – –<br />
State of Palestine – – – 7 19 96 y – – – – – 95 – –<br />
Sudan s – – – 7 33 59 88 37 y 42 – 47 – – –<br />
Suriname 6 7 5 3 19 97 – – – – 13 86 87 85<br />
Swaziland 7 8 7 1 7 50 – – – 23 y 28 89 90 88<br />
Sweden – – – – – – – – – – – – – –<br />
Switzerland – – – – – – – – – – – – – –<br />
Syrian Arab Republic 4 5 3 3 13 95 – – – – – 89 90 88<br />
Tajikistan 10 9 11 1 13 88 – – – – 74 y 78 80 75<br />
Thailand 8 8 8 3 20 99 – – – – – – – –<br />
The former Yugoslav<br />
Republic of Macedonia 13 12 13 1 7 100 – – – – 15 69 71 67<br />
Timor-Leste 4 4 4 3 19 55 – – – 81 86 – – –<br />
Togo 28 28 29 6 25 78 4 0 y 2 – 43 93 94 93<br />
Tonga – – – – – – – – – – – – – –<br />
Trinidad and Tobago 1 1 1 2 8 96 – – – – 8 77 78 77<br />
Tunisia – – – – – – – – – – – – – –<br />
Turkey 3 y 3 y 2 y 3 14 94 – – – – 25 – – –<br />
Turkmenistan – – – 1 7 96 – – – – 38 y – – –<br />
Tuvalu – – – 0 10 50 – – – 73 70 – – –<br />
Uganda 25 y 27 y 24 y 10 40 30 1 1 y 9 44 58 – – –<br />
Ukraine 7 8 7 0 10 100 – – – 11 4 70 76 65<br />
United Arab Emirates – – – – – – – – – – – – – –<br />
United Kingdom – – – – – – – – – – – – – –<br />
United Republic<br />
of Tanzania 21 y 23 y 19 y 7 37 16 15 3 6 38 54 – – –<br />
United States – – – – – – – – – – – – – –<br />
134<br />
Child labour (%) +<br />
2002–2011*<br />
total male female<br />
Child marriage (%)<br />
2002–2011*<br />
married<br />
by 15<br />
Birth<br />
registration<br />
(%) 2005–2011*<br />
Female genital mutilation/cutting (%)<br />
2002–2011*<br />
prevalence attitudes<br />
married<br />
by 18 total women a daughters b<br />
THE STATE OF THE WORLD’S CHILDREN 2013: <strong>Children</strong> <strong>with</strong> <strong>Disabilities</strong><br />
Justification of<br />
wife beating (%)<br />
2002–2011*<br />
Violent discipline (%) +<br />
2005–2011*<br />
support for<br />
the practice c male female total male female
Countries<br />
and areas<br />
Child labour (%) +<br />
2002–2011*<br />
total male female<br />
Child marriage (%)<br />
2002–2011*<br />
married<br />
by 15<br />
Birth<br />
registration<br />
(%) 2005–2011*<br />
Uruguay 8 y 8 y 8 y – – – – – – – – – – –<br />
Uzbekistan – – – 0 7 100 – – – 59 y 70 – – –<br />
Vanuatu – – – 9 27 26 – – – – – 78 y – –<br />
Venezuela<br />
(Bolivarian Republic of) 8 x 9 x 6 x – – 92 x – – – – – – – –<br />
Viet Nam 7 7 7 1 9 95 – – – – 36 74 76 71<br />
Yemen 23 21 24 11 32 22 23 x, y 20 x, y 41 x, y – – 95 95 95<br />
Zambia 41 y 42 y 40 y 9 42 14 1 – – 49 62 – – –<br />
Zimbabwe – – – 4 31 49 – – – 34 40 – – –<br />
MEMORANDUM<br />
Sudan and South Sudan s 13 x 14 x 12 x – – – – – – – – – – –<br />
SUMMARY INDICATORS #<br />
Sub-Saharan Africa 27 28 26 12 37 41 40 24 21 35 55 – – –<br />
Eastern and<br />
Southern Africa 27 28 25 9 34 37 42 – – 40 55 – – –<br />
West and Central Africa 27 28 27 14 41 42 34 23 22 30 56 – – –<br />
Middle East and<br />
North Africa 9 10 8 3 17 81 – – – – 52 90 – –<br />
South Asia 12 13 12 18 46 37 – – – 49 52 – – –<br />
East Asia and Pacific 8 ** 8 ** 7 ** 3 ** 18 ** 70 ** – – – – 30 ** – – –<br />
Latin America<br />
and Caribbean 9 9 7 7 29 93 – – – – – – – –<br />
CEE/CIS 5 6 4 1 10 96 – – – – 27 – – –<br />
Least developed countries 23 24 22 16 46 35 – – – 36 54 – – –<br />
World 15 ** 15 ** 14 ** 11 ** 34 ** 51 ** – – – – 47 ** – – –<br />
s Due to the cession in July 2011 of the Republic of South Sudan by the Republic of the Sudan, and its subsequent admission to the United Nations on 14 July 2011, disaggregated data for the Sudan<br />
and South Sudan as separate States are not yet available for all indicators. Aggregated data presented are for the Sudan pre-cession (see Memorandum item).<br />
# For a complete list of countries and areas in the regions, subregions and country categories, see page 98.<br />
DEFINITIONS OF THE INDICATORS<br />
Child labour – Percentage of children 5–14 years old involved in child labour at the moment of the<br />
survey. A child is considered to be involved in child labour under the following conditions: children<br />
5–11 years old who, during the reference week, did at least one hour of economic activity or at least<br />
28 hours of household chores, or children 12–14 years old who, during the reference week, did at<br />
least 14 hours of economic activity or at least 28 hours of household chores.<br />
Child marriage – Percentage of women 20–24 years old who were first married or in union<br />
before they were 15 years old and percentage of women 20–24 years old who were first married<br />
or in union before they were 18 years old.<br />
Birth registration – Percentage of children less than 5 years old who were registered at the<br />
moment of the survey. The numerator of this indicator includes children whose birth certificate<br />
was seen by the interviewer or whose mother or caretaker says the birth has been registered.<br />
Female genital mutilation/cutting – (a) Women: percentage of women 15–49 years old who<br />
have been mutilated/cut; (b) daughters: percentage of women 15–49 years old <strong>with</strong> at least one<br />
mutilated/cut daughter; (c) support for the practice: percentage of women 15–49 years old<br />
who believe that the practice of female genital mutilation/cutting should continue.<br />
Justification of wife beating – Percentage of women and men 15–49 years old who consider<br />
a husband to be justified in hitting or beating his wife for at least one of the specified reasons,<br />
i.e., if his wife burns the food, argues <strong>with</strong> him, goes out <strong>with</strong>out telling him, neglects the<br />
children or refuses sexual relations.<br />
Violent discipline – Percentage of children 2–14 years old who experience any violent<br />
discipline (psychological aggression and/or physical punishment).<br />
Female genital mutilation/cutting (%)<br />
2002–2011*<br />
prevalence attitudes<br />
married<br />
by 18 total women a daughters b<br />
TABLE 9 CHILd pROTECTION<br />
Justification of<br />
wife beating (%)<br />
2002–2011*<br />
Violent discipline (%) +<br />
2005–2011*<br />
support for<br />
the practice c male female total male female<br />
MAIN DATA SOURCES<br />
Child labour – Multiple Indicator Cluster Surveys (MICS), Demographic and Health Surveys<br />
(DHS) and other national surveys.<br />
Child marriage – MICS, DHS and other national surveys.<br />
Birth registration – MICS, DHS, other national surveys and vital registration systems.<br />
Female genital mutilation/cutting – MICS, DHS and other national surveys.<br />
Justification of wife beating – MICS, DHS and other national surveys.<br />
Violent discipline – MICS, DHS and other national surveys.<br />
NOTES<br />
– Data not available.<br />
x Data refer to years or periods other than those specified in the column heading. Such data are<br />
not included in the calculation of regional and global averages.<br />
y Data differ from the standard definition or refer to only part of a country. If they fall <strong>with</strong>in<br />
the noted reference period, such data are included in the calculation of regional and global<br />
averages.<br />
+ A more detailed explanation of the methodology and the changes in calculating these<br />
estimates can be found in the General Note on the Data, page 94.<br />
* Data refer to the most recent year available during the period specified in the column heading.<br />
** Excludes China.<br />
STATISTICAL TABLES 135
TABLE 10: THE RATE OF pROGRESS<br />
Countries<br />
and areas<br />
Afghanistan 23 309 192 136 101 2.4 3.4 2.7 3.1 47 26 – – 7.7 8.0 6.2 -0.2 1.2<br />
Albania 122 – 41 26 14 – 4.5 5.5 5.0 65 46 -0.7 x 5.3 4.9 3.2 1.5 2.1 3.6<br />
Algeria 74 199 66 46 30 5.5 3.6 3.9 3.8 55 35 1.6 1.5 7.4 4.7 2.2 2.3 3.6<br />
Andorra 184 – 8 5 3 – 5.1 3.8 4.4 60 34 -1.4 2.5 x – – – – –<br />
Angola 8 – 243 199 158 – 2.0 2.1 2.1 35 21 – 4.1 7.3 7.2 5.3 0.1 1.4<br />
Antigua and Barbuda 145 – 27 15 8 – 5.9 6.1 6.0 72 49 7.8 x 0.6 – – – – –<br />
Argentina 122 58 28 20 14 3.7 3.1 3.3 3.2 49 31 -0.8 2.3 3.1 3.0 2.2 0.1 1.5<br />
Armenia 102 – 47 30 18 – 4.6 4.8 4.7 63 41 – 6.1 3.2 2.5 1.7 1.2 1.8<br />
Australia 165 21 9 6 5 4.2 3.8 2.9 3.4 51 27 1.6 2.2 2.7 1.9 2.0 1.9 -0.2<br />
Austria 169 29 9 6 4 5.6 5.2 2.6 3.8 55 25 2.5 1.8 2.3 1.5 1.4 2.4 0.3<br />
Azerbaijan 61 – 95 69 45 – 3.2 3.9 3.6 53 35 – 5.9 4.6 3.0 2.2 2.2 1.5<br />
Bahamas 107 31 22 17 16 1.8 2.6 0.4 1.4 26 4 1.9 0.7 3.5 2.6 1.9 1.5 1.6<br />
Bahrain 135 81 21 12 10 6.9 5.0 2.0 3.4 51 19 -1.0 x 1.3 x 6.5 3.7 2.5 2.8 1.9<br />
Bangladesh 60 226 139 84 46 2.4 5.0 5.5 5.3 67 45 0.6 3.6 6.9 4.5 2.2 2.1 3.4<br />
Barbados 98 47 18 17 20 4.8 0.4 -1.2 -0.5 -10 -15 1.7 1.1 x 3.1 1.7 1.6 2.9 0.5<br />
Belarus 157 – 17 14 6 – 2.3 8.1 5.3 67 59 – 4.7 2.3 1.9 1.5 1.0 1.2<br />
Belgium 169 24 10 6 4 4.3 5.4 2.7 4.0 57 26 2.2 1.6 2.2 1.6 1.8 1.7 -0.7<br />
Belize 106 – 44 26 17 – 5.1 4.0 4.5 62 36 2.9 1.8 6.3 4.5 2.7 1.7 2.4<br />
Benin 20 261 177 140 106 1.9 2.4 2.5 2.4 40 24 0.5 1.3 6.7 6.7 5.2 0.0 1.2<br />
Bhutan 51 286 138 89 54 3.6 4.4 4.6 4.5 61 40 – 5.3 6.7 5.8 2.3 0.7 4.3<br />
Bolivia (Plurinational<br />
State of) 55 226 120 81 51 3.2 3.9 4.3 4.1 58 37 -1.1 1.6 6.6 4.9 3.3 1.5 1.9<br />
Bosnia and Herzegovina 145 – 19 10 8 – 6.7 2.0 4.3 59 20 – 8.3 x 2.9 1.7 1.1 2.6 1.9<br />
Botswana 80 131 53 81 26 4.5 -4.3 10.4 3.4 51 68 8.1 3.4 6.6 4.7 2.7 1.7 2.6<br />
Brazil 107 129 58 36 16 4.0 4.9 7.5 6.3 73 56 2.3 1.6 5.0 2.8 1.8 2.9 2.1<br />
Brunei Darussalam 151 – 12 10 7 – 2.5 2.6 2.6 41 25 -2.2 x -0.4 x 5.8 3.5 2.0 2.4 2.7<br />
Bulgaria 128 39 22 21 12 2.9 0.7 4.9 2.9 45 42 3.4 x 3.3 2.2 1.7 1.5 1.1 0.6<br />
Burkina Faso 9 291 208 182 146 1.7 1.4 2.0 1.7 30 19 1.3 2.8 6.6 6.8 5.8 -0.2 0.8<br />
Burundi 10 229 183 165 139 1.1 1.0 1.5 1.3 24 15 1.2 -1.4 6.8 6.5 4.2 0.2 2.1<br />
Cambodia 62 – 117 102 43 – 1.4 7.9 4.8 64 58 – 6.5 x 5.9 5.7 2.5 0.2 3.9<br />
Cameroon 11 206 145 140 127 1.8 0.4 0.8 0.6 12 9 3.4 0.8 6.2 5.9 4.4 0.2 1.4<br />
Canada 157 22 8 6 6 4.9 2.9 0.9 1.9 33 10 2.0 1.8 2.2 1.7 1.7 1.5 -0.1<br />
Cape Verde 91 160 58 39 21 5.1 4.0 5.5 4.8 63 45 – 5.0 6.9 5.3 2.3 1.3 3.9<br />
Central African Republic 6 226 169 172 164 1.5 -0.2 0.5 0.2 3 5 -1.3 -0.5 6.0 5.8 4.5 0.1 1.1<br />
Chad 4 257 208 189 169 1.1 1.0 1.0 1.0 19 10 -0.9 3.1 6.5 6.7 5.9 -0.1 0.6<br />
Chile 141 82 19 11 9 7.4 5.5 2.0 3.6 53 19 1.5 3.4 4.0 2.6 1.8 2.1 1.7<br />
China 115 117 49 35 15 4.3 3.3 7.9 5.8 70 58 6.6 9.3 5.5 2.3 1.6 4.3 1.9<br />
Colombia 102 105 34 25 18 5.6 3.2 3.1 3.2 48 29 1.9 1.6 5.6 3.1 2.3 2.9 1.3<br />
Comoros 33 219 122 100 79 2.9 2.0 2.1 2.0 35 20 -0.1 x -0.8 7.1 5.6 4.9 1.2 0.7<br />
Congo 25 152 119 109 99 1.2 0.9 0.9 0.9 17 9 3.3 0.4 6.3 5.4 4.5 0.8 0.8<br />
Cook Islands 135 61 19 17 10 5.8 1.1 5.3 3.3 50 44 – – – – – – –<br />
Costa Rica 135 71 17 13 10 7.1 2.9 2.2 2.5 41 22 0.7 2.6 5.0 3.2 1.8 2.3 2.6<br />
Côte d’Ivoire 17 233 151 139 115 2.2 0.9 1.7 1.3 24 17 -1.7 -0.6 7.9 6.3 4.3 1.2 1.7<br />
Croatia 165 – 13 8 5 – 4.3 4.5 4.4 60 39 – 2.8 2.0 1.7 1.5 0.9 0.6<br />
Cuba 157 41 13 9 6 5.6 4.5 3.5 4.0 56 32 3.9 3.0 x 4.0 1.8 1.5 4.2 0.9<br />
Cyprus 184 – 11 7 3 – 5.3 6.7 6.0 72 52 5.9 x 2.0 2.6 2.4 1.5 0.4 2.4<br />
Czech Republic 169 – 14 7 4 – 7.6 4.9 6.2 73 42 – 2.7 2.0 1.8 1.5 0.6 1.0<br />
Democratic People’s<br />
Republic of Korea 69 – 45 58 33 – -2.5 5.0 1.4 26 42 – – 4.0 2.4 2.0 2.6 0.9<br />
Democratic Republic<br />
of the Congo 5 244 181 181 168 1.5 0.0 0.7 0.4 8 8 -2.2 -2.6 6.2 7.1 5.7 -0.7 1.1<br />
Denmark 169 16 9 6 4 3.2 4.4 3.8 4.1 57 34 2.0 1.4 2.1 1.7 1.9 1.2 -0.6<br />
Djibouti 26 – 122 106 90 – 1.4 1.5 1.5 26 15 – -1.4 x 7.4 6.2 3.7 0.9 2.5<br />
Dominica 128 54 17 15 12 5.7 1.6 2.1 1.8 32 21 5.2 x 2.2 – – – – –<br />
Dominican Republic 83 122 58 39 25 3.7 4.1 4.0 4.1 58 36 2.1 3.9 6.2 3.5 2.5 2.9 1.5<br />
Ecuador 86 138 52 34 23 4.8 4.3 3.7 4.0 56 33 1.3 1.5 6.3 3.7 2.4 2.7 1.9<br />
Egypt 91 237 86 44 21 5.1 6.6 6.8 6.7 75 52 4.3 2.8 5.9 4.4 2.7 1.6 2.3<br />
El Salvador 115 158 60 34 15 4.8 5.7 7.3 6.6 75 55 -1.9 2.4 6.2 4.0 2.2 2.3 2.8<br />
Equatorial Guinea 16 – 190 152 118 – 2.2 2.3 2.3 38 22 – 18.2 5.7 5.9 5.1 -0.2 0.7<br />
Eritrea 41 247 138 98 68 2.9 3.4 3.4 3.4 51 31 – -0.8 x 6.6 6.2 4.4 0.3 1.7<br />
Estonia 169 – 20 11 4 – 6.2 9.7 8.1 82 66 – 5.5 x 2.1 1.9 1.7 0.4 0.6<br />
Ethiopia 36 230 198 139 77 0.7 3.6 5.3 4.5 61 44 – 3.3 6.8 7.1 4.0 -0.2 2.7<br />
Fiji 107 53 30 22 16 2.9 2.8 2.8 2.8 45 26 0.6 1.3 4.5 3.4 2.6 1.5 1.2<br />
Finland 184 16 7 4 3 4.4 4.4 3.6 4.0 57 33 2.9 2.5 1.9 1.7 1.9 0.3 -0.3<br />
France 169 18 9 5 4 3.6 4.9 2.5 3.6 53 24 2.1 1.2 2.5 1.8 2.0 1.8 -0.6<br />
Gabon 44 – 94 82 66 – 1.4 2.1 1.7 31 20 0.2 -0.7 4.7 5.2 3.2 -0.5 2.3<br />
136<br />
Under-5<br />
mortality<br />
rank<br />
GDP per capita<br />
Average annual rate<br />
Under-5 mortality rate<br />
Annual rate of reduction (%)u<br />
Under-5 mortality rate<br />
Reduction<br />
since 1990<br />
Reduction<br />
since 2000<br />
average annual<br />
growth rate (%) Total fertility rate<br />
of reduction (%)<br />
Total fertility rate<br />
1970 1990 2000 2011 1970–1990 1990–2000 2000–2011 1990–2011 (%)u (%)u 1970–1990 1990–2011 1970 1990 2011 1970–1990 1990–2011<br />
THE STATE OF THE WORLD’S CHILDREN 2013: <strong>Children</strong> <strong>with</strong> <strong>Disabilities</strong>
Countries<br />
and areas<br />
Under-5<br />
mortality<br />
rank<br />
TABLE 10 THE RATE OF pROGRESS<br />
GDP per capita<br />
Average annual rate<br />
Under-5 mortality rate<br />
Annual rate of reduction (%)u<br />
Under-5 mortality rate<br />
Reduction<br />
since 1990<br />
Reduction<br />
since 2000<br />
average annual<br />
growth rate (%) Total fertility rate<br />
of reduction (%)<br />
Total fertility rate<br />
1970 1990 2000 2011 1970–1990 1990–2000 2000–2011 1990–2011 (%)u (%)u 1970–1990 1990–2011 1970 1990 2011 1970–1990 1990–2011<br />
Gambia 23 286 165 130 101 2.8 2.3 2.4 2.3 39 23 0.6 0.9 6.1 6.1 4.8 0.0 1.1<br />
Georgia 91 – 47 33 21 – 3.6 4.2 3.9 56 37 3.1 2.7 2.6 2.2 1.5 0.9 1.6<br />
Germany 169 26 9 5 4 5.6 4.5 2.7 3.6 53 26 2.3 1.3 2.0 1.4 1.4 1.9 -0.2<br />
Ghana 34 183 121 99 78 2.1 2.0 2.2 2.1 36 21 -2.0 2.5 7.0 5.6 4.1 1.1 1.5<br />
Greece 169 38 13 8 4 5.5 5.0 5.1 5.0 65 43 1.3 2.2 2.4 1.4 1.5 2.5 -0.3<br />
Grenada 125 – 21 16 13 – 2.9 1.9 2.4 39 18 4.2 x 2.9 4.6 3.8 2.2 0.9 2.6<br />
Guatemala 74 172 78 48 30 4.0 4.8 4.2 4.5 61 37 0.2 1.3 6.2 5.6 3.9 0.6 1.7<br />
Guinea 12 316 228 175 126 1.6 2.7 3.0 2.8 45 28 – 2.9 6.8 6.7 5.2 0.1 1.3<br />
Guinea-Bissau 7 242 210 186 161 0.7 1.2 1.3 1.3 24 14 0.0 -1.2 6.1 6.6 5.0 -0.5 1.4<br />
Guyana 68 78 63 49 36 1.0 2.5 2.8 2.7 43 27 -1.3 2.8 x 5.6 2.6 2.2 3.8 0.7<br />
Haiti 40 229 143 102 70 2.3 3.4 3.4 3.4 51 31 – -1.0 x 5.8 5.4 3.3 0.3 2.4<br />
Holy See – – – – – – – – – – – – – – – – – –<br />
Honduras 91 156 55 35 21 5.2 4.5 4.5 4.5 61 39 0.8 1.6 7.3 5.1 3.1 1.7 2.4<br />
Hungary 157 43 19 11 6 4.2 5.3 5.1 5.2 66 43 3.0 2.5 2.0 1.8 1.4 0.6 1.2<br />
Iceland 184 16 6 4 3 4.6 4.8 4.0 4.4 60 36 3.2 2.1 3.0 2.2 2.1 1.6 0.1<br />
India 49 189 114 88 61 2.5 2.6 3.3 3.0 46 30 2.0 4.9 5.5 3.9 2.6 1.7 2.0<br />
Indonesia 71 164 82 53 32 3.5 4.4 4.6 4.5 61 39 4.6 2.7 5.5 3.1 2.1 2.8 1.9<br />
Iran (Islamic Republic of) 83 203 61 44 25 6.0 3.3 5.1 4.3 59 43 -2.3 2.7 x 6.5 4.8 1.6 1.5 5.1<br />
Iraq 67 115 46 43 38 4.6 0.7 1.1 0.9 18 11 – -1.9 x 7.4 6.0 4.6 1.0 1.2<br />
Ireland 169 23 9 7 4 4.6 2.5 5.1 3.9 56 43 – 0.6 x 3.8 2.0 2.1 3.2 -0.3<br />
Israel 169 – 12 7 4 – 5.1 4.3 4.7 63 38 1.9 1.8 3.8 3.0 2.9 1.2 0.1<br />
Italy 169 33 10 6 4 6.1 5.5 3.8 4.6 62 34 2.8 0.8 2.5 1.3 1.4 3.2 -0.5<br />
Jamaica 102 63 35 26 18 3.0 3.0 3.0 3.0 47 28 -1.3 0.5 5.5 2.9 2.3 3.1 1.2<br />
Japan 184 18 6 5 3 5.1 3.5 2.5 3.0 47 24 3.4 0.7 2.1 1.6 1.4 1.5 0.6<br />
Jordan 91 97 37 28 21 4.8 2.7 2.7 2.7 44 26 2.5 x 2.6 7.9 5.8 3.0 1.6 3.1<br />
Kazakhstan 78 79 57 42 28 1.7 3.0 3.7 3.3 50 33 – 4.1 3.5 2.8 2.5 1.1 0.5<br />
Kenya 38 153 98 113 73 2.2 -1.5 4.0 1.4 26 36 1.2 0.4 8.1 6.0 4.7 1.5 1.2<br />
Kiribati 58 154 88 65 47 2.8 2.9 2.9 2.9 46 27 -5.3 1.1 – – – – –<br />
Kuwait 133 60 17 13 11 6.4 2.9 1.4 2.1 36 14 -6.7 x 1.4 x 7.2 2.6 2.3 5.1 0.6<br />
Kyrgyzstan 72 143 70 47 31 3.6 3.9 4.0 4.0 56 35 – 0.7 4.9 3.9 2.7 1.2 1.8<br />
Lao People’s<br />
Democratic Republic 63 – 148 81 42 – 6.0 6.0 6.0 72 48 – 4.7 6.0 6.2 2.7 -0.1 4.0<br />
Latvia 145 – 21 17 8 – 1.7 6.7 4.3 60 52 3.4 4.4 1.9 1.9 1.5 0.0 1.2<br />
Lebanon 141 57 33 19 9 2.7 5.6 6.5 6.0 72 51 – 2.5 5.1 3.1 1.8 2.4 2.7<br />
Lesotho 29 177 88 117 86 3.5 -2.9 2.8 0.1 2 27 2.4 2.3 5.8 4.9 3.1 0.8 2.1<br />
Liberia 34 280 241 164 78 0.7 3.9 6.7 5.4 68 52 -4.0 5.5 6.7 6.5 5.2 0.1 1.1<br />
Libya 107 139 44 27 16 5.7 4.9 4.7 4.8 63 40 – – 7.6 4.8 2.5 2.3 3.1<br />
Liechtenstein – – – – – – – – – – – 2.2 3.0 x – – – – –<br />
Lithuania 157 26 17 12 6 2.0 3.9 6.6 5.3 67 52 – 3.6 2.3 2.0 1.5 0.7 1.4<br />
Luxembourg 184 22 8 5 3 4.7 5.4 3.9 4.6 62 35 2.6 2.7 2.0 1.6 1.7 1.1 -0.3<br />
Madagascar 47 176 161 104 62 0.4 4.4 4.8 4.6 62 41 -2.3 -0.3 7.3 6.3 4.6 0.8 1.5<br />
Malawi 31 334 227 164 83 1.9 3.2 6.2 4.8 64 50 0.0 1.3 7.3 6.8 6.0 0.4 0.6<br />
Malaysia 151 54 17 11 7 5.8 4.8 4.4 4.6 62 39 4.0 3.1 4.9 3.5 2.6 1.6 1.4<br />
Maldives 133 266 105 53 11 4.6 6.9 14.5 10.9 90 80 – 5.8 x 7.2 6.1 1.7 0.8 6.1<br />
Mali 3 373 257 214 176 1.9 1.8 1.8 1.8 32 18 0.1 2.1 6.9 7.1 6.2 -0.1 0.6<br />
Malta 157 27 11 8 6 4.4 3.7 2.5 3.1 48 24 6.0 2.4 2.0 2.1 1.3 -0.2 2.2<br />
Marshall Islands 80 98 52 38 26 3.2 3.2 3.3 3.3 50 30 – 0.5 – – – – –<br />
Mauritania 18 197 125 118 112 2.3 0.6 0.5 0.5 10 5 -1.1 1.3 6.8 5.9 4.5 0.7 1.4<br />
Mauritius 115 85 24 19 15 6.3 2.5 1.9 2.2 37 19 3.2 x 3.5 4.0 2.3 1.6 2.7 1.7<br />
Mexico 107 108 49 29 16 4.0 5.2 5.6 5.4 68 46 1.7 1.3 6.7 3.4 2.3 3.4 1.9<br />
Micronesia<br />
(Federated States of) 63 – 56 49 42 – 1.5 1.4 1.5 26 15 – 0.4 6.9 5.0 3.4 1.7 1.8<br />
Monaco 169 – 8 5 4 – 4.2 2.4 3.3 50 24 1.4 2.1 x – – – – –<br />
Mongolia 72 – 107 63 31 – 5.2 6.6 5.9 71 52 – 3.3 7.6 4.1 2.5 3.1 2.4<br />
Montenegro 151 – 18 13 7 – 3.3 5.1 4.3 59 43 – 3.4 x 2.4 1.9 1.6 1.2 0.6<br />
Morocco 69 177 81 53 33 3.9 4.3 4.3 4.3 60 38 1.9 2.5 7.1 4.0 2.2 2.8 2.8<br />
Mozambique 22 275 226 172 103 1.0 2.7 4.7 3.7 54 40 -1.0 x 4.3 6.6 6.2 4.8 0.3 1.2<br />
Myanmar 47 172 107 84 62 2.4 2.5 2.6 2.6 42 25 1.6 7.4 x 6.1 3.4 2.0 2.8 2.6<br />
Namibia 63 113 73 74 42 2.2 -0.1 5.2 2.7 43 44 -2.1 x 1.9 6.5 5.2 3.2 1.1 2.4<br />
Nauru 66 – 40 40 40 – 0.0 0.0 0.0 0 0 – – – – – – –<br />
Nepal 57 249 135 83 48 3.1 4.8 5.0 4.9 64 42 1.1 1.9 6.1 5.2 2.7 0.8 3.2<br />
Netherlands 169 16 8 6 4 3.2 2.9 4.0 3.5 52 35 1.6 1.9 2.4 1.6 1.8 2.2 -0.6<br />
New Zealand 157 21 11 7 6 3.1 4.1 2.1 3.0 47 20 1.1 x 1.8 x 3.1 2.1 2.2 2.0 -0.2<br />
Nicaragua 80 161 66 42 26 4.5 4.5 4.6 4.5 61 39 -3.7 1.9 6.9 4.8 2.6 1.9 2.9<br />
Niger 13 324 314 216 125 0.2 3.8 5.0 4.4 60 42 -2.0 -0.2 7.4 7.8 7.0 -0.3 0.5<br />
Nigeria 14 259 214 188 124 1.0 1.3 3.8 2.6 42 34 -1.3 2.1 6.5 6.4 5.5 0.1 0.7<br />
STATISTICAL TABLES 137
TABLE 10 THE RATE OF pROGRESS<br />
Countries<br />
and areas<br />
Niue 91 – 14 29 21 – -7.3 3.0 -1.9 -49 28 – – – – – – –<br />
Norway 184 16 8 5 3 3.3 5.4 4.2 4.7 63 37 3.2 2.0 2.5 1.9 1.9 1.5 -0.2<br />
Oman 141 195 48 22 9 7.1 7.8 8.3 8.1 82 60 3.1 2.7 7.3 7.2 2.2 0.1 5.5<br />
Pakistan 39 182 122 95 72 2.0 2.5 2.5 2.5 41 24 2.6 1.9 6.6 6.0 3.3 0.5 2.8<br />
Palau 100 – 32 25 19 – 2.6 2.6 2.6 42 25 – -0.1 x – – – – –<br />
Panama 98 62 33 26 20 3.1 2.6 2.5 2.5 41 24 0.3 3.4 5.3 3.0 2.5 2.8 1.0<br />
Papua New Guinea 50 151 88 72 58 2.7 2.0 2.0 2.0 34 19 -1.0 0.1 6.2 4.8 3.9 1.2 1.0<br />
Paraguay 87 75 53 35 22 1.7 4.0 4.1 4.1 57 37 3.1 0.3 5.7 4.5 2.9 1.2 2.1<br />
Peru 102 158 75 39 18 3.7 6.6 7.0 6.8 76 53 -0.6 3.2 6.3 3.8 2.5 2.5 2.1<br />
Philippines 83 88 57 39 25 2.2 3.8 3.9 3.8 55 35 0.5 1.9 6.3 4.3 3.1 1.9 1.6<br />
Poland 157 36 17 10 6 3.6 5.9 4.6 5.2 66 40 – 4.4 2.2 2.0 1.4 0.4 1.8<br />
Portugal 184 66 15 7 3 7.5 7.1 6.8 6.9 77 53 2.5 1.5 3.0 1.5 1.3 3.3 0.7<br />
Qatar 145 57 20 13 8 5.2 4.7 4.5 4.6 62 39 – 0.8 x 6.9 4.2 2.2 2.5 3.0<br />
Republic of Korea 165 49 8 6 5 9.4 2.7 1.6 2.1 36 16 6.2 4.1 4.5 1.6 1.4 5.2 0.8<br />
Republic of Moldova 107 70 35 24 16 3.5 3.8 3.6 3.7 54 33 1.8 x -0.1 2.6 2.4 1.5 0.3 2.4<br />
Romania 125 64 37 27 13 2.7 3.3 6.9 5.2 67 53 0.9 x 2.8 2.9 1.9 1.4 2.1 1.5<br />
Russian Federation 128 40 27 21 12 2.0 2.5 5.3 4.0 56 44 – 2.3 2.0 1.9 1.5 0.3 1.0<br />
Rwanda 51 223 156 183 54 1.8 -1.6 11.1 5.1 65 70 1.2 2.3 8.1 7.0 5.3 0.7 1.3<br />
Saint Kitts and Nevis 151 71 28 16 7 4.6 5.5 7.2 6.4 74 55 6.3 x 1.6 – – – – –<br />
Saint Lucia 107 63 23 18 16 5.2 2.2 1.4 1.7 31 14 5.3 x 0.7 6.1 3.4 2.0 2.9 2.6<br />
Saint Vincent<br />
and the Grenadines 91 96 27 22 21 6.5 1.9 0.4 1.1 21 5 3.3 3.2 6.0 3.0 2.0 3.6 1.8<br />
Samoa 100 – 30 23 19 – 2.6 1.8 2.2 37 18 – 2.8 6.1 4.8 3.8 1.2 1.1<br />
San Marino 195 – 12 5 2 – 8.1 9.8 9.0 85 66 1.7 3.2 x – – – – –<br />
Sao Tome and Principe 28 96 96 93 89 -0.0 0.4 0.4 0.4 8 4 – – 6.5 5.4 3.6 0.9 1.9<br />
Saudi Arabia 141 – 43 21 9 – 7.3 7.3 7.3 78 55 -1.4 0.2 7.3 5.8 2.7 1.1 3.6<br />
Senegal 45 295 136 130 65 3.9 0.4 6.4 3.5 52 50 -0.5 1.1 7.4 6.6 4.7 0.5 1.6<br />
Serbia 151 – 29 13 7 – 8.1 5.3 6.6 75 44 – 1.4 2.4 2.1 1.6 0.6 1.4<br />
Seychelles 122 66 17 14 14 6.9 1.8 0.0 0.9 17 0 2.9 2.0 – – – – –<br />
Sierra Leone 1 342 267 241 185 1.2 1.0 2.4 1.7 31 23 -0.5 1.1 5.9 5.7 4.9 0.1 0.7<br />
Singapore 184 27 8 4 3 6.4 6.5 3.7 5.0 65 33 5.9 3.5 3.2 1.8 1.3 2.9 1.5<br />
Slovakia 145 – 18 12 8 – 4.2 3.7 3.9 56 34 – 3.7 2.5 2.0 1.3 1.0 2.0<br />
Slovenia 184 – 10 5 3 – 6.6 6.0 6.2 73 48 – 3.2 2.3 1.5 1.5 2.0 0.1<br />
Solomon Islands 87 102 42 31 22 4.5 3.2 3.1 3.1 48 29 – -0.9 6.9 5.9 4.2 0.8 1.6<br />
Somalia 2 – 180 180 180 – 0.0 0.0 0.0 0 0 -0.8 – 7.2 6.6 6.3 0.4 0.2<br />
South Africa 58 – 62 74 47 – -1.7 4.2 1.4 25 37 0.1 1.3 5.6 3.7 2.4 2.1 2.0<br />
South Sudan s 15 302 217 165 121 1.6 2.8 2.8 2.8 45 27 – – – – – – –<br />
Spain 169 29 11 7 4 4.9 5.0 4.1 4.5 61 36 1.9 1.9 2.9 1.3 1.5 3.8 -0.5<br />
Sri Lanka 128 76 29 19 12 4.8 4.1 4.1 4.1 58 36 3.0 4.1 4.3 2.5 2.3 2.8 0.4<br />
State of Palestine 87 – 43 30 22 – 3.6 2.8 3.2 49 27 – -2.4 x 7.9 6.5 4.4 0.9 1.9<br />
Sudan s 29 148 123 104 86 0.9 1.7 1.7 1.7 30 17 – – – – – – –<br />
Suriname 74 – 52 40 30 – 2.6 2.7 2.7 43 26 -2.2 x 1.7 x 5.7 2.7 2.3 3.6 0.8<br />
Swaziland 21 181 83 114 104 3.9 -3.2 0.9 -1.0 -24 9 3.1 1.8 6.9 5.7 3.3 0.9 2.7<br />
Sweden 184 13 7 4 3 3.4 4.9 3.5 4.2 58 32 1.8 2.2 2.0 2.0 1.9 0.1 0.2<br />
Switzerland 169 18 8 6 4 4.1 3.5 2.4 2.9 46 23 1.7 x 0.9 2.1 1.5 1.5 1.6 0.1<br />
Syrian Arab Republic 115 113 36 23 15 5.7 4.6 3.6 4.1 58 33 2.2 1.8 x 7.6 5.3 2.9 1.8 3.0<br />
Tajikistan 46 – 114 95 63 – 1.9 3.7 2.8 45 33 – 0.2 6.9 5.2 3.2 1.4 2.2<br />
Thailand 128 102 35 19 12 5.3 6.4 3.7 5.0 65 34 4.7 2.8 5.6 2.1 1.6 4.9 1.4<br />
The former Yugoslav<br />
Republic of Macedonia 135 – 38 16 10 – 8.4 4.8 6.5 74 41 – 1.2 3.1 2.1 1.4 1.9 1.9<br />
Timor-Leste 51 – 180 109 54 – 5.0 6.4 5.7 70 51 – 1.9 x 5.9 5.3 6.1 0.5 -0.6<br />
Togo 19 220 147 128 110 2.0 1.4 1.4 1.4 25 14 -0.3 -0.1 7.1 6.3 4.0 0.6 2.2<br />
Tonga 115 43 25 20 15 2.9 2.2 2.2 2.2 37 21 – 1.5 5.9 4.6 3.9 1.2 0.9<br />
Trinidad and Tobago 78 52 37 32 28 1.7 1.4 1.3 1.4 25 14 0.5 4.8 3.5 2.4 1.6 1.8 1.9<br />
Tunisia 107 181 51 30 16 6.3 5.5 5.5 5.5 68 45 2.5 3.3 6.6 3.6 2.0 3.0 2.9<br />
Turkey 115 194 72 35 15 5.0 7.1 7.7 7.4 79 57 2.0 2.4 5.5 3.0 2.1 3.0 1.9<br />
Turkmenistan 54 – 94 71 53 – 2.8 2.8 2.8 44 26 – 5.8 6.3 4.3 2.4 1.9 2.9<br />
Tuvalu 74 – 58 43 30 – 2.9 3.3 3.1 48 30 – 2.1 – – – – –<br />
Uganda 26 190 178 141 90 0.3 2.4 4.1 3.3 49 36 – 3.7 7.1 7.1 6.1 0.0 0.8<br />
Ukraine 135 34 19 19 10 2.8 0.4 5.6 3.1 48 46 – 0.6 2.1 1.9 1.5 0.6 1.2<br />
United Arab Emirates 151 92 22 12 7 7.1 5.9 5.7 5.8 70 46 -4.3 x -1.9 6.6 4.4 1.7 2.0 4.5<br />
United Kingdom 165 21 9 7 5 4.1 3.3 2.3 2.8 45 23 2.1 2.4 2.3 1.8 1.9 1.2 -0.1<br />
United Republic<br />
of Tanzania 41 208 158 126 68 1.4 2.2 5.7 4.0 57 47 – 2.5 6.8 6.2 5.5 0.4 0.6<br />
United States 145 23 11 9 8 3.6 2.8 1.1 2.0 34 12 2.1 1.7 2.2 1.9 2.1 0.7 -0.3<br />
138<br />
Under-5<br />
mortality<br />
rank<br />
GDP per capita<br />
Average annual rate<br />
Under-5 mortality rate<br />
Annual rate of reduction (%)u<br />
Under-5 mortality rate<br />
Reduction<br />
since 1990<br />
Reduction<br />
since 2000<br />
average annual<br />
growth rate (%) Total fertility rate<br />
of reduction (%)<br />
Total fertility rate<br />
1970 1990 2000 2011 1970–1990 1990–2000 2000–2011 1990–2011 (%)u (%)u 1970–1990 1990–2011 1970 1990 2011 1970–1990 1990–2011<br />
THE STATE OF THE WORLD’S CHILDREN 2013: <strong>Children</strong> <strong>with</strong> <strong>Disabilities</strong>
Countries<br />
and areas<br />
Under-5<br />
mortality<br />
rank<br />
GDP per capita<br />
Average annual rate<br />
Under-5 mortality rate<br />
Annual rate of reduction (%)u<br />
Under-5 mortality rate<br />
Reduction<br />
since 1990<br />
Reduction<br />
since 2000<br />
average annual<br />
growth rate (%) Total fertility rate<br />
of reduction (%)<br />
Total fertility rate<br />
1970 1990 2000 2011 1970–1990 1990–2000 2000–2011 1990–2011 (%)u (%)u 1970–1990 1990–2011 1970 1990 2011 1970–1990 1990–2011<br />
Uruguay 135 55 23 17 10 4.3 3.0 4.6 3.8 55 40 0.9 2.1 2.9 2.5 2.1 0.7 0.9<br />
Uzbekistan 56 – 75 61 49 – 2.1 2.1 2.1 35 20 – 2.5 6.5 4.2 2.3 2.2 2.8<br />
Vanuatu 125 102 39 23 13 4.9 5.2 5.0 5.1 66 43 1.2 x 0.6 6.3 4.9 3.8 1.2 1.2<br />
Venezuela<br />
(Bolivarian Republic of) 115 61 31 22 15 3.4 3.3 3.6 3.4 51 33 -1.7 0.4 5.4 3.4 2.4 2.2 1.7<br />
Viet Nam 87 – 50 34 22 – 3.9 4.1 4.0 57 36 – 6.0 7.4 3.6 1.8 3.6 3.3<br />
Yemen 36 293 126 99 77 4.2 2.4 2.4 2.4 39 23 – 1.1 7.5 8.7 5.1 -0.7 2.5<br />
Zambia 31 179 193 154 83 -0.4 2.3 5.6 4.0 57 46 -2.3 0.8 7.4 6.5 6.3 0.7 0.1<br />
Zimbabwe 43 119 79 106 67 2.0 -2.9 4.1 0.8 15 37 -0.4 -3.0 7.4 5.2 3.2 1.8 2.3<br />
MEMORANDUM<br />
Sudan and South Sudan s – – – – – – – – – – – 0.1 3.4 6.6 6.0 4.3 0.5 1.5<br />
SUMMARY INDICATORS#<br />
Sub-Saharan Africa 236 178 154 109 1.4 1.5 3.1 2.3 39 29 0.0 2.0 6.7 6.2 4.9 0.3 1.2<br />
Eastern and<br />
Southern Africa 214 162 135 84 1.4 1.8 4.3 3.1 48 38 0.3 1.9 6.8 6.0 4.5 0.6 1.4<br />
West and Central Africa 259 197 175 132 1.4 1.2 2.6 1.9 33 24 -0.5 2.0 6.6 6.5 5.3 0.1 1.0<br />
Middle East and<br />
North Africa 190 72 52 36 4.8 3.4 3.3 3.3 50 30 -0.1 0.8 6.7 5.0 2.8 1.5 2.8<br />
South Asia 195 119 89 62 2.5 2.9 3.3 3.1 48 30 2.0 4.5 5.7 4.2 2.7 1.6 2.1<br />
East Asia and Pacific 120 55 39 20 3.9 3.4 5.9 4.7 63 48 5.6 7.5 5.6 2.6 1.8 3.8 1.8<br />
Latin America<br />
and Caribbean 117 53 34 19 4.0 4.4 5.2 4.8 64 44 1.4 1.7 5.3 3.2 2.2 2.5 1.8<br />
CEE/CIS 88 48 35 21 3.1 3.2 4.6 3.9 56 40 – 2.5 2.8 2.3 1.8 0.9 1.3<br />
Least developed countries 238 171 136 98 1.7 2.3 3.0 2.7 43 28 -0.1 3.1 6.7 5.9 4.2 0.6 1.7<br />
World 141 87 73 51 2.4 1.8 3.2 2.5 41 29 2.4 2.6 4.7 3.2 2.4 1.9 1.3<br />
s Due to the cession in July 2011 of the Republic of South Sudan by the Republic of the Sudan, and its subsequent admission to the United Nations on 14 July 2011, disaggregated data for the Sudan<br />
and South Sudan as separate States are not yet available for all indicators. Aggregated data presented are for the Sudan pre-cession (see Memorandum item).<br />
# For a complete list of countries and areas in the regions, subregions and country categories, see page 98.<br />
DEFINITIONS OF THE INDICATORS<br />
Under-5 mortality rate – Probability of dying between birth and exactly 5 years of age,<br />
expressed per 1,000 live births.<br />
Reduction since 1990 – Percentage reduction in the under-five mortality rate (U5MR) from<br />
1990 to 2011. The United Nations Millennium Declaration in 2000 established a goal of a<br />
two-thirds (67 per cent) reduction in U5MR from 1990 to 2015. This indicator provides a<br />
current assessment of progress towards this goal.<br />
GDP per capita – Gross domestic product (GDP) is the sum of value added by all resident<br />
producers plus any product taxes (less subsidies) not included in the valuation of output. GDP per<br />
capita is GDP divided by midyear population. Growth is calculated from constant price GDP data<br />
in local currency.<br />
Total fertility rate – Number of children who would be born per woman if she lived to the<br />
end of her childbearing years and bore children at each age in accordance <strong>with</strong> prevailing agespecific<br />
fertility rates.<br />
TABLE 10 THE RATE OF pROGRESS<br />
MAIN DATA SOURCES<br />
Under-5 mortality rate – United Nations Inter-agency Group for Child Mortality Estimation<br />
(UNICEF, World Health Organization, United Nations Population Division and the World Bank).<br />
GDP per capita – The World Bank.<br />
Total fertility rate – United Nations Population Division.<br />
NOTES<br />
− Data not available.<br />
u A negative value indicates an increase in the under-five mortality rate.<br />
x Data refer to years or periods other than those specified in the column heading. Such data<br />
are not included in the calculation of regional and global averages.<br />
STATISTICAL TABLES 139
TABLE 11: AdOLESCENTS<br />
Countries<br />
and areas<br />
Afghanistan 8,015 25 – 20 26 90 – 84 – – 62 27 – –<br />
Albania 551 17 1 8 3 11 37 24 97 99 95 81 21 36<br />
Algeria 6,425 18 – 2 – 4 – 66 – – 133 50 – 12 x<br />
Andorra – – – – – 5 – – – – 88 84 – –<br />
Angola 4,720 24 – – – 165 x – – – – 39 22 – –<br />
Antigua and Barbuda – – – – – 67 x – – – – 122 80 55 40<br />
Argentina 6,769 17 – – – 68 – – – – 109 68 – –<br />
Armenia 435 14 1 8 2 28 21 8 94 92 96 85 4 10<br />
Australia 2,917 13 – – – 16 – – – – 113 167 – –<br />
Austria 929 11 – – – 10 – – – – 102 96 – –<br />
Azerbaijan 1,378 15 0 10 4 x 41 63 39 97 95 92 75 2 x 3 x<br />
Bahamas 58 17 – – – 41 – – – – 101 90 – –<br />
Bahrain 153 11 – – – 12 – – – – – – – –<br />
Bangladesh 31,601 21 – 46 40 133 x – 41 – 63 y 66 40 – 7<br />
Barbados 38 14 – – – 50 – – – – 99 103 – –<br />
Belarus 1,025 11 – 4 3 x 21 – – – – – – – –<br />
Belgium 1,207 11 – – – 11 – – – – 114 109 – –<br />
Belize 73 23 – 15 19 x 90 x – 11 – – – – – 39 x<br />
Benin 2,094 23 2 22 23 x 114 x 12 41 83 64 – – 31 x 17 x<br />
Bhutan 148 20 – 15 15 59 – 70 – – 78 42 – 22<br />
Bolivia (Plurinational State of) 2,232 22 4 13 20 89 x – 17 100 97 94 73 24 22<br />
Bosnia and Herzegovina 434 12 – 7 – 17 – 4 – – 99 84 – 45 x<br />
Botswana 434 21 – – – 51 – – – – 91 68 – –<br />
Brazil 33,906 17 – 25 – 71 – – – – – – – –<br />
Brunei Darussalam 65 16 – – – 18 – – – – – – – –<br />
Bulgaria 696 9 – – – 48 – – – – 83 94 – –<br />
Burkina Faso 3,978 23 2 32 28 130 40 39 61 55 28 9 31 29<br />
Burundi 1,946 23 1 9 11 65 56 74 83 69 34 13 45 43<br />
Cambodia 3,222 23 2 10 7 48 25 y 42 y 73 76 60 – 41 43<br />
Cameroon 4,481 22 – 22 33 x 127 – 58 77 61 – – – 32 x<br />
Canada 4,137 12 – – – 14 – – – – 99 102 – –<br />
Cape Verde 113 23 2 8 22 x 92 x 24 23 88 88 109 67 – –<br />
Central African Republic 1,030 23 11 55 45 133 x 87 y 79 – – – – 26 x 16 x<br />
Chad 2,690 23 – 48 47 193 x – 59 55 24 29 18 – 10<br />
Chile 2,769 16 – – – 54 – – – – 100 82 – –<br />
China 195,432 15 – – – 6 – – – – 92 71 – –<br />
Colombia 8,759 19 – 14 20 85 – – – – 105 80 – 21<br />
Comoros 161 21 – – – 95 x – – – – – – – –<br />
Congo 909 22 2 19 29 x 132 x – 76 75 63 – – 18 8<br />
Cook Islands – – – – – 47 x – – – – 97 67 – –<br />
Costa Rica 832 18 3 11 9 67 – – – – 116 75 – –<br />
Côte d’Ivoire 4,653 23 2 20 29 x 111 – 63 86 75 – – – –<br />
Croatia 490 11 – – – 13 – – – – 105 87 – –<br />
Cuba 1,454 13 – 20 9 51 – – – – 94 85 – 54<br />
Cyprus 153 14 – – – 4 – – – – 102 96 – –<br />
Czech Republic 1,069 10 – – – 11 – – – – 93 88 – –<br />
Democratic People’s<br />
Republic of Korea 4,103 17 – – – 1 – – – – – – – 7<br />
Democratic Republic<br />
of the Congo 16,323 24 – 25 25 135 – 72 55 43 48 32 – 13<br />
Denmark 701 13 – – – 6 – – – – 116 119 – –<br />
Djibouti 202 22 – 4 – 27 x – – – – 44 25 – 16 x<br />
Dominica – – – – – 48 – – – – 108 84 – –<br />
Dominican Republic 1,967 20 – 17 25 98 x – 7 98 98 90 70 33 39<br />
Ecuador 2,843 19 – 16 – 100 x – – – – 85 65 – –<br />
Egypt 15,964 19 – 13 7 50 x – 50 y – 97 y 94 51 16 3<br />
El Salvador 1,440 23 – 21 – 65 – – – – 86 44 – –<br />
Equatorial Guinea 154 21 – – – 128 x – – – – – – – –<br />
Eritrea 1,171 22 – 29 25 x – – 70 – 85 44 22 – –<br />
Estonia 133 10 – – – 21 – – – – 105 103 – –<br />
Ethiopia 20,948 25 2 19 22 79 51 64 42 38 45 16 32 24<br />
Fiji 159 18 – – – 31 x – – – – 100 69 – –<br />
Finland 627 12 – – – 8 – – – – 99 115 – –<br />
France 7,482 12 – – – 12 – – – – 110 117 – –<br />
140<br />
Population aged 10–19<br />
Total<br />
(thousands)<br />
2011<br />
Proportion of<br />
total population<br />
(%)<br />
Adolescents currently<br />
married/in union (%)<br />
2002–2011*<br />
Births by<br />
age 18 (%)<br />
Adolescent<br />
birth rate<br />
Justification of wife<br />
beating among<br />
adolescents (%)<br />
2002–2011*<br />
Use of mass<br />
media among<br />
adolescents (%)<br />
2002–2011*<br />
Lower Upper<br />
secondary secondary<br />
school gross school gross<br />
enrolment enrolment<br />
ratio ratio<br />
Comprehensive<br />
knowledge of<br />
HIV among<br />
adolescents (%)<br />
2007–2011*<br />
2011 male female 2007–2011* 2006–2010* male female male female 2008–2011* 2008–2011* male female<br />
THE STATE OF THE WORLD’S CHILDREN 2013: <strong>Children</strong> <strong>with</strong> <strong>Disabilities</strong>
Countries<br />
and areas<br />
Population aged 10–19<br />
Total<br />
(thousands)<br />
2011<br />
TABLE 11 AdOLESCENTS<br />
Proportion of<br />
total population<br />
(%)<br />
Adolescents currently<br />
married/in union (%)<br />
2002–2011*<br />
Births by<br />
age 18 (%)<br />
Adolescent<br />
birth rate<br />
Justification of wife<br />
beating among<br />
adolescents (%)<br />
2002–2011*<br />
Use of mass<br />
media among<br />
adolescents (%)<br />
2002–2011*<br />
Lower Upper<br />
secondary secondary<br />
school gross school gross<br />
enrolment enrolment<br />
ratio ratio<br />
Comprehensive<br />
knowledge of<br />
HIV among<br />
adolescents (%)<br />
2007–2011*<br />
2011 male female 2007–2011* 2006–2010* male female male female 2008–2011* 2008–2011* male female<br />
Gabon 346 23 2 x 18 x 35 x – – – 89 x 83 x – – – –<br />
Gambia 421 24 – 24 23 104 x – 74 – – 63 45 – 33<br />
Georgia 541 13 – 11 6 44 – 5 – – 93 81 – –<br />
Germany 8,059 10 – – – 9 – – – – 101 107 – –<br />
Ghana 5,412 22 1 7 16 70 37 53 90 85 83 39 30 28<br />
Greece 1,087 10 – – – 12 – – – – – – – –<br />
Grenada 20 20 – – – 53 x – – – – 121 89 – –<br />
Guatemala 3,467 23 – 20 22 92 – – – – 65 48 24 20<br />
Guinea 2,334 23 3 36 44 x 153 x – 79 66 55 46 26 – –<br />
Guinea–Bissau 349 23 – 19 31 x 137 – 39 y – – – – – 12<br />
Guyana 181 24 1 16 16 97 25 18 94 94 99 78 45 53<br />
Haiti 2,270 22 2 17 15 x 69 x – 29 88 83 – – 34 x 31 x<br />
Holy See – – – – – – – – – – – – – –<br />
Honduras 1,777 23 – 20 26 x 108 x – 18 – 98 75 71 – 28 x<br />
Hungary 1,072 11 – – – 19 – – – – 99 98 – –<br />
Iceland 45 14 – – – 15 – – – – 97 115 – –<br />
India 243,492 20 5 30 22 x 39 57 53 88 72 81 50 35 x 19 x<br />
Indonesia 42,771 18 – 14 10 52 x – 41 y – 79 y 92 63 2 y 6<br />
Iran (Islamic Republic of) 12,015 16 – 16 – 31 – – – – 98 87 – –<br />
Iraq 7,490 23 – 19 – 68 – 57 – – – – – 3 x<br />
Ireland 567 13 – – – 16 – – – – 110 138 – –<br />
Israel 1,206 16 – – – 14 – – – – 94 110 – –<br />
Italy 5,742 9 – – – 7 – – – – 107 97 – –<br />
Jamaica 562 21 – 5 16 72 28 y 4 y – – 91 95 52 y 61 y<br />
Japan 11,799 9 – – – 5 – – – – 103 102 – –<br />
Jordan 1,418 23 – 7 4 32 – 91 y – 97 y 94 73 – 12<br />
Kazakhstan 2,402 15 1 5 3 x 31 14 9 99 99 105 80 – 22 x<br />
Kenya 9,322 22 0 12 26 106 54 57 91 81 91 44 52 42<br />
Kiribati – – 5 16 9 39 x 65 77 58 57 99 72 46 41<br />
Kuwait 394 14 – – – 14 – – – – 110 89 – –<br />
Kyrgyzstan 1,082 20 – 8 2 x 31 – 28 – – 94 62 – 19 x<br />
Lao People’s<br />
Democratic Republic 1,509 24 – – 55 x 110 x – 79 – – 55 32 – –<br />
Latvia 216 10 – – – 15 – – – – 95 96 – –<br />
Lebanon 772 18 – 3 – 18 x – 22 y – – 90 73 – –<br />
Lesotho 531 24 1 16 13 92 54 48 64 69 58 29 28 35<br />
Liberia 921 22 3 19 38 177 37 48 73 63 – – 21 18<br />
Libya 1,117 17 – – – 4 x – – – – – – – –<br />
Liechtenstein – – – – – 4 – – – – 103 23 – –<br />
Lithuania 391 12 – – – 17 – – – – 96 105 – –<br />
Luxembourg 63 12 – – – 7 – – – – 110 88 – –<br />
Madagascar 5,060 24 11 34 36 147 33 35 61 60 42 15 26 23<br />
Malawi 3,673 24 2 23 35 157 21 16 82 65 40 15 45 40<br />
Malaysia 5,537 19 5 6 – 14 – – – – 91 50 – –<br />
Maldives 66 21 – 5 1 19 – 41 y – 100 – – – 22 y<br />
Mali 3,723 24 – 40 46 x 190 x – 83 81 79 48 26 – 14<br />
Malta 50 12 – – – 20 – – – – 103 97 – –<br />
Marshall Islands – – 5 21 21 105 71 47 86 85 110 92 35 27<br />
Mauritania 791 22 – 25 19 88 x – – 55 x 44 x 26 22 10 4<br />
Mauritius 211 16 – – – 31 – – – – 96 85 – –<br />
Mexico 21,658 19 – 15 39 87 – – – – 117 61 – –<br />
Micronesia<br />
(Federated States of) 27 24 – – – 52 x – – – – – – – –<br />
Monaco – – – – – – – – – – – – – –<br />
Mongolia 500 18 1 5 2 20 9 14 – – 89 90 24 28<br />
Montenegro 83 13 – 2 – 24 – 6 – – 114 94 – –<br />
Morocco 6,094 19 – 11 8 x 18 x – 64 – 90 – – – –<br />
Mozambique 5,577 23 5 43 42 x 193 – 37 95 88 34 11 31 37<br />
Myanmar 8,665 18 – 7 – 17 x – – – – 62 38 – 31<br />
Namibia 530 23 0 5 17 74 x 44 38 86 88 – – 59 62<br />
Nauru – – 9 18 22 84 x – – 89 86 – – 8 8<br />
Nepal 7,043 23 7 29 19 81 27 24 86 76 – – 33 25<br />
Netherlands 2,019 12 – – – 5 – – – – 127 116 – –<br />
New Zealand 612 14 – – – 29 – – – – 104 137 – –<br />
STATISTICAL TABLES 141
TABLE 11 AdOLESCENTS<br />
Countries<br />
and areas<br />
Nicaragua 1,319 22 – 24 28 x 109 x – 19 – 95 x 80 54 – –<br />
Niger 3,776 24 3 59 51 x 199 x – 68 66 48 19 4 14 x 12 x<br />
Nigeria 36,205 22 1 29 28 123 35 40 82 64 47 41 28 20<br />
Niue – – – – – 16 – – – – – – – –<br />
Norway 646 13 – – – 10 – – – – 98 124 – –<br />
Oman 462 16 – – – 12 – – – – 108 93 – –<br />
Pakistan 39,894 23 – 16 10 16 – – – – 44 26 – 2<br />
Palau – – – – – 27 x – – – – – – – –<br />
Panama 646 18 – – – 88 – – – – 93 54 – –<br />
Papua New Guinea 1,561 22 3 15 14 x 70 x – – – – – – – –<br />
Paraguay 1,385 21 – 11 – 63 – – – – 78 56 – –<br />
Peru 5,769 20 – 11 13 72 – – – 91 101 77 – 17<br />
Philippines 20,508 22 – 10 7 53 – 15 – 94 88 76 – 19<br />
Poland 4,300 11 – – – 16 – – – – 97 97 – –<br />
Portugal 1,100 10 – – – 16 – – – – 116 98 – –<br />
Qatar 151 8 – – – 15 – – – – 101 86 – –<br />
Republic of Korea 6,458 13 – – – 2 – – – – 100 94 – –<br />
Republic of Moldova 459 13 1 10 5 x 26 25 24 99 98 89 86 – –<br />
Romania 2,252 11 – – – 41 – – – – 96 98 – –<br />
Russian Federation 14,023 10 – – – 30 – – – – 90 86 – –<br />
Rwanda 2,356 22 0 3 5 41 35 56 88 73 43 20 44 49<br />
Saint Kitts and Nevis – – – – – 67 x – – – – 100 93 – –<br />
Saint Lucia 32 18 – – – 49 x – – – – 98 93 – –<br />
Saint Vincent<br />
and the Grenadines 21 19 – – – 70 – – – – 119 91 – –<br />
Samoa 44 24 1 7 5 29 50 58 97 97 105 76 5 2<br />
San Marino – – – – – 1 x – – – – 99 96 – –<br />
Sao Tome and Principe 40 24 1 20 25 110 25 23 96 95 71 19 39 39<br />
Saudi Arabia 4,926 18 – – – 7 – – – – 106 95 – –<br />
Senegal 3,004 24 1 24 22 93 31 61 86 81 – – 28 26<br />
Serbia 1,207 12 1 5 3 22 6 2 99 100 99 85 43 53<br />
Seychelles – – – – – 62 – – – – 131 104 – –<br />
Sierra Leone 1,366 23 – 23 38 98 x – 63 66 51 – – 26 16<br />
Singapore 747 14 – – – 6 – – – – – – – –<br />
Slovakia 635 12 – – – 21 – – – – 91 88 – –<br />
Slovenia 193 9 – – – 5 – – – – 96 98 – –<br />
Solomon Islands 121 22 0 13 15 70 x 73 72 71 54 – – 26 29<br />
Somalia 2,140 22 – 25 – 123 x – 75 y – – – – – 3 x<br />
South Africa 9,940 20 2 4 15 x 54 – – – – 96 92 – –<br />
South Sudan s – – – 40 28 – – 72 – – – – – 8<br />
Spain 4,299 9 – – – 13 – – – – 120 133 – –<br />
Sri Lanka 3,165 15 – 9 4 24 – 54 y – 88 y – – – –<br />
State of Palestine 1,040 25 1 13 – 60 – – – – 88 78 – –<br />
Sudan s – – – 24 14 – – 52 – – – – – 4<br />
Suriname 96 18 – 11 – 66 – 19 – – 89 56 – 41 x<br />
Swaziland 301 25 0 4 22 111 x 34 42 94 89 67 45 52 56<br />
Sweden 1,097 12 – – – 6 – – – – 97 101 – –<br />
Switzerland 867 11 – – – 4 – – – – 108 86 – –<br />
Syrian Arab Republic 4,786 23 – 10 9 x 75 x – – – – 92 37 – 6 x<br />
Tajikistan 1,670 24 – 6 4 x 27 x – 85 y – – 98 61 9 11<br />
Thailand 10,192 15 – 15 8 x 47 – – – – 91 64 – 46 x<br />
The former Yugoslav<br />
Republic of Macedonia 280 14 – 4 2 20 – 14 – – 90 78 – 23 x<br />
Timor-Leste 301 26 0 8 9 54 72 81 61 62 63 49 15 11<br />
Togo 1,416 23 0 12 17 – – 41 – – – – – 33<br />
Tonga 23 22 – – – 16 – – – – – – – –<br />
Trinidad and Tobago 189 14 – 6 – 33 – 10 – – 92 87 – 49 x<br />
Tunisia 1,709 16 – – – 6 – – – – 116 73 – –<br />
Turkey 13,004 18 – 10 8 x 38 – 30 – – 96 64 – –<br />
Turkmenistan 1,013 20 – 5 2 x 21 – 37 y – 96 x – – – 4 x<br />
Tuvalu – – 2 8 3 28 x 83 69 89 95 – – 57 31<br />
Uganda 8,326 24 2 20 33 159 x 52 62 88 82 35 13 36 36<br />
Ukraine 4,638 10 3 6 3 30 8 3 99 99 104 78 33 39<br />
United Arab Emirates 898 12 – – – 34 – – – – – – – –<br />
142<br />
Proportion of<br />
total population<br />
(%)<br />
Adolescents currently<br />
married/in union (%)<br />
2002–2011*<br />
Births by<br />
age 18 (%)<br />
Adolescent<br />
birth rate<br />
Justification of wife<br />
beating among<br />
adolescents (%)<br />
2002–2011*<br />
Use of mass<br />
media among<br />
adolescents (%)<br />
2002–2011*<br />
Lower Upper<br />
secondary secondary<br />
school gross school gross<br />
enrolment enrolment<br />
ratio ratio<br />
Comprehensive<br />
knowledge of<br />
HIV among<br />
adolescents (%)<br />
2007–2011*<br />
2011 male female 2007–2011* 2006–2010* male female male female 2008–2011* 2008–2011* male female<br />
Population aged 10–19<br />
Total<br />
(thousands)<br />
2011<br />
THE STATE OF THE WORLD’S CHILDREN 2013: <strong>Children</strong> <strong>with</strong> <strong>Disabilities</strong>
Countries<br />
and areas<br />
Population aged 10–19<br />
Total<br />
(thousands)<br />
2011<br />
United Kingdom 7,442 12 – – – 25 – – – – 109 96 – –<br />
United Republic of Tanzania 10,475 23 4 18 28 128 39 52 79 70 – – 41 46<br />
United States 41,478 13 – – – 39 – – – – 103 90 – –<br />
Uruguay 524 15 – – – 60 – – – – 113 68 – –<br />
Uzbekistan 5,798 21 – 5 2 x 26 63 63 – – 96 124 – 27 x<br />
Vanuatu 54 22 – 13 – – – – – – 65 41 – 14<br />
Venezuela<br />
(Bolivarian Republic of) 5,499 19 – 16 x – 101 – – – – 90 71 – –<br />
Viet Nam 15,251 17 – 8 3 35 – 35 97 94 88 65 – 51<br />
Yemen 6,073 25 – 19 – 80 x – – – – 54 34 – 2 x, y<br />
Zambia 3,176 24 1 18 34 151 x 55 61 80 71 – – 38 36<br />
Zimbabwe 3,196 25 1 23 21 115 48 48 59 53 – – 42 46<br />
MEMORANDUM<br />
Sudan and South Sudan s 10,044 23 – – – 70 – – – – – – – –<br />
SUMMARY INDICATORS #<br />
Sub–Saharan Africa 200,971 23 2 23 26 109 42 55 73 62 47 30 34 26<br />
Eastern and Southern Africa 94,195 22 3 19 26 102 46 55 71 64 49 30 38 35<br />
West and Central Africa 96,530 23 1 28 27 121 35 55 75 60 46 31 28 19<br />
Middle East and North Africa 82,134 20 – 14 – 37 – 57 – – 89 57 – –<br />
South Asia 333,425 20 5 29 22 38 56 52 88 71 75 45 34 15<br />
East Asia and Pacific 317,250 16 – 11 ** 8 ** 14 – 34 ** – 85 ** 89 68 – 20 **<br />
Latin America and Caribbean 108,552 18 – 18 – 77 – – – – 102 75 – –<br />
CEE/CIS 53,462 13 – 7 – 31 – 31 – – 95 80 – –<br />
Least developed countries 193,984 23 – 27 28 106 – 55 68 61 50 26 – 22<br />
World 1,199,890 17 – 22 ** 20 ** 43 – 49 ** – 73 ** 82 59 – 19 **<br />
s Due to the cession in July 2011 of the Republic of South Sudan by the Republic of the Sudan, and its subsequent admission to the United Nations on 14 July 2011, disaggregated data for the Sudan<br />
and South Sudan as separate States are not yet available for all indicators. Aggregated data presented are for the Sudan pre-cession (see Memorandum item).<br />
# For a complete list of countries and areas in the regions, subregions and country categories, see page 98.<br />
DEFINITIONS OF THE INDICATORS<br />
Adolescents currently married/in union – Percentage of boys and girls aged 15–19 who are<br />
currently married or in union. This indicator is meant to provide a snapshot of the current marital<br />
status of boys and girls in this age group. However, it is worth noting that those not married at the<br />
time of the survey are still exposed to the risk of marrying before they exit adolescence.<br />
Births by age 18 – Percentage of women aged 20–24 who gave birth before age 18. This<br />
standardized indicator from population-based surveys captures levels of fertility among adolescents<br />
up to the age of 18. Note that the data are based on the answers from women aged 20–24, whose<br />
risk of giving birth before the age of 18 is behind them.<br />
Adolescent birth rate – Number of births per 1,000 adolescent girls aged 15–19.<br />
Justification of wife beating among adolescents – The percentage of boys and girls aged<br />
15–19 who consider a husband to be justified in hitting or beating his wife for at least one of the<br />
specified reasons: if his wife burns the food, argues <strong>with</strong> him, goes out <strong>with</strong>out telling him, neglects<br />
the children or refuses sexual relations.<br />
Use of mass media among adolescents – The percentage of boys and girls aged 15–19 who<br />
use at least one of the following types of information media, at least once a week: newspaper,<br />
magazine, television or radio.<br />
Lower secondary school gross enrolment ratio – Number of children enrolled in lower<br />
secondary school, regardless of age, expressed as a percentage of the total number of children of<br />
official lower secondary school age.<br />
Upper secondary school gross enrolment ratio – Number of children enrolled in upper<br />
secondary school, regardless of age, expressed as a percentage of the total number of children of<br />
official upper secondary school age.<br />
Comprehensive knowledge of HIV among adolescents – Percentage of young men and<br />
women aged 15–19 who correctly identify the two major ways of preventing the sexual transmission<br />
of HIV (using condoms and limiting sex to one faithful, uninfected partner), who reject the two most<br />
common local misconceptions about HIV transmission and who know that a healthy-looking person<br />
can be HIV-positive.<br />
TABLE 11 AdOLESCENTS<br />
Proportion of<br />
total population<br />
(%)<br />
Adolescents currently<br />
married/in union (%)<br />
2002–2011*<br />
Births by<br />
age 18 (%)<br />
Adolescent<br />
birth rate<br />
Justification of wife<br />
beating among<br />
adolescents (%)<br />
2002–2011*<br />
Use of mass<br />
media among<br />
adolescents (%)<br />
2002–2011*<br />
Lower Upper<br />
secondary secondary<br />
school gross school gross<br />
enrolment enrolment<br />
ratio ratio<br />
Comprehensive<br />
knowledge of<br />
HIV among<br />
adolescents (%)<br />
2007–2011*<br />
2011 male female 2007–2011* 2006–2010* male female male female 2008–2011* 2008–2011* male female<br />
MAIN DATA SOURCES<br />
Adolescent population – United Nations Population Division.<br />
Adolescents currently married/in union – Demographic and Health Surveys (DHS),<br />
Multiple Indicator Cluster Surveys (MICS) and other national surveys.<br />
Births by age 18 – DHS and MICS.<br />
Adolescent birth rate – United Nations Population Division.<br />
Justification of wife beating among adolescents – DHS, MICS and other national<br />
surveys.<br />
Use of mass media among adolescents – AIDS Indicator Surveys (AIS), DHS, MICS and<br />
other national surveys.<br />
Gross enrolment ratio – UNESCO Institute for Statistics (UIS).<br />
Comprehensive knowledge of HIV among adolescents – AIDS Indicator Surveys (AIS),<br />
DHS, MICS, Reproductive Health Surveys (RHS) and other national household surveys; HIV/<br />
AIDS Survey Indicators Database, .<br />
NOTES<br />
– Data not available.<br />
x Data refer to years or periods other than those specified in the column heading. Such data<br />
are not included in the calculation of regional and global averages, <strong>with</strong> the exception of<br />
2005–2006 data from India. Estimates from data years prior to 2000 are not displayed.<br />
y Data differ from the standard definition or refer to only part of a country. If they fall <strong>with</strong>in<br />
the noted reference period, such data are included in the calculation of regional and<br />
global averages.<br />
* Data refer to the most recent year available during the period specified in the column<br />
heading.<br />
** Excludes China.<br />
STATISTICAL TABLES 143
TABLE 12: dISpARITIES By RESIdENCE<br />
Countries<br />
and areas<br />
Afghanistan 60 33 1.8 74 31 2.4 – – – 48 54 0.9 73 x 47 x 1.6 x – – – 60 30 2.0<br />
Albania 99 98 1.0 100 99 1.0 5 6 1.2 33 x 36 x 0.9 x 90 91 1.0 51 26 2.0 95 93 1.0<br />
Algeria 99 99 1.0 98 x 92 x 1.1 x 3 x 4 x 1.4 x 18 x 19 x 1.0 x 98 x 95 x 1.0 x 16 x 10 x 1.7 x 98 88 1.1<br />
Andorra – – – – – – – – – – – – – – – – – – 100 100 1.0<br />
Angola 34 x 19 x 1.7 x 71 26 2.8 – – – – – – 85 67 1.3 – – – 85 19 4.5<br />
Antigua and Barbuda – – – – – – – – – – – – – – – – – – 98 – –<br />
Argentina – – – – – – – – – – – – – – – – – – – – –<br />
Armenia 99 100 1.0 100 99 1.0 3 7 2.6 22 x 28 x 0.8 x – – – 16 16 1.0 95 80 1.2<br />
Australia – – – – – – – – – – – – – – – – – – 100 100 1.0<br />
Austria – – – – – – – – – – – – – – – – – – 100 100 1.0<br />
Azerbaijan 96 92 1.0 97 x 80 x 1.2 x 4 x 12 x 3.1 x 19 x 5 x 3.6 x 74 x 72 x 1.0 x 7 x 2 x 3.3 x 86 78 1.1<br />
Bahamas – – – – – – – – – – – – – – – – – – 100 100 1.0<br />
Bahrain – – – – – – – – – – – – – – – – – – 100 – –<br />
Bangladesh 13 9 1.5 54 25 2.1 28 39 1.4 84 76 1.1 86 y 86 y 1.0 y – – – 57 55 1.0<br />
Barbados – – – – – – – – – – – – – – – – – – 100 100 1.0<br />
Belarus – – – 100 x 100 x 1.0 x 1 x 2 x 1.7 x 38 x 33 x 1.1 x 92 x 95 x 1.0 x – – – 91 97 0.9<br />
Belgium – – – – – – – – – – – – – – – – – – 100 100 1.0<br />
Belize 95 96 1.0 99 x 93 x 1.1 x 2 x 6 x 2.9 x – – – 97 x 94 x 1.0 x 49 x 29 x 1.7 x 93 87 1.1<br />
Benin 68 56 1.2 92 79 1.2 15 x 21 x 1.4 x 58 47 1.2 74 x 55 x 1.3 x 22 x 11 x 1.9 x 25 5 5.0<br />
Bhutan 100 100 1.0 90 54 1.6 11 14 1.3 64 60 1.1 96 90 1.1 32 15 2.1 73 29 2.5<br />
Bolivia (Plurinational<br />
State of) 79 y 72 y 1.1 y 88 51 1.7 3 6 2.3 38 32 1.2 98 96 1.0 32 9 3.5 35 10 3.5<br />
Bosnia and Herzegovina 99 100 1.0 100 x 100 x 1.0 x 2 x 1 x 0.7 x 34 x 35 x 1.0 x 98 x 98 x 1.0 x 46 x 42 x 1.1 x 99 92 1.1<br />
Botswana 78 67 1.2 99 90 1.1 – – – 47 x 51 x 0.9 x 89 85 1.0 – – – 75 41 1.8<br />
Brazil – – – 98 x 94 x 1.0 x 2 x 2 x 0.8 x – – – – – – – – – 85 44 1.9<br />
Brunei Darussalam – – – – – – – – – – – – – – – – – – – – –<br />
Bulgaria – – – – – – – – – – – – – – – – – – 100 100 1.0<br />
Burkina Faso 93 74 1.3 93 61 1.5 – – – 31 19 1.6 79 x 38 x 2.1 x 46 24 1.9 50 6 8.3<br />
Burundi 87 74 1.2 88 58 1.5 18 30 1.7 33 38 0.9 87 73 1.2 59 43 1.4 49 46 1.1<br />
Cambodia 74 60 1.2 95 67 1.4 19 30 1.6 33 34 1.0 85 y 85 y 1.0 y 55 41 1.3 73 20 3.7<br />
Cameroon 86 58 1.5 87 47 1.9 7 20 2.8 27 12 2.2 90 x 71 x 1.3 x 42 x 18 x 2.4 x 58 36 1.6<br />
Canada – – – – – – – – – – – – – – – – – – 100 99 1.0<br />
Cape Verde – – – 91 x 64 x 1.4 x – – – – – – – – – – – – 73 43 1.7<br />
Central African Republic 78 52 1.5 83 38 2.2 23 24 1.0 23 12 2.0 66 x 42 x 1.6 x 21 x 13 x 1.6 x 43 28 1.5<br />
Chad 42 9 4.9 60 12 5.1 22 33 1.5 27 10 2.8 – – – 18 7 2.6 30 6 5.0<br />
Chile – – – 100 x 99 x 1.0 x – – – – – – – – – – – – 98 83 1.2<br />
China – – – 100 99 1.0 1 4 3.3 – – – – – – – – – 74 56 1.3<br />
Colombia 97 95 1.0 98 86 1.1 3 5 1.6 57 49 1.2 91 91 1.0 30 21 1.4 82 63 1.3<br />
Comoros 87 x 83 x 1.1 x 79 x 57 x 1.4 x – – – 25 x 17 x 1.5 x 41 x 29 x 1.4 x – – – 50 30 1.7<br />
Congo 88 y 75 y 1.2 y 98 86 1.1 8 x 15 x 2.0 x 38 27 1.4 – – – 9 6 1.5 20 15 1.3<br />
Cook Islands – – – – – – – – – – – – – – – – – – 100 100 1.0<br />
Costa Rica – – – 100 99 1.0 – – – – – – 96 96 1.0 – – – 95 96 1.0<br />
Côte d’Ivoire 79 41 2.0 84 45 1.9 9 x,y 20 x,y 2.2 x,y 22 14 1.5 67 x 48 x 1.4 x – – – 36 11 3.3<br />
Croatia – – – – – – – – – – – – – – – – – – 99 98 1.0<br />
Cuba 100 y 100 y 1.0 y – – – – – – 54 37 1.4 – – – 55 49 1.1 94 81 1.2<br />
Cyprus – – – – – – – – – – – – – – – – – – 100 100 1.0<br />
Czech Republic – – – – – – – – – – – – – – – – – – 99 97 1.0<br />
Democratic People’s<br />
Republic of Korea 100 100 1.0 100 100 1.0 13 27 2.0 75 73 1.0 100 99 1.0 11 4 2.8 86 71 1.2<br />
Democratic Republic<br />
of the Congo 24 29 0.8 96 75 1.3 17 27 1.6 26 27 1.0 86 70 1.2 21 12 1.7 24 24 1.0<br />
Denmark – – – – – – – – – – – – – – – – – – 100 100 1.0<br />
Djibouti 90 82 1.1 95 x 40 x 2.3 x 18 y 27 y 1.5 y – – – 67 x 49 x 1.4 x 18 x 9 x 2.0 x 63 10 6.3<br />
Dominica – – – – – – – – – – – – – – – – – – – – –<br />
Dominican Republic 83 73 1.1 98 97 1.0 3 4 1.2 42 39 1.1 95 95 1.0 42 37 1.2 87 75 1.2<br />
Ecuador 89 92 1.0 98 x 99 x 1.0 x – – – – – – – – – – – – 96 84 1.1<br />
Egypt 99 99 1.0 90 72 1.2 6 6 1.0 28 29 1.0 91 87 1.0 7 3 2.3 97 93 1.0<br />
El Salvador 99 99 1.0 97 94 1.0 4 y 7 y 2.0 y 60 56 1.1 – – – – – – 89 83 1.1<br />
Equatorial Guinea 43 x 24 x 1.8 x 87 x 49 x 1.8 x – – – 43 x 19 x 2.2 x – – – – – – – – –<br />
Eritrea – – – 65 x 10 x 6.2 x 23 x 40 x 1.7 x 59 x 39 x 1.5 x – – – – – – – 4 –<br />
Estonia – – – – – – – – – – – – – – – – – – 96 94 1.0<br />
Ethiopia 29 5 5.9 51 4 12.7 16 30 1.9 45 24 1.9 86 61 1.4 38 19 2.0 29 19 1.5<br />
Fiji – – – – – – – – – – – – – – – – – – 94 71 1.3<br />
Finland – – – – – – – – – – – – – – – – – – 100 100 1.0<br />
144<br />
Birth registration (%)<br />
2005–2011*<br />
urban rural<br />
Skilled attendant at<br />
birth (%)<br />
2007–2012*<br />
ratio of<br />
urban to<br />
rural urban rural<br />
Underweight prevalence<br />
in children under 5 (%)<br />
2007–2011*<br />
ratio of<br />
urban to<br />
rural urban rural<br />
Diarrhoea treatment<br />
<strong>with</strong> oral rehydration<br />
salts (ORS) (%)<br />
2007−2012*<br />
ratio of<br />
rural to<br />
urban urban rural<br />
THE STATE OF THE WORLD’S CHILDREN 2013: <strong>Children</strong> <strong>with</strong> <strong>Disabilities</strong><br />
Primary school net<br />
attendance ratio<br />
2007−2011*<br />
ratio of<br />
urban to<br />
rural urban rural<br />
Comprehensive<br />
knowledge of HIV (%)<br />
Females 15−24<br />
2007−2011*<br />
ratio of<br />
urban to<br />
rural urban rural<br />
Use of improved<br />
sanitation facilities (%)<br />
2010<br />
ratio of<br />
urban to<br />
rural urban rural<br />
ratio of<br />
urban to<br />
rural
Countries<br />
and areas<br />
Birth registration (%)<br />
2005–2011*<br />
urban rural<br />
Skilled attendant at<br />
birth (%)<br />
2007–2012*<br />
ratio of<br />
urban to<br />
rural urban rural<br />
Underweight prevalence<br />
in children under 5 (%)<br />
2007–2011*<br />
ratio of<br />
urban to<br />
rural urban rural<br />
Diarrhoea treatment<br />
<strong>with</strong> oral rehydration<br />
salts (ORS) (%)<br />
2007−2012*<br />
ratio of<br />
rural to<br />
urban urban rural<br />
TABLE 12 dispAriTiEs By rEsidEncE<br />
Primary school net<br />
attendance ratio<br />
2007−2011*<br />
ratio of<br />
urban to<br />
rural urban rural<br />
Comprehensive<br />
knowledge of HIV (%)<br />
Females 15−24<br />
2007−2011*<br />
ratio of<br />
urban to<br />
rural urban rural<br />
Use of improved<br />
sanitation facilities (%)<br />
2010<br />
ratio of<br />
urban to<br />
rural urban rural<br />
France – – – – – – – – – – – – – – – – – – 100 100 1.0<br />
Gabon 90 x 87 x 1.0 x 92 x 67 x 1.4 x – – – 23 x 29 x 0.8 x – – – – – – 33 30 1.1<br />
Gambia 54 52 1.0 77 41 1.9 12 22 1.9 39 39 1.0 53 35 1.5 41 24 1.7 70 65 1.1<br />
Georgia 99 98 1.0 99 x 98 x 1.0 x 1 1 1.6 44 x 36 x 1.2 x 97 95 1.0 – – – 96 93 1.0<br />
Germany – – – – – – – – – – – – – – – – – – 100 100 1.0<br />
Ghana 72 55 1.3 88 54 1.6 11 16 1.5 37 34 1.1 80 68 1.2 34 22 1.5 19 8 2.4<br />
Greece – – – – – – – – – – – – – – – – – – 99 97 1.0<br />
Grenada – – – – – – – – – – – – – – – – – – 96 97 1.0<br />
Guatemala 96 97 1.0 77 37 2.1 8 y 16 y 1.9 y 38 37 1.0 – – – 32 14 2.2 87 70 1.2<br />
Guinea 78 33 2.4 84 31 2.7 15 23 1.5 52 x 28 x 1.9 x – – – – – – 32 11 2.9<br />
Guinea-Bissau 30 21 1.4 69 x 27 x 2.6 x 13 21 1.6 28 13 2.1 84 57 1.5 22 8 2.8 44 9 4.9<br />
Guyana 91 87 1.0 98 90 1.1 7 12 1.7 42 x 38 x 1.1 x 96 94 1.0 72 47 1.5 88 82 1.1<br />
Haiti 87 78 1.1 47 x 15 x 3.0 x 12 x 20 x 1.7 x 51 x 35 x 1.4 x – – – 38 x 26 x 1.4 x 24 10 2.4<br />
Holy See – – – – – – – – – – – – – – – – – – – – –<br />
Honduras 95 93 1.0 90 x 50 x 1.8 x 4 x 11 x 2.4 x 55 x 56 x 1.0 x 92 x 86 x 1.1 x 37 x 21 x 1.8 x 85 69 1.2<br />
Hungary – – – – – – – – – – – – – – – – – – 100 100 1.0<br />
Iceland – – – – – – – – – – – – – – – – – – 100 100 1.0<br />
India 59 35 1.7 76 43 1.7 33 x 46 x 1.4 x 33 x 24 x 1.4 x – – – 33 x 14 x 2.4 x 58 23 2.5<br />
Indonesia 71 41 1.7 84 76 1.1 15 21 1.4 33 35 0.9 99 97 1.0 16 y 6 y 2.5 y 73 39 1.9<br />
Iran (Islamic Republic of) – – – – – – – – – – – – – – – – – – 100 100 1.0<br />
Iraq 95 96 1.0 86 71 1.2 6 x 7 x 1.1 x 30 x 32 x 0.9 x 92 x 78 x 1.2 x 4 x 1 x 4.4 x 76 67 1.1<br />
Ireland – – – – – – – – – – – – – – – – – – 100 98 1.0<br />
Israel – – – – – – – – – – – – – – – – – – 100 100 1.0<br />
Italy – – – – – – – – – – – – – – – – – – – – –<br />
Jamaica – – – 99 98 1.0 – – – – – – 97 x 98 x 1.0 x 66 60 1.1 78 82 1.0<br />
Japan – – – – – – – – – – – – – – – – – – 100 100 1.0<br />
Jordan – – – 99 99 1.0 2 2 1.3 20 20 1.0 – – – – – – 98 98 1.0<br />
Kazakhstan 100 100 1.0 100 x 100 x 1.0 x 3 x 5 x 1.7 x – – – 98 x 98 x 1.0 x 24 x 21 x 1.1 x 97 98 1.0<br />
Kenya 76 57 1.3 75 37 2.0 10 17 1.7 40 39 1.0 81 72 1.1 57 45 1.3 32 32 1.0<br />
Kiribati 95 93 1.0 84 77 1.1 – – – – – – – – – 45 43 1.1 – – –<br />
Kuwait – – – – – – – – – – – – – – – – – – 100 100 1.0<br />
Kyrgyzstan 96 93 1.0 100 x 96 x 1.0 x 2 x 2 x 0.9 x – – – 93 x 92 x 1.0 x 23 x 18 x 1.3 x 94 93 1.0<br />
Lao People’s Democratic<br />
Republic 84 68 1.2 68 x 11 x 6.2 x 20 x 34 x 1.7 x 79 x 43 x 1.9 x 93 x 75 x 1.2 x – – – 89 50 1.8<br />
Latvia – – – – – – – – – – – – – – – – – – – – –<br />
Lebanon – – – – – – – – – – – – – – – – – – 100 – –<br />
Lesotho 43 46 1.0 88 54 1.6 12 13 1.1 57 50 1.1 93 88 1.0 44 36 1.2 32 24 1.3<br />
Liberia 5 y 3 y 1.9 y 79 32 2.4 17 y 20 y 1.2 y 57 52 1.1 46 21 2.2 26 15 1.8 29 7 4.1<br />
Libya – – – – – – – – – – – – – – – – – – 97 96 1.0<br />
Liechtenstein – – – – – – – – – – – – – – – – – – – – –<br />
Lithuania – – – – – – – – – – – – – – – – – – 95 – –<br />
Luxembourg – – – – – – – – – – – – – – – – – – 100 100 1.0<br />
Madagascar 92 78 1.2 82 39 2.1 31 x 37 x 1.2 x 32 14 2.2 93 77 1.2 40 19 2.1 21 12 1.8<br />
Malawi – – – 84 69 1.2 10 13 1.3 72 69 1.0 88 x 88 x 1.0 x 56 38 1.5 49 51 1.0<br />
Malaysia – – – – – – – – – – – – – – – – – – 96 95 1.0<br />
Maldives 93 92 1.0 99 93 1.1 11 20 1.8 – – – 83 83 1.0 43 32 1.4 98 97 1.0<br />
Mali 92 77 1.2 80 x 38 x 2.1 x 20 x 29 x 1.5 x 26 x 11 x 2.3 x 79 52 1.5 19 12 1.5 35 14 2.5<br />
Malta – – – – – – – – – – – – – – – – – – 100 100 1.0<br />
Marshall Islands 96 96 1.0 97 68 1.4 – – – – – – – – – 33 12 2.7 83 53 1.6<br />
Mauritania 75 42 1.8 90 39 2.3 – – – 16 y 11 y 1.5 y 72 49 1.5 8 2 4.7 51 9 5.7<br />
Mauritius – – – – – – – – – – – – – – – – – – 91 88 1.0<br />
Mexico – – – 98 87 1.1 – – – – – – – – – – – – 87 79 1.1<br />
Micronesia<br />
(Federated States of) – – – – – – – – – – – – – – – – – – – – –<br />
Monaco – – – – – – – – – – – – – – – – – – 100 – –<br />
Mongolia 99 99 1.0 99 98 1.0 4 5 1.2 41 x 36 x 1.1 x 97 94 1.0 36 21 1.7 64 29 2.2<br />
Montenegro 98 99 1.0 100 x 98 x 1.0 x 2 x 1 x 0.7 x – – – 97 x 98 x 1.0 x – – – 92 87 1.1<br />
Morocco 92 x,y 80 x,y 1.1 x,y 92 55 1.7 2 4 2.5 28 x 18 x 1.5 x 96 x 83 x 1.2 x – – – 83 52 1.6<br />
Mozambique 39 28 1.4 78 46 1.7 10 17 1.7 65 50 1.3 89 78 1.1 43 32 1.4 38 5 7.6<br />
Myanmar 94 64 1.5 90 63 1.4 19 24 1.3 72 56 1.3 93 89 1.0 – – – 83 73 1.1<br />
Namibia 83 59 1.4 94 73 1.3 12 19 1.7 67 60 1.1 94 91 1.0 65 65 1.0 57 17 3.4<br />
Nauru – – – – – – – – – – – – – – – – – – 65 – –<br />
Nepal 44 42 1.0 73 32 2.3 17 30 1.8 44 39 1.1 70 y 69 y 1.0 y 40 24 1.7 48 27 1.8<br />
Netherlands – – – – – – – – – – – – – – – – – – 100 100 1.0<br />
ratio of<br />
urban to<br />
rural<br />
STATISTICAL TABLES 145
TABLE 12 dispAriTiEs By rEsidEncE<br />
Countries<br />
and areas<br />
New Zealand – – – – – – – – – – – – – – – – – – – – –<br />
Nicaragua 87 y 77 y 1.1 y 92 56 1.7 4 7 1.7 64 55 1.2 76 y 64 y 1.2 y – – – 63 37 1.7<br />
Niger 71 y 25 y 2.9 y 71 x 8 x 8.5 x 44 y 39 y 0.9 y 31 x 16 x 2.0 x 71 x 32 x 2.2 x 31 x 8 x 3.8 x 34 4 8.5<br />
Nigeria 49 22 2.2 65 28 2.4 16 27 1.7 41 21 1.9 78 56 1.4 30 18 1.7 35 27 1.3<br />
Niue – – – – – – – – – – – – – – – – – – 100 100 1.0<br />
Norway – – – – – – – – – – – – – – – – – – 100 100 1.0<br />
Oman – – – – – – – – – – – – – – – – – – 100 95 1.1<br />
Pakistan 32 24 1.3 66 33 2.0 27 33 1.3 44 40 1.1 78 62 1.3 – – – 72 34 2.1<br />
Palau – – – – – – – – – – – – – – – – – – 100 100 1.0<br />
Panama – – – 99 84 1.2 – – – – – – – – – – – – – – –<br />
Papua New Guinea – – – 88 x 47 x 1.9 x 12 x 20 x 1.6 x – – – – – – – – – 71 41 1.7<br />
Paraguay – – – – – – – – – – – – 89 87 1.0 – – – 90 40 2.3<br />
Peru – – – 96 64 1.5 2 8 3.8 37 24 1.6 97 94 1.0 – – – 81 37 2.2<br />
Philippines 87 x 78 x 1.1 x 78 48 1.6 – – – 58 36 1.6 – – – 23 17 1.4 79 69 1.1<br />
Poland – – – – – – – – – – – – – – – – – – 96 – –<br />
Portugal – – – – – – – – – – – – – – – – – – 100 100 1.0<br />
Qatar – – – – – – – – – – – – – – – – – – 100 100 1.0<br />
Republic of Korea – – – – – – – – – – – – – – – – – – 100 100 1.0<br />
Republic of Moldova 98 x 98 x 1.0 x 100 x 99 x 1.0 x 2 x 4 x 2.0 x 9 x 6 x 1.5 x – – – – – – 89 82 1.1<br />
Romania – – – 100 x 98 x 1.0 x 3 x 4 x 1.3 x – – – – – – – – – – – –<br />
Russian Federation – – – – – – – – – – – – – – – – – – 74 59 1.3<br />
Rwanda 60 64 0.9 82 67 1.2 6 12 1.9 26 30 0.9 92 87 1.1 66 50 1.3 52 56 0.9<br />
Saint Kitts and Nevis – – – – – – – – – – – – – – – – – – 96 96 1.0<br />
Saint Lucia – – – – – – – – – – – – – – – – – – 71 63 1.1<br />
Saint Vincent<br />
and the Grenadines – – – – – – – – – – – – – – – – – – – 96 –<br />
Samoa 62 44 1.4 94 78 1.2 – – – – – – 89 y 88 y 1.0 y 5 2 2.4 98 98 1.0<br />
San Marino – – – – – – – – – – – – – – – – – – – – –<br />
Sao Tome and Principe 76 74 1.0 89 75 1.2 12 14 1.1 45 52 0.9 86 85 1.0 47 38 1.3 30 19 1.6<br />
Saudi Arabia – – – – – – – – – – – – – – – – – – 100 – –<br />
Senegal 89 66 1.4 91 49 1.8 12 21 1.8 24 21 1.2 81 50 1.6 41 18 2.2 70 39 1.8<br />
Serbia 99 99 1.0 100 100 1.0 2 1 0.7 50 22 2.3 99 98 1.0 63 41 1.5 96 88 1.1<br />
Seychelles – – – – – – – – – – – – – – – – – – 98 – –<br />
Sierra Leone 78 78 1.0 72 59 1.2 20 22 1.1 66 75 0.9 80 72 1.1 30 19 1.6 23 6 3.8<br />
Singapore – – – – – – – – – – – – – – – – – – 100 – –<br />
Slovakia – – – – – – – – – – – – – – – – – – 100 99 1.0<br />
Slovenia – – – – – – – – – – – – – – – – – – 100 100 1.0<br />
Solomon Islands – – – 95 84 1.1 8 12 1.5 – – – 72 y 65 y 1.1 y 34 28 1.2 98 – –<br />
Somalia 6 2 3.7 65 x 15 x 4.5 x 20 x 38 x 1.9 x 25 x 9 x 2.9 x 30 x 9 x 3.3 x 7 x 2 x 4.1 x 52 6 8.7<br />
South Africa – – – 94 x 85 x 1.1 x 10 x 9 x 0.9 x 41 x 32 x 1.3 x – – – – – – 86 67 1.3<br />
South Sudan s 45 32 1.4 31 15 2.0 23 29 1.3 44 37 1.2 47 23 2.0 16 7 2.3 – – –<br />
Spain – – – – – – – – – – – – – – – – – – 100 100 1.0<br />
Sri Lanka 97 98 1.0 99 99 1.0 – – – 57 50 1.1 – – – – – – 88 93 0.9<br />
State of Palestine 97 y 96 y 1.0 y 99 x 98 x 1.0 x – – – – – – – – – – – – 92 92 1.0<br />
Sudan s 85 50 1.7 41 16 2.5 24 35 1.5 23 22 1.1 89 69 1.3 10 3 3.4 – – –<br />
Suriname 98 95 1.0 95 x 82 x 1.2 x 7 x 8 x 1.1 x 24 x 60 x 0.4 x 96 x 91 x 1.1 x 45 x 32 x 1.4 x 90 66 1.4<br />
Swaziland 62 47 1.3 89 80 1.1 4 6 1.5 65 55 1.2 97 96 1.0 70 55 1.3 64 55 1.2<br />
Sweden – – – – – – – – – – – – – – – – – – 100 100 1.0<br />
Switzerland – – – – – – – – – – – – – – – – – – 100 100 1.0<br />
Syrian Arab Republic 96 95 1.0 99 93 1.1 9 x 9 x 1.0 x 56 x 44 x 1.3 x 89 x 85 x 1.0 x 7 x 7 x 1.0 x 96 93 1.0<br />
Tajikistan 85 90 0.9 95 86 1.1 12 16 1.3 70 78 0.9 97 y 97 y 1.0 y – – – 95 94 1.0<br />
Thailand 100 99 1.0 100 100 1.0 5 x 8 x 1.7 x 50 x 59 x 0.9 x 98 x 98 x 1.0 x 43 x 47 x 0.9 x 95 96 1.0<br />
The former Yugoslav<br />
Republic of Macedonia 100 100 1.0 98 98 1.0 1 2 2.3 19 x 30 x 0.6 x 99 98 1.0 33 x 18 x 1.8 x 92 82 1.1<br />
Timor-Leste 50 57 0.9 59 20 2.9 35 47 1.4 65 74 0.9 79 70 1.1 14 12 1.2 73 37 2.0<br />
Togo 93 71 1.3 91 43 2.1 10 20 1.9 15 10 1.5 94 86 1.1 39 27 1.4 26 3 8.7<br />
Tonga – – – – – – – – – – – – – – – – – – 98 96 1.0<br />
Trinidad and Tobago – – – – – – – – – – – – – – – – – – 92 92 1.0<br />
Tunisia – – – 98 x 89 x 1.1 x – – – 58 x 50 x 1.1 x – – – – – – 96 – –<br />
Turkey 95 92 1.0 96 80 1.2 1 3 2.1 – – – 94 y 91 y 1.0 y – – – 97 75 1.3<br />
Turkmenistan 96 95 1.0 100 x 99 x 1.0 x 7 x 9 x 1.2 x 32 x 45 x 0.7 x – – – 7 x 4 x 2.0 x 99 97 1.0<br />
Tuvalu 60 38 1.6 – – – – – – – – – – – – 38 41 0.9 88 81 1.1<br />
Uganda 38 29 1.3 89 52 1.7 7 15 2.3 46 43 1.1 85 y 81 y 1.1 y 48 35 1.4 34 34 1.0<br />
Ukraine 100 100 1.0 99 98 1.0 – – – – – – 71 76 0.9 48 37 1.3 96 89 1.1<br />
146<br />
Birth registration (%)<br />
2005–2011*<br />
urban rural<br />
Skilled attendant at<br />
birth (%)<br />
2007–2012*<br />
ratio of<br />
urban to<br />
rural urban rural<br />
Underweight prevalence<br />
in children under 5 (%)<br />
2007–2011*<br />
ratio of<br />
urban to<br />
rural urban rural<br />
Diarrhoea treatment<br />
<strong>with</strong> oral rehydration<br />
salts (ORS) (%)<br />
2007−2012*<br />
ratio of<br />
rural to<br />
urban urban rural<br />
THE STATE OF THE WORLD’S CHILDREN 2013: <strong>Children</strong> <strong>with</strong> <strong>Disabilities</strong><br />
Primary school net<br />
attendance ratio<br />
2007−2011*<br />
ratio of<br />
urban to<br />
rural urban rural<br />
Comprehensive<br />
knowledge of HIV (%)<br />
Females 15−24<br />
2007−2011*<br />
ratio of<br />
urban to<br />
rural urban rural<br />
Use of improved<br />
sanitation facilities (%)<br />
2010<br />
ratio of<br />
urban to<br />
rural urban rural<br />
ratio of<br />
urban to<br />
rural
Countries<br />
and areas<br />
Birth registration (%)<br />
2005–2011*<br />
urban rural<br />
Skilled attendant at<br />
birth (%)<br />
2007–2012*<br />
ratio of<br />
urban to<br />
rural urban rural<br />
United Arab Emirates – – – – – – – – – – – – – – – – – – 98 95 1.0<br />
United Kingdom – – – – – – – – – – – – – – – – – – 100 100 1.0<br />
United Republic of Tanzania 44 10 4.6 83 40 2.0 11 17 1.5 44 44 1.0 91 77 1.2 55 45 1.2 20 7 2.9<br />
United States – – – – – – – – – – – – – – – – – – 100 99 1.0<br />
Uruguay – – – – – – – – – – – – – – – – – – 100 99 1.0<br />
Uzbekistan 100 100 1.0 100 x 100 x 1.0 x 4 x 4 x 0.9 x 34 x 31 x 1.1 x 97 x 95 x 1.0 x 33 x 30 x 1.1 x 100 100 1.0<br />
Vanuatu 39 23 1.7 87 72 1.2 11 11 1.0 – – – 85 80 1.1 23 13 1.8 64 54 1.2<br />
Venezuela<br />
(Bolivarian Republic of) – – – – – – – – – – – – – – – – – – – – –<br />
Viet Nam 97 94 1.0 99 91 1.1 6 14 2.3 47 46 1.0 98 98 1.0 58 48 1.2 94 68 1.4<br />
Yemen 38 16 2.3 62 x 26 x 2.3 x – – – 30 x 34 x 0.9 x 83 x 64 x 1.3 x 4 x 1 x 6.7 x 93 34 2.7<br />
Zambia 28 9 3.2 83 31 2.7 13 15 1.2 59 60 1.0 91 77 1.2 42 27 1.6 57 43 1.3<br />
Zimbabwe 65 43 1.5 86 58 1.5 8 10 1.3 26 18 1.4 89 88 1.0 59 47 1.3 52 32 1.6<br />
MEMORANDUM<br />
Sudan and South Sudan s – – – – – – – – – – – – – – – – – – 44 † 14 † 3.1 †<br />
SUMMARY INDICATORS #<br />
Sub-Saharan Africa 56 33 1.7 76 40 1.9 15 24 1.6 38 31 1.2 83 67 1.2 34 25 1.4 43 23 1.9<br />
Eastern and Southern<br />
Africa 49 28 1.7 75 36 2.1 12 20 1.7 46 38 1.2 87 72 1.2 48 32 1.5 54 27 2.0<br />
West and Central Africa 57 36 1.6 78 46 1.7 16 26 1.7 35 23 1.5 80 61 1.3 29 16 1.8 35 20 1.8<br />
Middle East and North<br />
Africa 91 72 1.3 84 57 1.5 – – – – – – – – – – – – 91 70 1.3<br />
South Asia 52 32 1.6 73 40 1.8 31 43 1.4 39 32 1.2 – – – 33 14 2.3 60 28 2.1<br />
East Asia and the Pacific 80 ** 65 ** 1.2 ** 95 88 1.1 5 10 2.0 46 ** 41 ** 1.1 ** 98 ** 95 ** 1.0 ** 24 ** 21 ** 1.1 ** 77 58 1.3<br />
Latin America<br />
and the Caribbean – – – – – – – – – – – – – – – – – – 84 60 1.4<br />
CEE/CIS 97 96 1.0 – – – – – – – – – – – – – – – 87 80 1.1<br />
Least developed countries 50 31 1.6 76 40 1.9 18 27 1.5 47 41 1.1 86 73 1.2 35 24 1.4 48 30 1.6<br />
World 65 ** 41 ** 1.6 ** 84 53 1.6 15 28 1.9 40 ** 33 ** 1.2 ** – – – – 18 ** – 79 47 1.7<br />
s Due to the cession in July 2011 of the Republic of South Sudan by the Republic of the Sudan, and its subsequent admission to the United Nations on 14 July 2011, disaggregated data for the Sudan<br />
and South Sudan as separate States are not yet available for all indicators. Aggregated data presented are for the Sudan pre-cession (see Memorandum item).<br />
# For a complete list of countries and areas in the regions, subregions and country categories, see page 98.<br />
DEFINITIONS OF THE INDICATORS<br />
Birth registration – Percentage of children under age 5 who were registered<br />
at the moment of the survey. This includes children whose birth certificate was<br />
seen by the interviewer or whose mother or caretaker says the birth has been<br />
registered.<br />
Skilled attendant at birth – Percentage of births attended by skilled health<br />
personnel (doctor, nurse or midwife).<br />
Underweight prevalence in children under 5 – Percentage of children under<br />
age 5 who are below minus two standard deviations from median weight-forage<br />
of the World Health Organization (WHO) Child Growth Standards.<br />
Diarrhoea treatment <strong>with</strong> oral rehydration salts (ORS) – Percentage<br />
of children under age 5 who had diarrhoea in the two weeks preceding the<br />
survey and who received oral rehydration salts (ORS packets or pre-packaged<br />
ORS fluids).<br />
Primary school net attendance ratio – Number of children attending<br />
primary or secondary school who are of official primary school age, expressed<br />
as a percentage of the total number of children of official primary school age.<br />
Because of the inclusion of primary-school-aged children attending secondary<br />
school, this indicator can also be referred to as a primary adjusted net<br />
attendance ratio.<br />
Comprehensive knowledge of HIV – Percentage of young women (aged<br />
15–24) who correctly identify the two major ways of preventing the sexual<br />
transmission of HIV (using condoms and limiting sex to one faithful, uninfected<br />
partner), who reject the two most common local misconceptions about HIV<br />
transmission and who know that a healthy-looking person can be HIV-positive.<br />
Use of improved sanitation facilities – Percentage of the population using<br />
any of the following sanitation facilities, not shared <strong>with</strong> other households:<br />
flush or pour-flush latrine connected to a piped sewerage system, septic tank<br />
or pit latrine; ventilated improved pit latrine; pit latrine <strong>with</strong> a slab; covered pit;<br />
composting toilet.<br />
Underweight prevalence<br />
in children under 5 (%)<br />
2007–2011*<br />
ratio of<br />
urban to<br />
rural urban rural<br />
Diarrhoea treatment<br />
<strong>with</strong> oral rehydration<br />
salts (ORS) (%)<br />
2007−2012*<br />
ratio of<br />
rural to<br />
urban urban rural<br />
TABLE 12 dISpARITIES By RESIdENCE<br />
Primary school net<br />
attendance ratio<br />
2007−2011*<br />
ratio of<br />
urban to<br />
rural urban rural<br />
Comprehensive<br />
knowledge of HIV (%)<br />
Females 15−24<br />
2007−2011*<br />
ratio of<br />
urban to<br />
rural urban rural<br />
Use of improved<br />
sanitation facilities (%)<br />
2010<br />
ratio of<br />
urban to<br />
rural urban rural<br />
ratio of<br />
urban to<br />
rural<br />
MAIN DATA SOURCES<br />
Birth registration – Demographic and Health Surveys (DHS), Multiple Indicator Cluster Surveys (MICS), other<br />
national surveys and vital registration systems.<br />
Skilled attendant at birth – DHS, MICS and other nationally representative sources.<br />
Underweight prevalence in children under 5 – DHS, MICS, other national household surveys, WHO and UNICEF.<br />
Diarrhoea treatment <strong>with</strong> oral rehydration salts (ORS) – DHS, MICS and other national household surveys.<br />
Primary school net attendance ratio – DHS, MICS and other national household surveys.<br />
Comprehensive knowledge of HIV – AIDS Indicator Surveys (AIS), DHS, MICS and other national household<br />
surveys; HIV/AIDS Survey Indicators Database, .<br />
Use of improved sanitation facilities – UNICEF and WHO Joint Monitoring Programme.<br />
Italicized disparity data are from different sources than the data for the same indicators presented<br />
elsewhere in the report: Table 2 (Nutrition – Underweight prevalence), Table 3 (Health – Diarrhoea<br />
treatment), Table 4 (HIV/AIDS – Comprehensive knowledge of HIV) and Table 8 (Women – Skilled<br />
attendant at birth).<br />
NOTES<br />
− Data not available.<br />
x Data refer to years or periods other than those specified in the column heading. Such data are not included in<br />
the calculation of regional and global averages, <strong>with</strong> the exception of 2005–2006 data from India. Estimates<br />
from data years prior to 2000 are not displayed.<br />
y Data differ from the standard definition or refer to only part of a country. If they fall <strong>with</strong>in the noted<br />
reference period, such data are included in the calculation of regional and global averages.<br />
† The WHO/UNICEF Joint Monitoring Programme For Water Supply and Sanitation (JMP) closed its databases<br />
for these estimates before the cession of the Republic of South Sudan by the Republic of the Sudan.<br />
Aggregated data presented are for the Sudan pre-cession. Disaggregated data for the Sudan and South<br />
Sudan as separate States will be published by the JMP in 2013.<br />
* Data refer to the most recent year available during the period specified in the column heading.<br />
** Excludes China.<br />
STATISTICAL TABLES 147
TABLE 13: dISpARITIES By HOuSEHOLd WEALTH<br />
Countries<br />
and areas<br />
Afghanistan 31 58 1.9 16 76 4.9 – – – 56 52 0.9 – – – – – – – – –<br />
Albania 98 99 1.0 98 100 1.0 8 4 2.2 – – – 89 91 1.0 20 60 3.0 10 38 3.8<br />
Algeria – – – 88 x 98 x 1.1 x 5 x 2 x 2.4 x 15 x 19 x 1.2 x 93 x 98 x 1.1 x 5 x 20 x 3.7 x – – –<br />
Andorra – – – – – – – – – – – – – – – – – – – – –<br />
Angola 17 x 48 x 2.8 x – – – – – – – – – 63 78 1.2 – – – – – –<br />
Antigua and Barbuda – – – – – – – – – – – – – – – – – – – – –<br />
Argentina – – – – – – – – – – – – – – – – – – – – –<br />
Armenia 100 100 1.0 99 100 1.0 8 2 5.3 – – – – – – – – – – – –<br />
Australia – – – – – – – – – – – – – – – – – – – – –<br />
Austria – – – – – – – – – – – – – – – – – – – – –<br />
Azerbaijan 92 97 1.1 76 x 100 x 1.3 x 15 x 2 x 7.0 x 3 x 36 x 13.3 x 72 x 78 x 1.1 x 1 x 12 x 10.3 x 2 x 14 x 6.3 x<br />
Bahamas – – – – – – – – – – – – – – – – – – – – –<br />
Bahrain – – – – – – – – – – – – – – – – – – – – –<br />
Bangladesh 6 19 3.0 12 64 5.5 50 21 2.4 81 82 1.0 – – – – – – – – –<br />
Barbados – – – – – – – – – – – – – – – – – – – – –<br />
Belarus – – – 100 x 100 x 1.0 x 2 x 0 x 6.7 x – – – 96 x 94 x 1.0 x – – – – – –<br />
Belgium – – – – – – – – – – – – – – – – – – – – –<br />
Belize 95 97 1.0 – – – – – – – – – – – – 28 x 55 x 2.0 x – – –<br />
Benin 46 75 1.6 52 x 96 x 1.9 x 25 x 10 x 2.4 x 15 x 32 x 2.1 x 39 x 63 x 1.6 x 9 x 26 x 3.1 x 17 x 52 x 3.0 x<br />
Bhutan 100 100 1.0 34 95 2.8 16 7 2.2 60 56 0.9 85 94 1.1 7 32 4.4 – – –<br />
Bolivia (Plurinational<br />
State of) 68 y 90 y 1.3 y 38 99 2.6 8 2 3.8 31 35 1.1 95 97 1.0 5 40 8.4 11 45 4.3<br />
Bosnia and Herzegovina 99 100 1.0 99 x 100 x 1.0 x 2 x 3 x 0.5 x – – – 99 x 98 x 1.0 x 46 x 49 x 1.1 x – – –<br />
Botswana – – – 84 x 100 x 1.2 x 16 4 4.0 – – – – – – – – – – – –<br />
Brazil – – – – – – – – – – – – – – – – – – – – –<br />
Brunei Darussalam – – – – – – – – – – – – – – – – – – – – –<br />
Bulgaria – – – – – – – – – – – – – – – – – – – – –<br />
Burkina Faso 62 95 1.5 46 92 2.0 38 x 18 x 2.1 x 13 31 2.5 33 x 39 x 1.2 x 8 x 37 x 4.4 x – – –<br />
Burundi 64 87 1.4 51 81 1.6 41 17 2.4 35 42 1.2 64 87 1.4 – – – – – –<br />
Cambodia 48 78 1.6 49 97 2.0 35 16 2.2 32 34 1.1 79 y 86 y 1.1 y 28 58 2.1 30 64 2.1<br />
Cameroon 51 91 1.8 23 x 98 x 4.4 x – – – 5 x 34 x 6.8 x 50 x 87 x 1.7 x 12 x 50 x 4.0 x – – –<br />
Canada – – – – – – – – – – – – – – – – – – – – –<br />
Cape Verde – – – – – – – – – – – – – – – – – – – – –<br />
Central African Republic 46 85 1.8 33 87 2.6 26 19 1.4 11 28 2.5 31 x 48 x 1.5 x 14 23 1.6 19 33 1.7<br />
Chad 5 46 9.2 8 61 7.6 33 21 1.6 5 29 5.3 – – – 6 18 2.9 – – –<br />
Chile – – – – – – – – – – – – – – – – – – – – –<br />
China – – – – – – – – – – – – – – – – – – – – –<br />
Colombia – – – 84 99 1.2 6 2 3.0 47 61 1.3 90 93 1.0 15 32 2.2 – – –<br />
Comoros 72 x 93 x 1.3 x 49 x 77 x 1.6 x – – – 16 x 24 x 1.5 x 25 x 39 x 1.6 x – – – – – –<br />
Congo 69 y 91 y 1.3 y 40 x 95 x 2.4 x 16 x 5 x 3.1 x 13 x 18 x 1.4 x – – – 5 12 2.4 12 27 2.3<br />
Cook Islands – – – – – – – – – – – – – – – – – – – – –<br />
Costa Rica – – – – – – – – – – – – – – – – – – – – –<br />
Côte d’Ivoire 28 89 3.2 29 x 95 x 3.3 x 21 x,y 6 x,y 3.4 x,y 6 x 12 x 2.0 x 35 x 55 x 1.6 x – – – – – –<br />
Croatia – – – – – – – – – – – – – – – – – – – – –<br />
Cuba – – – – – – – – – – – – – – – – – – – – –<br />
Cyprus – – – – – – – – – – – – – – – – – – – – –<br />
Czech Republic – – – – – – – – – – – – – – – – – – – – –<br />
Democratic People’s<br />
Republic of Korea – – – – – – – – – – – – – – – – – – – – –<br />
Democratic<br />
Republic of the Congo 25 27 1.1 69 99 1.4 29 12 2.3 28 26 0.9 65 73 1.1 8 24 2.8 14 30 2.2<br />
Denmark – – – – – – – – – – – – – – – – – – – – –<br />
Djibouti – – – – – – – – – – – – – – – – – – – – –<br />
Dominica – – – – – – – – – – – – – – – – – – – – –<br />
Dominican Republic 61 93 1.5 95 99 1.0 5 1 4.4 41 38 0.9 92 98 1.1 31 46 1.5 21 41 2.0<br />
Ecuador – – – 99 x 98 x 1.0 x – – – – – – – – – – – – – – –<br />
Egypt 99 100 1.0 55 97 1.8 8 5 1.4 34 23 0.7 81 93 1.1 2 9 4.9 9 28 3.1<br />
El Salvador 98 99 1.0 91 98 1.1 12 y 1 y 12.9 y – – – – – – – – – – – –<br />
Equatorial Guinea – – – 47 x 85 x 1.8 x – – – 24 x 37 x 1.5 x – – – – – – – – –<br />
Eritrea – – – 7 x 81 x 12.1 x – – – – – – – – – – – – – – –<br />
Estonia – – – – – – – – – – – – – – – – – – – – –<br />
Ethiopia 3 18 7.0 2 46 26.8 36 15 2.4 18 45 2.5 52 86 1.7 – – – – – –<br />
Fiji – – – – – – – – – – – – – – – – – – – – –<br />
Finland – – – – – – – – – – – – – – – – – – – – –<br />
148<br />
Birth registration (%)<br />
2005–2011*<br />
poorest<br />
20%<br />
richest<br />
20%<br />
ratio of<br />
richest to poorest<br />
poorest 20%<br />
Skilled attendant at<br />
birth (%)<br />
2007–2012*<br />
richest<br />
20%<br />
ratio of<br />
richest to poorest<br />
poorest 20%<br />
Underweight prevalence<br />
in children under 5 (%)<br />
2007–2011*<br />
Diarrhoea treatment<br />
<strong>with</strong> oral rehydration<br />
salts (ORS) (%)<br />
2007−2012*<br />
THE STATE OF THE WORLD’S CHILDREN 2013: <strong>Children</strong> <strong>with</strong> <strong>Disabilities</strong><br />
richest<br />
20%<br />
ratio of<br />
poorest to poorest<br />
richest 20%<br />
richest<br />
20%<br />
ratio of<br />
richest to poorest<br />
poorest 20%<br />
Primary school net<br />
attendance ratio<br />
2007−2011*<br />
richest<br />
20%<br />
ratio of<br />
richest to poorest<br />
poorest 20%<br />
Comprehensive<br />
knowledge of HIV<br />
(%) Females 15−24<br />
2007−2011*<br />
richest<br />
20%<br />
ratio of<br />
richest to poorest<br />
poorest 20%<br />
Comprehensive<br />
knowledge of HIV<br />
(%) Males 15−24<br />
2007−2011*<br />
richest<br />
20%<br />
ratio of<br />
richest to<br />
poorest
Countries<br />
and areas<br />
Birth registration (%)<br />
2005–2011*<br />
poorest<br />
20%<br />
richest<br />
20%<br />
ratio of<br />
richest to poorest<br />
poorest 20%<br />
Skilled attendant at<br />
birth (%)<br />
2007–2012*<br />
richest<br />
20%<br />
ratio of<br />
richest to poorest<br />
poorest 20%<br />
Underweight prevalence<br />
in children under 5 (%)<br />
2007–2011*<br />
richest<br />
20%<br />
ratio of<br />
poorest to poorest<br />
richest 20%<br />
TABLE 13 dISpARITIES By HOuSEHOLd WEALTH<br />
Diarrhoea treatment<br />
<strong>with</strong> oral rehydration<br />
salts (ORS) (%)<br />
2007−2012*<br />
Primary school net<br />
attendance ratio<br />
2007−2011*<br />
Comprehensive<br />
knowledge of HIV<br />
(%) Females 15−24<br />
2007−2011*<br />
Comprehensive<br />
knowledge of HIV<br />
(%) Males 15−24<br />
2007−2011*<br />
France – – – – – – – – – – – – – – – – – – – – –<br />
Gabon 88 x 92 x 1.0 x – – – – – – – – – – – – – – – – – –<br />
Gambia 46 61 1.3 34 58 1.7 24 9 2.6 43 32 0.7 28 42 1.5 20 48 2.4 – – –<br />
Georgia 99 98 1.0 95 x 99 x 1.0 x – – – – – – 92 96 1.0 – – – – – –<br />
Germany – – – – – – – – – – – – – – – – – – – – –<br />
Ghana 47 82 1.7 39 98 2.5 19 9 2.2 45 34 0.7 61 86 1.4 17 34 2.1 23 50 2.1<br />
Greece – – – – – – – – – – – – – – – – – – – – –<br />
Grenada – – – – – – – – – – – – – – – – – – – – –<br />
Guatemala – – – 20 95 4.7 21 y 3 y 6.5 y 39 51 1.3 – – – 5 41 7.8 – – –<br />
Guinea 21 83 4.0 26 57 2.2 24 19 1.3 18 x 59 x 3.3 x – – – – – – – – –<br />
Guinea-Bissau 17 35 2.0 19 x 79 x 4.0 x 22 11 2.1 16 37 2.3 52 87 1.7 6 25 4.3 – – –<br />
Guyana 84 92 1.1 81 96 1.2 16 4 3.8 – – – 91 97 1.1 37 72 2.0 25 65 2.6<br />
Haiti 72 92 1.3 6 x 68 x 10.5 x 22 x 6 x 3.6 x 29 x 50 x 1.7 x – – – 18 x 41 x 2.2 x 28 x 52 x 1.9 x<br />
Holy See – – – – – – – – – – – – – – – – – – – – –<br />
Honduras 92 96 1.0 33 x 99 x 2.9 x 16 x 2 x 8.1 x 56 x 47 x 0.8 x 80 x 90 x 1.1 x 13 x 44 x 3.4 x – – –<br />
Hungary – – – – – – – – – – – – – – – – – – – – –<br />
Iceland – – – – – – – – – – – – – – – – – – – – –<br />
India 24 72 3.0 24 85 3.6 57 x 20 x 2.9 x 19 x 43 x 2.3 x – – – 4 x 45 x 11.7 x 15 x 55 x 3.8 x<br />
Indonesia 23 84 3.7 65 86 1.3 23 10 2.2 32 27 0.9 – – – 3 23 7.5 2 27 12.2<br />
Iran (Islamic Republic of) – – – – – – – – – – – – – – – – – – – – –<br />
Iraq – – – – – – – – – – – – – – – – – – – – –<br />
Ireland – – – – – – – – – – – – – – – – – – – – –<br />
Israel – – – – – – – – – – – – – – – – – – – – –<br />
Italy – – – – – – – – – – – – – – – – – – – – –<br />
Jamaica 96 99 1.0 97 98 1.0 – – – – – – – – – 54 69 1.3 – – –<br />
Japan – – – – – – – – – – – – – – – – – – – – –<br />
Jordan – – – 98 100 1.0 3 0 26.0 18 30 1.6 – – – – – – – – –<br />
Kazakhstan 100 100 1.0 100 x 100 x 1.0 x 5 x 2 x 2.8 x – – – 99 x 98 x 1.0 x 18 x 28 x 1.6 x – – –<br />
Kenya 48 80 1.7 20 81 4.0 25 9 2.8 40 37 0.9 58 78 1.3 29 61 2.1 42 68 1.6<br />
Kiribati 93 94 1.0 76 93 1.2 – – – – – – – – – 42 49 1.2 38 52 1.4<br />
Kuwait – – – – – – – – – – – – – – – – – – – – –<br />
Kyrgyzstan 94 95 1.0 93 x 100 x 1.1 x 2 x 2 x 0.8 x – – – 94 x 91 x 1.0 x 17 x 29 x 1.7 x – – –<br />
Lao People’s<br />
Democratic Republic 62 85 1.4 3 x 81 x 27.1 x 38 x 14 x 2.7 x 42 x 80 x 1.9 x 59 x 84 x 1.4 x – – – – – –<br />
Latvia – – – – – – – – – – – – – – – – – – – – –<br />
Lebanon – – – – – – – – – – – – – – – – – – – – –<br />
Lesotho 42 49 1.2 35 90 2.6 18 9 1.9 – – – 83 94 1.1 26 48 1.8 14 45 3.3<br />
Liberia 1 y 7 y 6.1 y 26 81 3.2 21 y 13 y 1.6 y 41 64 1.6 15 56 3.7 14 29 2.1 17 37 2.2<br />
Libya – – – – – – – – – – – – – – – – – – – – –<br />
Liechtenstein – – – – – – – – – – – – – – – – – – – – –<br />
Lithuania – – – – – – – – – – – – – – – – – – – – –<br />
Luxembourg – – – – – – – – – – – – – – – – – – – – –<br />
Madagascar 61 93 1.5 22 90 4.1 40 x 24 x 1.7 x 12 29 2.4 59 96 1.6 10 42 4.3 8 49 6.5<br />
Malawi – – – 63 89 1.4 17 13 1.3 67 73 1.1 71 x 90 x 1.3 x 34 55 1.6 35 54 1.5<br />
Malaysia – – – – – – – – – – – – – – – 23 48 2.0 – – –<br />
Maldives 92 94 1.0 89 99 1.1 24 11 2.3 – – – 82 82 1.0 9 19 2.0 – – –<br />
Mali 65 96 1.5 35 x 86 x 2.5 x 31 x 17 x 1.8 x 8 x 29 x 3.5 x 37 56 1.5 – – – – – –<br />
Malta – – – – – – – – – – – – – – – – – – – – –<br />
Marshall Islands 92 98 1.1 68 99 1.5 – – – – – – – – – 12 39 3.3 37 58 1.6<br />
Mauritania 28 83 2.9 21 95 4.6 – – – 10 34 3.2 41 59 1.5 0 12 29.5 4 27 6.2<br />
Mauritius – – – – – – – – – – – – – – – – – – – – –<br />
Mexico – – – – – – – – – – – – – – – – – – – – –<br />
Micronesia<br />
(Federated States of) – – – – – – – – – – – – – – – – – – – – –<br />
Monaco – – – – – – – – – – – – – – – – – – – – –<br />
Mongolia 99 99 1.0 98 99 1.0 6 2 2.7 – – – 93 98 1.1 17 42 2.5 12 48 4.1<br />
Montenegro 94 99 1.0 98 x 100 x 1.0 x 4 x 1 x 4.1 x – – – 92 x 100 x 1.1 x – – – – – –<br />
Morocco – – – 30 x 95 x 3.2 x – – – 18 x 25 x 1.4 x 77 x 95 x 1.2 x – – – – – –<br />
Mozambique 20 48 2.4 37 89 2.4 – – – 40 50 1.3 72 80 1.1 41 43 1.1 16 45 2.7<br />
Myanmar 50 96 1.9 51 96 1.9 33 14 2.5 52 75 1.4 81 94 1.2 – – – – – –<br />
Namibia 46 92 2.0 60 98 1.6 22 7 3.1 50 59 1.2 88 97 1.1 61 69 1.1 55 67 1.2<br />
Nauru 71 88 1.2 97 98 1.0 7 3 2.7 – – – – – – 13 y 10 y 0.8 y – 25 y –<br />
Nepal 36 52 1.5 11 82 7.6 40 10 4.0 39 36 0.9 66 y 76 y 1.2 y 12 x 49 x 4.3 x 30 x 59 x 2.0 x<br />
Netherlands – – – – – – – – – – – – – – – – – – – – –<br />
richest<br />
20%<br />
ratio of<br />
richest to poorest<br />
poorest 20%<br />
richest<br />
20%<br />
ratio of<br />
richest to poorest<br />
poorest 20%<br />
richest<br />
20%<br />
ratio of<br />
richest to poorest<br />
poorest 20%<br />
richest<br />
20%<br />
ratio of<br />
richest to<br />
poorest<br />
STATISTICAL TABLES 149
TABLE 13 dISpARITIES By HOuSEHOLd WEALTH<br />
Countries<br />
and areas<br />
New Zealand – – – – – – – – – – – – – – – – – – – – –<br />
Nicaragua 72 y 93 y 1.3 y 42 99 2.4 9 1 6.6 53 64 1.2 – – – – – – – – –<br />
Niger 20 y 67 y 3.3 y 5 x 59 x 11.8 x – – – 14 x 32 x 2.3 x 26 x 32 x 1.2 x 5 x 30 x 6.5 x 6 x 34 x 5.8 x<br />
Nigeria 9 62 7.0 8 86 10.3 35 10 3.5 15 53 3.5 31 72 2.4 9 34 3.6 18 41 2.2<br />
Niue – – – – – – – – – – – – – – – – – – – – –<br />
Norway – – – – – – – – – – – – – – – – – – – – –<br />
Oman – – – – – – – – – – – – – – – – – – – – –<br />
Pakistan 18 38 2.1 16 77 4.8 – – – 41 44 1.1 42 74 1.8 – – – – – –<br />
Palau – – – – – – – – – – – – – – – – – – – – –<br />
Panama – – – – – – – – – – – – – – – – – – – – –<br />
Papua New Guinea – – – – – – – – – – – – – – – – – – – – –<br />
Paraguay – – – – – – – – – – – – – – – – – – – – –<br />
Peru – – – 56 100 1.8 9 1 15.7 27 42 1.6 92 97 1.1 – – – – – –<br />
Philippines – – – 26 94 3.7 – – – 37 55 1.5 – – – 14 26 1.8 – – –<br />
Poland – – – – – – – – – – – – – – – – – – – – –<br />
Portugal – – – – – – – – – – – – – – – – – – – – –<br />
Qatar – – – – – – – – – – – – – – – – – – – – –<br />
Republic of Korea – – – – – – – – – – – – – – – – – – – – –<br />
Republic of Moldova 97 x 98 x 1.0 x 99 x 100 x 1.0 x 5 x 1 x 8.2 x – – – – – – – – – – – –<br />
Romania – – – – – – – – – – – – – – – – – – – – –<br />
Russian Federation – – – – – – – – – – – – – – – – – – – – –<br />
Rwanda 58 64 1.1 61 86 1.4 16 5 3.0 22 37 1.7 80 94 1.2 – – – – – –<br />
Saint Kitts and Nevis – – – – – – – – – – – – – – – – – – – – –<br />
Saint Lucia – – – – – – – – – – – – – – – – – – – – –<br />
Saint Vincent<br />
and the Grenadines – – – – – – – – – – – – – – – – – – – – –<br />
Samoa 31 63 2.1 66 95 1.4 – – – – – – 85 y 91 y 1.1 y 3 3 1.0 3 9 2.7<br />
San Marino – – – – – – – – – – – – – – – – – – – – –<br />
Sao Tome and Principe 74 86 1.1 74 93 1.3 18 7 2.6 – – – 75 95 1.3 27 56 2.0 39 55 1.4<br />
Saudi Arabia – – – – – – – – – – – – – – – – – – – – –<br />
Senegal 50 94 1.9 30 96 3.2 24 10 2.4 21 31 1.5 47 78 1.7 – – – – – –<br />
Serbia 97 100 1.0 99 100 1.0 3 2 1.4 – – – 96 98 1.0 28 69 2.4 28 66 2.4<br />
Seychelles – – – – – – – – – – – – – – – – – – – – –<br />
Sierra Leone 74 88 1.2 44 85 1.9 22 15 1.4 75 70 0.9 59 88 1.5 14 36 2.6 – – –<br />
Singapore – – – – – – – – – – – – – – – – – – – – –<br />
Slovakia – – – – – – – – – – – – – – – – – – – – –<br />
Slovenia – – – – – – – – – – – – – – – – – – – – –<br />
Solomon Islands – – – 74 95 1.3 14 10 1.4 – – – 58 y 61 y 1.1 y 17 37 2.1 35 50 1.5<br />
Somalia 1 7 6.6 11 x 77 x 7.2 x 42 x 14 x 3.0 x 7 x 31 x 4.8 x 3 x 40 x 12.5 x 1 x 8 x 13.5 x – – –<br />
South Africa – – – – – – – – – – – – – – – – – – – – –<br />
South Sudan s 21 57 2.7 8 41 5.1 32 21 1.6 27 52 1.9 12 58 4.7 3 18 6.1 – – –<br />
Spain – – – – – – – – – – – – – – – – – – – – –<br />
Sri Lanka 97 98 1.0 97 99 1.0 29 11 2.6 – – – – – – – – – – – –<br />
State of Palestine – – – 98 x 100 x 1.0 x – – – – – – – – – – – – – – –<br />
Sudan s 26 98 3.8 6 59 10.5 40 17 2.4 21 16 0.7 55 97 1.8 1 11 13.6 – – –<br />
Suriname 94 98 1.0 81 x 96 x 1.2 x 9 x 5 x 1.8 x – – – 88 x 97 x 1.1 x 23 x 54 x 2.4 x – – –<br />
Swaziland 39 73 1.9 65 94 1.4 8 4 2.3 58 60 1.0 95 99 1.0 49 72 1.5 44 64 1.5<br />
Sweden – – – – – – – – – – – – – – – – – – – – –<br />
Switzerland – – – – – – – – – – – – – – – – – – – – –<br />
Syrian Arab Republic 92 99 1.1 78 x 99 x 1.3 x 10 x 7 x 1.5 x 45 x 59 x 1.3 x – – – 4 x 10 x 2.9 x – – –<br />
Tajikistan 89 86 1.0 90 90 1.0 17 13 1.3 52 x 50 x 1.0 x 96 y 96 y 1.0 y – – – – – –<br />
Thailand 99 100 1.0 93 x 100 x 1.1 x 11 x 3 x 3.3 x 56 x 54 x 1.0 x 97 x 98 x 1.0 x 47 x 43 x 0.9 x – – –<br />
The former Yugoslav<br />
Republic of Macedonia 99 100 1.0 98 98 1.0 2 0 – – – – 97 99 1.0 9 x 45 x 5.0 x – – –<br />
Timor-Leste 50 56 1.1 10 69 6.9 49 35 1.4 70 71 1.0 60 83 1.4 9 16 1.8 11 35 3.0<br />
Togo 59 97 1.7 28 94 3.4 21 9 2.5 8 19 2.5 80 92 1.2 18 42 2.3 20 55 2.7<br />
Tonga – – – – – – – – – – – – – – – – – – – – –<br />
Trinidad and Tobago 94 98 1.0 98 100 1.0 – – – – – – 95 x 99 x 1.0 x 48 x 62 x 1.3 x – – –<br />
Tunisia – – – – – – – – – – – – – – – – – – – – –<br />
Turkey 89 99 1.1 73 100 1.4 4 1 8.4 – – – 87 y 95 y 1.1 y – – – – – –<br />
Turkmenistan 94 97 1.0 99 x 100 x 1.0 x 8 x 2 x 3.2 x 45 x 30 x 0.7 x – – – 3 x 8 x 2.8 x – – –<br />
Tuvalu 39 71 1.8 99 98 1.0 1 0 – – – – – – – 34 y 39 1.2 y – 67 y –<br />
Uganda 27 44 1.6 43 88 2.0 – – – 43 45 1.1 – – – 20 x 47 x 2.3 x 28 x 47 x 1.6 x<br />
Ukraine 100 100 1.0 97 99 1.0 – – – – – – 78 75 1.0 33 45 1.4 28 42 1.5<br />
150<br />
Birth registration (%)<br />
2005–2011*<br />
poorest<br />
20%<br />
richest<br />
20%<br />
ratio of<br />
richest to poorest<br />
poorest 20%<br />
Skilled attendant at<br />
birth (%)<br />
2007–2012*<br />
richest<br />
20%<br />
ratio of<br />
richest to poorest<br />
poorest 20%<br />
Underweight prevalence<br />
in children under 5 (%)<br />
2007–2011*<br />
Diarrhoea treatment<br />
<strong>with</strong> oral rehydration<br />
salts (ORS) (%)<br />
2007−2012*<br />
THE STATE OF THE WORLD’S CHILDREN 2013: <strong>Children</strong> <strong>with</strong> <strong>Disabilities</strong><br />
richest<br />
20%<br />
ratio of<br />
poorest to poorest<br />
richest 20%<br />
richest<br />
20%<br />
ratio of<br />
richest to poorest<br />
poorest 20%<br />
Primary school net<br />
attendance ratio<br />
2007−2011*<br />
richest<br />
20%<br />
ratio of<br />
richest to poorest<br />
poorest 20%<br />
Comprehensive<br />
knowledge of HIV<br />
(%) Females 15−24<br />
2007−2011*<br />
richest<br />
20%<br />
ratio of<br />
richest to poorest<br />
poorest 20%<br />
Comprehensive<br />
knowledge of HIV<br />
(%) Males 15−24<br />
2007−2011*<br />
richest<br />
20%<br />
ratio of<br />
richest to<br />
poorest
Countries<br />
and areas<br />
Birth registration (%)<br />
2005–2011*<br />
poorest<br />
20%<br />
richest<br />
20%<br />
ratio of<br />
richest to poorest<br />
poorest 20%<br />
Skilled attendant at<br />
birth (%)<br />
2007–2012*<br />
richest<br />
20%<br />
ratio of<br />
richest to poorest<br />
poorest 20%<br />
United Arab Emirates – – – – – – – – – – – – – – – – – – – – –<br />
United Kingdom – – – – – – – – – – – – – – – – – – – – –<br />
United Republic of Tanzania 4 56 12.7 31 90 2.9 22 9 2.3 41 38 0.9 68 93 1.4 39 55 1.4 34 56 1.7<br />
United States – – – – – – – – – – – – – – – – – – – – –<br />
Uruguay – – – – – – – – – – – – – – – – – – – – –<br />
Uzbekistan 100 100 1.0 100 x 100 x 1.0 x 5 x 3 x 1.5 x – – – 94 x 96 x 1.0 x 25 x 33 x 1.3 x – – –<br />
Vanuatu 13 41 3.1 55 90 1.6 12 10 1.2 – – – 74 76 1.0 9 23 2.7 – – –<br />
Venezuela<br />
(Bolivarian Republic of) 87 x 95 x 1.1 x 95 x 92 x 1.0 x – – – 39 x 55 x 1.4 x 86 x 99 x 1.2 x – – – – – –<br />
Viet Nam 87 98 1.1 72 99 1.4 21 3 6.6 – – – 95 99 1.0 38 68 1.8 – – –<br />
Yemen 5 50 9.3 17 x 74 x 4.3 x – – – 31 x 37 x 1.2 x 44 x 73 x 1.6 x 0 x 4 x – – – –<br />
Zambia 5 31 5.8 27 91 3.4 16 11 1.5 61 61 1.0 73 96 1.3 24 48 2.0 24 51 2.1<br />
Zimbabwe 35 75 2.1 48 91 1.9 – – – 18 28 1.6 84 91 1.1 31 x 52 x 1.7 x 37 x 51 x 1.4 x<br />
MEMORANDUM<br />
Sudan and South Sudan s – – – – – – – – – – – – – – – – – – – – –<br />
SUMMARY INDICATORS #<br />
Sub-Saharan Africa 25 60 2.4 27 82 3.0 30 12 2.5 27 42 1.5 53 80 1.5 16 36 2.2 22 45 2.0<br />
Eastern and<br />
Southern Africa 23 50 2.2 28 77 2.7 26 12 2.2 34 44 1.3 62 86 1.4 – – – – – –<br />
West and Central Africa 26 65 2.5 28 88 3.1 31 11 2.7 21 42 2.0 43 73 1.7 10 30 3.0 17 38 2.2<br />
Middle East and<br />
North Africa – – – – – – – – – – – – – – – – – – – – –<br />
South Asia 23 63 2.7 22 82 3.7 55 19 2.8 29 46 1.6 – – – 4 44 11.7 15 55 3.8<br />
East Asia and the Pacific 48 ** 89 ** 1.9 ** 54 ** 92 ** 1.7 ** 24 ** 10 ** 2.5 ** 36 ** 41 ** 1.1 ** – – – 14 ** 35 ** 2.4 ** – – –<br />
Latin America<br />
and Caribbean – – – – – – – – – – – – – – – – – – – – –<br />
CEE/CIS 94 98 1.0 – – – – – – – – – – – – – – – – – –<br />
Least developed countries 25 52 2.1 30 78 2.6 33 15 2.3 40 47 1.2 61 83 1.4 – – – – – –<br />
World 32 ** 68 ** 2.1 ** 31 ** 85 ** 2.7 ** 39 ** 14 ** 2.7 ** 29 ** 44 ** 1.5 ** – – – – – – – – –<br />
s Due to the cession in July 2011 of the Republic of South Sudan by the Republic of the Sudan, and its subsequent admission to the United Nations on 14 July 2011, disaggregated data for the Sudan<br />
and South Sudan as separate States are not yet available for all indicators. Aggregated data presented are for the Sudan pre-cession (see Memorandum item).<br />
# For a complete list of countries and areas in the regions, subregions and country categories, see page 98.<br />
DEFINITIONS OF THE INDICATORS<br />
Birth registration – Percentage of children under age 5 who were registered<br />
at the moment of the survey. This includes children whose birth certificate was<br />
seen by the interviewer or whose mother or caretaker says the birth has been<br />
registered.<br />
Skilled attendant at birth – Percentage of births attended by skilled health<br />
personnel (doctor, nurse or midwife).<br />
Underweight prevalence in children under 5 – Percentage of children<br />
under age 5 who are below minus two standard deviations from median weightfor-age<br />
of the World Health Organization (WHO) Child Growth Standards.<br />
Diarrhoea treatment <strong>with</strong> oral rehydration salts (ORS) – Percentage<br />
of children under age 5 who had diarrhoea in the two weeks preceding the<br />
survey and who received oral rehydration salts (ORS packets or pre-packaged<br />
ORS fluids).<br />
Primary school net attendance ratio – Number of children attending<br />
primary or secondary school who are of official primary school age, expressed<br />
as a percentage of the total number of children of official primary school age.<br />
Because of the inclusion of primary-school-aged children attending secondary<br />
school, this indicator can also be referred to as a primary adjusted net<br />
attendance ratio.<br />
Comprehensive knowledge of HIV – Percentage of young men and women<br />
(aged 15–24) who correctly identify the two major ways of preventing the<br />
sexual transmission of HIV (using condoms and limiting sex to one faithful,<br />
uninfected partner), who reject the two most common local misconceptions<br />
about HIV transmission and who know that a healthy-looking person can be<br />
HIV-positive.<br />
Underweight prevalence<br />
in children under 5 (%)<br />
2007–2011*<br />
richest<br />
20%<br />
ratio of<br />
poorest to poorest<br />
richest 20%<br />
TABLE 13 dISpARITIES By HOuSEHOLd WEALTH<br />
Diarrhoea treatment<br />
<strong>with</strong> oral rehydration<br />
salts (ORS) (%)<br />
2007−2012*<br />
richest<br />
20%<br />
ratio of<br />
richest to poorest<br />
poorest 20%<br />
Primary school net<br />
attendance ratio<br />
2007−2011*<br />
richest<br />
20%<br />
ratio of<br />
richest to poorest<br />
poorest 20%<br />
Comprehensive<br />
knowledge of HIV<br />
(%) Females 15−24<br />
2007−2011*<br />
Comprehensive<br />
knowledge of HIV<br />
(%) Males 15−24<br />
2007−2011*<br />
MAIN DATA SOURCES<br />
Birth registration – Demographic and Health Surveys (DHS), Multiple Indicator Cluster Surveys (MICS), other<br />
national surveys and vital registration systems.<br />
Skilled attendant at birth – DHS, MICS and other nationally representative sources.<br />
Underweight prevalence in children under 5 – DHS, MICS, other national household surveys, WHO<br />
and UNICEF.<br />
Diarrhoea treatment <strong>with</strong> oral rehydration salts (ORS) – DHS, MICS and other national household surveys.<br />
Primary school attendance – DHS, MICS and other national household surveys.<br />
Comprehensive knowledge of HIV – AIDS Indicator Surveys (AIS), DHS, MICS and other national household<br />
surveys; HIV/AIDS Survey Indicators Database, .<br />
Italicized disparity data are from different sources than the data for the same indicators presented<br />
elsewhere in the report: Table 2 (Nutrition – Underweight prevalence), Table 3 (Health – Diarrhoea<br />
treatment), Table 4 (HIV/AIDS – Comprehensive knowledge of HIV) and Table 8 (Women – Skilled<br />
attendant at birth).<br />
NOTES<br />
− Data not available.<br />
x Data refer to years or periods other than those specified in the column heading. Such data are not included in<br />
the calculation of regional and global averages, <strong>with</strong> the exception of 2005–2006 data from India. Estimates<br />
from data years prior to 2000 are not displayed.<br />
y Data differ from the standard definition or refer to only part of a country. If they fall <strong>with</strong>in the noted<br />
reference period, such data are included in the calculation of regional and global averages.<br />
* Data refer to the most recent year available during the period specified in the column heading.<br />
** Excludes China.<br />
richest<br />
20%<br />
ratio of<br />
richest to poorest<br />
poorest 20%<br />
richest<br />
20%<br />
ratio of<br />
richest to<br />
poorest<br />
STATISTICAL TABLES 151
TABLE 14: EARLy CHILdHOOd dEVELOpmENT<br />
Countries<br />
and areas<br />
Afghanistan 1 1 1 0 4 73 74 73 72 80 62 2 1 5 53 52 57 40 42 39 43 27<br />
Albania 40 39 42 26 60 86 85 87 68 96 53 32 16 52 53 57 48 13 14 11 9 16<br />
Bangladesh 15 14 15 11 16 61 61 60 42 85 53 – – – – – – – – – – –<br />
Belarus 86 87 85 – – 97 97 96 95 98 72 – – – – – – – – – – –<br />
Belize 32 30 34 16 59 86 88 83 73 94 50 40 17 73 57 55 58 2 3 2 4 1<br />
Bhutan 10 10 10 3 27 54 52 57 40 73 51 6 1 24 52 36 60 14 13 15 17 7<br />
Bosnia and Herzegovina 6 5 8 1 15 83 83 83 74 90 74 70 52 88 43 49 43 7 7 6 6 10<br />
Botswana 18 – – – – – – – – – – – – – – – – – – – – –<br />
Burkina Faso 2 3 1 0 9 14 14 14 12 26 24 – – – – – – – – – – –<br />
Burundi 5 5 5 4 10 34 35 34 32 38 20 – – – – – – – – – – –<br />
Cameroon 22 22 22 3 56 58 57 59 57 69 39 8 3 22 57 62 46 36 36 36 45 25<br />
Central African Republic 5 5 6 2 17 74 74 74 70 78 42 1 0 3 49 41 51 61 60 62 58 60<br />
Chad 5 5 4 1 16 70 69 70 64 71 29 1 0 2 43 38 50 56 57 56 58 56<br />
Côte d’Ivoire 6 5 6 1 24 50 50 51 55 57 40 5 3 13 39 44 35 59 60 58 62 51<br />
Democratic People’s<br />
Republic of Korea<br />
Democratic Republic<br />
98 98 97 – – 91 88 93 – – 75 79 – – 47 – – 17 17 16 – –<br />
of the Congo 5 5 5 2 18 61 61 62 62 76 36 1 0 2 29 21 40 60 60 60 69 39<br />
Djibouti 14 12 16 – – 36 36 35 – – 23 15 – – 24 – – 12 11 13 – –<br />
Gambia 18 17 19 13 33 48 49 47 50 56 21 1 0 5 42 29 49 21 22 19 25 18<br />
Georgia 43 44 42 17 70 93 93 93 85 99 61 72 48 91 38 41 41 8 8 8 7 8<br />
Ghana 68 65 72 42 97 40 38 42 23 78 30 6 1 23 41 31 51 21 21 21 27 15<br />
Guinea-Bissau 10 10 10 4 26 – – – – – – – – – – – – – – – – –<br />
Guyana 49 48 50 33 78 89 88 89 77 99 52 54 28 86 65 67 60 11 13 10 19 6<br />
Iraq 3 2 3 – – 58 59 57 – – 60 – – – – – – – – – – –<br />
Jamaica 86 84 88 – – 94 95 93 – – 41 57 – – 71 – – 4 4 3 – –<br />
Kazakhstan 37 36 38 19 61 92 92 91 84 96 49 48 24 76 45 40 49 4 4 4 5 4<br />
Kyrgyzstan<br />
Lao People’s Democratic<br />
19 21 17 7 47 88 90 85 86 99 54 76 76 85 57 59 54 11 12 9 11 6<br />
Republic 7 8 7 1 44 33 33 34 20 59 24 3 1 11 57 54 40 26 26 25 33 17<br />
Lebanon 62 63 60 – – 56 y 58 y 54 y – – 74 y 29 – – 16 y – – 9 8 10 – –<br />
Mali 10 10 10 1 40 29 27 30 28 44 14 0 0 2 40 33 49 33 33 33 33 36<br />
Mauritania 5 5 5 2 11 48 48 47 39 64 30 – – – – – – – – – – –<br />
Mongolia 60 58 61 26 83 59 56 62 44 73 41 23 6 48 68 74 62 9 9 8 10 6<br />
Montenegro 29 28 30 6 62 97 96 98 88 100 79 77 50 92 39 49 33 6 8 5 11 3<br />
Morocco 39 36 41 6 78 48 y 47 y 49 y 35 y 68 y 56 y 21 y 9 y 52 y 14 y 19 y 7 y 9 9 9 11 6<br />
Mozambique – – – – – 47 45 48 48 50 20 3 2 10 – – – 33 33 32 – –<br />
Myanmar 23 23 23 8 46 58 y 58 y 58 y 42 y 76 y 44 y – – – – – – – – – – –<br />
Nepal 30 y 29 y 31 y 14 y 61 y – – – – – – – – – – – – – – – – –<br />
Nigeria 32 32 32 5 70 78 78 78 68 91 38 14 2 35 35 25 42 38 38 37 41 32<br />
Sao Tome and Principe 27 29 26 18 51 – – – – – – – – – – – – – – – – –<br />
Senegal 22 y 23 y 21 y 7 y 43 y – – – – – – – – – – – – – – – – –<br />
Serbia 44 41 47 22 75 95 96 95 84 98 78 76 49 86 63 65 60 1 1 1 2 1<br />
Sierra Leone 14 13 15 5 42 54 53 55 45 79 42 2 0 10 35 24 50 32 33 32 29 28<br />
Somalia 2 2 2 1 6 79 80 79 76 85 48 – – – – – – – – – – –<br />
South Sudan 6 6 6 2 13 – – – – – – – – – – – – – – – – –<br />
Sudan 20 20 21 10 48 – – – – – – – – – – – – – – – – –<br />
Suriname 39 37 40 17 63 75 75 76 61 92 31 45 20 75 64 67 63 7 6 8 13 1<br />
Swaziland 33 32 34 36 50 50 50 50 35 71 10 4 1 12 69 64 74 15 15 15 20 9<br />
Syrian Arab Republic 8 8 7 4 18 70 70 69 52 84 62 30 12 53 52 52 51 17 17 17 22 15<br />
Tajikistan 10 11 10 1 29 74 73 74 56 86 23 17 4 33 46 43 44 13 13 12 15 11<br />
Thailand<br />
The former Yugoslav<br />
61 60 61 55 78 89 90 89 86 98 57 43 25 71 55 58 49 13 14 13 18 7<br />
Republic of Macedonia 22 25 19 0 59 92 92 91 81 97 71 52 19 83 71 70 79 5 5 5 10 1<br />
152<br />
Attendance in early childhood education<br />
2005–2011*<br />
Adult support for learning ++<br />
2005–2011*<br />
Father’s<br />
support for<br />
Learning materials at home<br />
2005−2011*<br />
<strong>Children</strong>’s books Playthings++<br />
<strong>Children</strong> left in inadequate care<br />
2005−2011*<br />
poorest richest<br />
poorest richest learning ++ poorest richest poorest richest<br />
poorest richest<br />
total male female 20% 20% total male female 20% 20% 2005–2011* total 20% 20% total 20% 20% total male female 20% 20%<br />
THE STATE OF THE WORLD’S CHILDREN 2013: <strong>Children</strong> <strong>with</strong> <strong>Disabilities</strong>
Countries<br />
and areas<br />
Togo 29 27 31 10 52 62 61 63 55 68 38 2 0 7 31 26 41 41 42 41 45 35<br />
Trinidad and Tobago 75 74 76 65 87 98 98 98 96 100 63 81 66 93 65 63 72 1 1 1 2 0<br />
Ukraine 63 63 63 30 74 – – – – – – 97 93 99 47 36 47 10 11 10 15 4<br />
Uzbekistan 20 20 19 5 46 91 91 90 83 95 54 43 32 59 67 74 62 5 5 5 6 7<br />
Viet Nam 72 71 73 59 91 77 74 80 63 94 61 20 3 49 49 41 54 9 10 9 17 4<br />
Yemen 3 3 3 0 8 33 34 32 16 56 37 10 4 31 49 45 49 34 36 33 46 22<br />
SUMMARY INDICATORS #<br />
Sub-Saharan Africa 21 21 21 6 47 – – – – – – – – – – – – – – – – –<br />
Eastern and<br />
Southern Africa – – – – – – – – – – – – – – – – – – – – – –<br />
West and Central Africa<br />
Middle East<br />
22 22 23 6 49 63 63 63 57 77 35 8 1 21 36 29 43 43 43 43 47 34<br />
and North Africa – – – – – – – – – – – – – – – – – – – – – –<br />
South Asia – – – – – – – – – – – – – – – – – – – – – –<br />
East Asia and Pacific<br />
Latin America<br />
– – – – – – – – – – – – – – – – – – – – – –<br />
and Caribbean – – – – – – – – – – – – – – – – – – – – – –<br />
CEE/CIS – – – – – – – – – – – – – – – – – – – – – –<br />
Least developed countries 11 11 12 6 24 – – – – – – – – – – – – – – – – –<br />
World – – – – – – – – – – – – – – – – – – – – – –<br />
# For a complete list of countries and areas in the regions, subregions and country categories, see page 98.<br />
DEFINITIONS OF THE INDICATORS<br />
Attendance in early childhood education – Percentage of children 36–59 months old who<br />
are attending an early childhood education programme.<br />
Adult support for learning – Percentage of children 36–59 months old <strong>with</strong> whom an adult<br />
has engaged in four or more of the following activities to promote learning and school readiness<br />
in the past three days: a) reading books to the child, b) telling stories to the child, c) singing<br />
songs to the child, d) taking the child outside the home, e) playing <strong>with</strong> the child and f) naming,<br />
counting or drawing things <strong>with</strong> the child.<br />
Father’s support for learning – Percentage of children 36–59 months old whose father has<br />
engaged in one or more of the following activities to promote learning and school readiness<br />
in the past three days: a) reading books to the child, b) telling stories to the child, c) singing<br />
songs to the child, d) taking the child outside the home, e) playing <strong>with</strong> the child and f) naming,<br />
counting or drawing things <strong>with</strong> the child.<br />
Learning materials at home: children’s books – Percentage of children 0–59 months old<br />
who have three or more children’s books at home.<br />
Learning materials at home: playthings – Percentage of children 0–59 months old <strong>with</strong> two<br />
or more of the following playthings at home: household objects or objects found outside (sticks,<br />
rocks, animals, shells, leaves, etc.), homemade toys or toys that came from a store.<br />
<strong>Children</strong> left in inadequate care – Percentage of children 0–59 months old left alone or in<br />
the care of another child younger than 10 years of age for more than one hour at least once in<br />
the past week.<br />
TABLE 14 EARLy CHILdHOOd dEVELOpmENT<br />
Attendance in early childhood education<br />
2005–2011*<br />
Adult support for learning ++<br />
2005–2011*<br />
Father’s<br />
support for<br />
Learning materials at home<br />
2005−2011*<br />
<strong>Children</strong>’s books Playthings++<br />
<strong>Children</strong> left in inadequate care<br />
2005−2011*<br />
poorest richest<br />
poorest richest learning ++ poorest richest poorest richest<br />
poorest richest<br />
total male female 20% 20% total male female 20% 20% 2005–2011* total 20% 20% total 20% 20% total male female 20% 20%<br />
MAIN DATA SOURCES<br />
Attendance in early childhood education – Multiple Indicator Cluster Surveys (MICS),<br />
Demographic and Health Surveys (DHS) and other national surveys.<br />
Adult support for learning – MICS and other national surveys.<br />
Father’s support for learning – MICS and other national surveys.<br />
Learning materials at home: children’s books – MICS and other national surveys.<br />
Learning materials at home: playthings – MICS and other national surveys.<br />
<strong>Children</strong> left in inadequate care – MICS and other national surveys.<br />
NOTES<br />
– Data not available.<br />
y Data differ from the standard definition or refer to only part of a country. If they fall <strong>with</strong>in the<br />
noted reference period, such data are included in the calculation of regional and global averages.<br />
* Data refer to the most recent year available during the period specified in the column heading.<br />
++ Changes in the definitions of several ECD indicators were made between the third and fourth<br />
rounds of MICS (MICS3 and MICS4). In order to allow for comparability <strong>with</strong> MICS4, data from<br />
MICS3 for the adult support for learning, father’s support for learning and learning materials<br />
at home (playthings) indicators were recalculated according to MICS4 indicator definitions.<br />
Therefore, the recalculated data presented here will differ from estimates reported in MICS3<br />
national reports.<br />
STATISTICAL TABLES 153
Conventions, optional protocols,<br />
signatures and ratifications<br />
A note on terms used in this report<br />
A Convention is a formal agreement between States parties. The term ‘Convention’ is used (rather than its<br />
synonym, ‘treaty’) to denote a multilateral instrument <strong>with</strong> a large number of States parties, including one<br />
open to participation by the international community as a whole and negotiated under the auspices of an<br />
international organization.<br />
An Optional protocol to a Convention is a legal instrument intended to supplement the original agreement<br />
by establishing additional rights or obligations. It may be used to address in greater detail a matter<br />
mentioned in the original agreement, to speak to a new concern relevant to any of its topics, or to add<br />
procedures for operation or enforcement. Such a protocol is optional in the sense that States parties to a<br />
Convention are not automatically bound by its provisions, but must ratify it independently. Thus, a State<br />
may be party to a Convention but not to its Optional Protocols.<br />
The process by which a State becomes party to a Convention comprises, in most cases, two steps:<br />
signature and ratification.<br />
By signing a Convention, a State indicates its intention to take steps to examine the Convention and<br />
its compatibility <strong>with</strong> domestic law. A signature does not create a legal obligation to be bound by a<br />
Convention’s provisions; however, it does indicate that a State will act in good faith and will not take<br />
actions that would undermine the purpose of the Convention.<br />
Ratification is the concrete action by which a State agrees to be legally bound by the terms of a<br />
Convention. The procedure varies according to each country’s particular legislative structure. After a<br />
State has determined that a Convention is consistent <strong>with</strong> domestic laws and that steps may be taken to<br />
comply <strong>with</strong> its provisions, the appropriate national organ (e.g., a parliament) makes a formal decision<br />
to ratify. Once the instrument of ratification – a formal, sealed letter signed by the responsible authority<br />
(e.g., a president) – is deposited <strong>with</strong> the United Nations Secretary-General, the State becomes party to<br />
the Convention.<br />
In some cases, a state will accede to a Convention or Optional Protocol. Essentially, accession is like<br />
ratifying <strong>with</strong>out first having to sign.<br />
For further information and more detailed definitions of these and related terms, see<br />
.<br />
The Convention on the Rights of Persons <strong>with</strong> <strong>Disabilities</strong> is available at<br />
.<br />
The Optional Protocol is available at .<br />
154<br />
THE STATE OF THE WORLD’S CHILDREN 2013: <strong>Children</strong> <strong>with</strong> <strong>Disabilities</strong>
UNICEF Headquarters<br />
UNICEF House<br />
3 United Nations Plaza<br />
New York, NY 10017, USA<br />
UNICEF Regional Office for Europe<br />
Palais des Nations<br />
CH-1211 Geneva 10, Switzerland<br />
UNICEF Central and Eastern Europe/<br />
Commonwealth of Independent<br />
States Regional Office<br />
Palais des Nations<br />
CH-1211 Geneva 10, Switzerland<br />
UNICEF Eastern and Southern Africa<br />
Regional Office<br />
P.O. Box 44145<br />
Nairobi, Kenya 00100<br />
UNICEF West and Central Africa<br />
Regional Office<br />
P.O. Box 29720, Yoff<br />
Dakar, Senegal<br />
UNICEF Latin America and<br />
the Caribbean Regional Office<br />
P.O. Box 0843-03045<br />
Panama City, Panama<br />
UNICEF East Asia and Pacific<br />
Regional Office<br />
P.O. Box 2-154<br />
Bangkok 10200, Thailand<br />
UNICEF Middle East and North Africa<br />
Regional Office<br />
P.O. Box 1551<br />
Amman 11821, Jordan<br />
UNICEF South Asia Regional Office<br />
P.O. Box 5815<br />
Lekhnath Marg<br />
Kathmandu, Nepal
United Nations <strong>Children</strong>’s Fund<br />
3 United Nations Plaza<br />
New York, NY 10017, USA<br />
Email: pubdoc@unicef.org<br />
Website: www.unicef.org<br />
XX%<br />
Cert no. XXX-XXX-XXX<br />
To read this report online,<br />
scan this QR code or go to<br />
www.unicef.org/sowc2013<br />
US $25.00<br />
ISBN: 978-92-806-4656-6<br />
eISBN: 978-92-806-4662-7<br />
United Nations publication sales no.: E.13.XX.1<br />
© United Nations <strong>Children</strong>’s Fund (UNICEF)<br />
May 2013