Combining High-Resolution Pulsed TIVA and ... - ASM International
Combining High-Resolution Pulsed TIVA and ... - ASM International
Combining High-Resolution Pulsed TIVA and ... - ASM International

Create successful ePaper yourself
Turn your PDF publications into a flip-book with our unique Google optimized e-Paper software.
ISTFA 2010<br />
Proceedings from the 36th <strong>International</strong> Symposium for Testing <strong>and</strong> Failure Analysis<br />
November 14–18, 2010, Addison, Texas, USA<br />
<strong>Combining</strong> <strong>High</strong>-<strong>Resolution</strong> <strong>Pulsed</strong> <strong>TIVA</strong> <strong>and</strong><br />
Nanoprobing Techniques to Identify Drive<br />
Strength Issues in Mixed-signal Circuits<br />
Ravikumar VK 1 , Ho MY 1 , Goruganthu RR 2 , Phoa SL 1 , Narang V 1 , Chin JM 1<br />
Advanced Micro Devices Singapore Pte Ltd 1 , 508 Chai Chee Lane, Singapore 469032,<br />
Advanced Micro Devices, Inc. 2 , 5900 E Ben White Blvd, Austin TX 78741, USA<br />
Phone: (65) 679698888 Fax: (65) 62339080 Email: venkat-krishnan.ravikumar@amd.com<br />
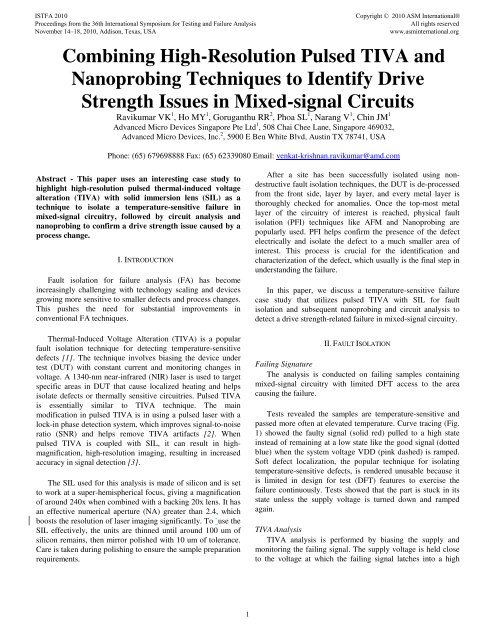
Abstract - This paper uses an interesting case study to<br />
highlight high-resolution pulsed thermal-induced voltage<br />
alteration (<strong>TIVA</strong>) with solid immersion lens (SIL) as a<br />
technique to isolate a temperature-sensitive failure in<br />
mixed-signal circuitry, followed by circuit analysis <strong>and</strong><br />
nanoprobing to confirm a drive strength issue caused by a<br />
process change.<br />
I. INTRODUCTION<br />
Fault isolation for failure analysis (FA) has become<br />
increasingly challenging with technology scaling <strong>and</strong> devices<br />
growing more sensitive to smaller defects <strong>and</strong> process changes.<br />
This pushes the need for substantial improvements in<br />
conventional FA techniques.<br />
Thermal-Induced Voltage Alteration (<strong>TIVA</strong>) is a popular<br />
fault isolation technique for detecting temperature-sensitive<br />
defects [1]. The technique involves biasing the device under<br />
test (DUT) with constant current <strong>and</strong> monitoring changes in<br />
voltage. A 1340-nm near-infrared (NIR) laser is used to target<br />
specific areas in DUT that cause localized heating <strong>and</strong> helps<br />
isolate defects or thermally sensitive circuitries. <strong>Pulsed</strong> <strong>TIVA</strong><br />
is essentially similar to <strong>TIVA</strong> technique. The main<br />
modification in pulsed <strong>TIVA</strong> is in using a pulsed laser with a<br />
lock-in phase detection system, which improves signal-to-noise<br />
ratio (SNR) <strong>and</strong> helps remove <strong>TIVA</strong> artifacts [2]. When<br />
pulsed <strong>TIVA</strong> is coupled with SIL, it can result in highmagnification,<br />
high-resolution imaging, resulting in increased<br />
accuracy in signal detection [3].<br />
The SIL used for this analysis is made of silicon <strong>and</strong> is set<br />
to work at a super-hemispherical focus, giving a magnification<br />
of around 240x when combined with a backing 20x lens. It has<br />
an effective numerical aperture (NA) greater than 2.4, which<br />
boosts the resolution of laser imaging significantly. To `use the<br />
SIL effectively, the units are thinned until around 100 um of<br />
silicon remains, then mirror polished with 10 um of tolerance.<br />
Care is taken during polishing to ensure the sample preparation<br />
requirements.<br />
1<br />
Copyright © 2010 <strong>ASM</strong> <strong>International</strong>®<br />
All rights reserved<br />
www.asminternational.org<br />
After a site has been successfully isolated using nondestructive<br />
fault isolation techniques, the DUT is de-processed<br />
from the front side, layer by layer, <strong>and</strong> every metal layer is<br />
thoroughly checked for anomalies. Once the top-most metal<br />
layer of the circuitry of interest is reached, physical fault<br />
isolation (PFI) techniques like AFM <strong>and</strong> Nanoprobing are<br />
popularly used. PFI helps confirm the presence of the defect<br />
electrically <strong>and</strong> isolate the defect to a much smaller area of<br />
interest. This process is crucial for the identification <strong>and</strong><br />
characterization of the defect, which usually is the final step in<br />
underst<strong>and</strong>ing the failure.<br />
In this paper, we discuss a temperature-sensitive failure<br />
case study that utilizes pulsed <strong>TIVA</strong> with SIL for fault<br />
isolation <strong>and</strong> subsequent nanoprobing <strong>and</strong> circuit analysis to<br />
detect a drive strength-related failure in mixed-signal circuitry.<br />
II. FAULT ISOLATION<br />
Failing Signature<br />
The analysis is conducted on failing samples containing<br />
mixed-signal circuitry with limited DFT access to the area<br />
causing the failure.<br />
Tests revealed the samples are temperature-sensitive <strong>and</strong><br />
passed more often at elevated temperature. Curve tracing (Fig.<br />
1) showed the faulty signal (solid red) pulled to a high state<br />
instead of remaining at a low state like the good signal (dotted<br />
blue) when the system voltage VDD (pink dashed) is ramped.<br />
Soft defect localization, the popular technique for isolating<br />
temperature-sensitive defects, is rendered unusable because it<br />
is limited in design for test (DFT) features to exercise the<br />
failure continuously. Tests showed that the part is stuck in its<br />
state unless the supply voltage is turned down <strong>and</strong> ramped<br />
again.<br />
<strong>TIVA</strong> Analysis<br />
<strong>TIVA</strong> analysis is performed by biasing the supply <strong>and</strong><br />
monitoring the failing signal. The supply voltage is held close<br />
to the voltage at which the failing signal latches into a high
instead of a low state. The analysis showed a strong<br />
disturbance at specific mixed-signal circuitry (Fig. 2).<br />
Fig.1: Curve tracing shows that the bad signal was abnormally<br />
pulled high during power supply ramp.<br />
2(a) 2(b)<br />
Fig. 2(a): Conventional <strong>TIVA</strong> image; 2(b) is the overlay image.<br />
Streaking makes it impossible to isolate the failing circuitry.<br />
The high sensitivity of the circuit to laser effects caused<br />
streaking, <strong>and</strong> a change of state in the <strong>TIVA</strong> image in Fig. 2<br />
made it difficult to isolate the actual part of the circuitry that is<br />
sensitive. To obtain a better isolation, pulsed <strong>TIVA</strong> (Fig. 3) is<br />
used which showed improvements over conventional <strong>TIVA</strong>.<br />
3(a) 3(b)<br />
Fig. 3(a): <strong>Pulsed</strong> <strong>TIVA</strong> image; 3(b) is the overlay image.<br />
Streaking is substantially reduced.<br />
Using pulsed <strong>TIVA</strong>, the laser is pulsed <strong>and</strong> using phase<br />
lock detection, the streaks are effectively reduced to enable<br />
2<br />
isolation of the actual circuits that are sensitive to laser<br />
stimulation (Fig. 3). To improve the isolation further, the<br />
supply voltages are tweaked <strong>and</strong> the bad signal is monitored<br />
through an oscilloscope when pulsed <strong>TIVA</strong> is performed.<br />
The laser power is also reduced substantially to cause<br />
minimum artifacts. As seen in Fig. 4(a), the number of <strong>TIVA</strong><br />
sites decreased to one, which correlated well to the failing<br />
signature. Fig. 4(b) is a snapshot while the laser scanned the<br />
sensitive circuitry. A dip in the voltage is observed at the<br />
location highlighted by pulsed <strong>TIVA</strong>.<br />
However, the pulsed <strong>TIVA</strong> overlay image still pointed to<br />
multiple instances in the area of interest that could potentially<br />
cause the failure. The magnification is not high enough to<br />
isolate the circuitry to a particular instance.<br />
4(a) 4(b)<br />
Fig. 4(a): <strong>Pulsed</strong> <strong>TIVA</strong> image with reduced laser power <strong>and</strong><br />
optimized supply; 4(b) is the oscilloscope monitor of signal.<br />
The unit is further thinned for imaging using the SIL, which<br />
provides a magnification improvement of a 2.5x in addition to<br />
a 5x resolution improvement compared to the state-of-the-art<br />
air-gap lens. When combining pulsed <strong>TIVA</strong> with SIL, a higher<br />
resolution image <strong>and</strong> more accurate fault isolation results are<br />
obtained (Fig. 5).<br />
5(a) 5(b)<br />
Fig. 5(a): Image of the pulsed <strong>TIVA</strong> with SIL overlay; 5(b) is<br />
the overlay of pulsed <strong>TIVA</strong> on digitally zoomed <strong>and</strong> cropped 0.85-<br />
NA 100x air-gap lens.
This is evident when comparing Fig. 5(b), a digitally zoomed<br />
overlay image obtained using a 0.85-NA 100x NIR lens, to<br />
Fig. 5(a), the overlay image obtained by using a SIL in superhemispherical<br />
mode <strong>and</strong> a 20x NIR backing lens.<br />
Circuit Analysis<br />
The CAD navigation tool showed that the site highlighted<br />
by pulsed <strong>TIVA</strong> with SIL pointed to a particular transistor. On<br />
circuit analysis <strong>and</strong> layout tracing, it is unambiguous that the<br />
<strong>TIVA</strong> signal came from an input to a level restorer circuit that<br />
fed to the failing signal (Fig. 6).<br />
Fig. 6: Block diagram of circuitry of interest. Circled transistor<br />
T1 is highlighted by high-resolution pulsed <strong>TIVA</strong>.<br />
Transistor T1, a PMOSFET, is the input of a level restorer<br />
circuitry made up of two inverters: the larger D1, which feeds<br />
forward, <strong>and</strong> the smaller D2, which helps to hold the state. A<br />
wrong input from either a leaky or a slow PMOS T1 could<br />
change the state of the restorer, causing the signal to flip <strong>and</strong><br />
the reported failure. The level restorer is powered by the<br />
voltage supplies VDD1 <strong>and</strong> VDD2, which also supported the<br />
observed failure.<br />
III. Physical Failure Analysis<br />
PFI <strong>and</strong> PFA approach<br />
As mentioned earlier, with technology scaling of ICs, nonvisible<br />
defects have become common phenomena in FA. On<br />
top of this challenge, the electrical failure signature for many<br />
of the failures is soft, as presented in this study. Therefore, the<br />
utilization of non-destructive PFI is essential to indicate the<br />
exact failing location before attempting PFA. This section<br />
demonstrates the successful use of nanoprobing to reveal faults<br />
in the level restorer. The theory of nanoprobing [4] has been<br />
adequately described in the literature.<br />
This study used a scanning electron microscope (SEM)based<br />
nanoprobing system. This system provides the capability<br />
of maneuvering the probe tips by nanometer range to l<strong>and</strong><br />
exactly on top of the individual source, drain, <strong>and</strong> gate<br />
tungsten contact (Fig. 7). The SEM provides a high-resolution<br />
real-time image that facilitates locating the device <strong>and</strong> placing<br />
3<br />
the probe tips. The SEM is operated at 1 keV to ensure there is<br />
no transistor degradation [5].<br />
Based on the level restorer layout <strong>and</strong> information from<br />
electrical fault isolation described in Section II, our first<br />
approach was to perform layer-by-layer inspection using SEM.<br />
This traditional PFA technique failed to reveal any obvious<br />
anomalies from metal 4 down to contact level. This is not<br />
surprising, since this is a temperature-sensitive failure (soft<br />
failure).<br />
Fig. 7: SEM image (right) showing three tungsten probes (black<br />
arrows) l<strong>and</strong>ing on tungsten contacts of the NMOS transistor in the<br />
inverter image on the left.<br />
With the individual transistor isolated at contact level,<br />
nanoprobing is the one of the best way to obtain full-transistor<br />
electrical characterization. Families of current versus voltage<br />
(I/V) curves are collected on multiple transistors on the good<br />
<strong>and</strong> failing level restorer. Basic transistor parameters such as<br />
threshold voltage (Vt), saturation drive current (Isat), <strong>and</strong> N/P<br />
ratio can be extracted with ease. N/P ratio is the value of Nchannel<br />
Isat divided by P-channel Isat. A higher N/P ratio means<br />
the NMOS drive strength is higher than the PMOS drive<br />
strength. Mixed-signal circuits need tight control of this ratio<br />
since they operate in the analog domain of the IV curve.<br />
Data analysis<br />
There are five PMOS <strong>and</strong> five NMOS transistors in each<br />
level restorer identified as the failing circuit during fault<br />
isolation, four of those inverters in parallel <strong>and</strong> grouped into<br />
D1 in Fig. 6 while the last one, D2, is used to hold the state of<br />
the restorer like a latch.<br />
Fig. 8(a) shows the one of the five PMOS IDSAT curves<br />
obtained from the failing <strong>and</strong> good level restorer with the gate<br />
voltage set at -1V. Almost 20% deviation is observed in the<br />
drive current of the good <strong>and</strong> bad PMOS transistor, with the<br />
bad circuitry showing lower drive strength. Fig. 8(b) shows the<br />
NMOS IDSAT curve with the gate voltage at 1V. The NMOS<br />
transistor does not show a significant deviation between the<br />
good <strong>and</strong> bad curves.
Fig. 8(a): PMOS transistor in the failing site exhibits 20-30%<br />
lower drive current (see comparison red line) compared to the good<br />
level restorer.<br />
Fig. 8(b): NMOS transistor in the failing site shows comparable<br />
drive current compared to the good level restorer.<br />
This measurement is repeated in the other four PMOS <strong>and</strong><br />
NMOS transistors, which showed a similar response of lower<br />
PMOS drive strength. It is therefore obvious that the failing<br />
area exhibited weak PMOS I/V characteristics with acceptable<br />
NMOS characteristics. This, in turn, drove the N/P ratio of the<br />
bad transistors significantly higher than the good transistors.<br />
To validate this result, a similar experiment is conducted on a<br />
second bad DUT (not shown here), <strong>and</strong> the results are found to<br />
be repeatable.<br />
Defect Identification<br />
After the exact failing transistor is successfully identified<br />
using nanoprobing, defect identification techniques like<br />
focused ion beam (FIB) <strong>and</strong> scanning tunneling electron<br />
microscopy (STEM) are used, but revealed no physical<br />
defects. A transmission electron microscopy (TEM) sample is<br />
then prepared to underst<strong>and</strong> the low drive current behavior.<br />
The result of TEM, however, revealed no defects, <strong>and</strong><br />
construction analysis did not show any difference between<br />
good <strong>and</strong> bad transistors. While TEM is a proven powerful<br />
tool in FA [6], it has some shortcomings, like the difficulty of<br />
quantifying the extent of implantation.<br />
4<br />
With the feedback of drive strength non-conformance <strong>and</strong><br />
the lack of physical defects, the fabrication facility had<br />
increased confidence in its identification of the failure<br />
mechanism, <strong>and</strong> it corrected the process to increase the drive<br />
strength of the PMOS transistor, resulting in a 100% fix.<br />
IV. Conclusion<br />
This paper discussed the creative use of pulsed <strong>TIVA</strong> with<br />
SIL to obtain increased sensitivity <strong>and</strong> resolution during static<br />
fault isolation. This is the first report of this technique being<br />
applied to mixed-signal circuitry to detect drive strength- <strong>and</strong><br />
N-P ratio-related failure mechanisms. Fig. 5 clearly highlight<br />
of the capabilities of this technique.<br />
A fault isolation image that resulted from the combination<br />
of pulsed <strong>TIVA</strong> with SIL resulted in faster identification of the<br />
root cause <strong>and</strong>, therefore, its fix. The paper also highlights the<br />
importance of nanoprobing to identify non-visual defects <strong>and</strong><br />
characterize the electrical performance of circuits.<br />
V. References<br />
[1] Phang, JCH et al., “A Review of Laser Induced<br />
Techniques for Microelectronic Failure Analysis,” Proc<br />
Int Symp Physical & Failure Analysis of Integrated<br />
Circuits (IPFA 2004), 5-8 Jul 04, pp. 255-261, 2004.<br />
[2] Phang, JCH et al., "<strong>Resolution</strong> <strong>and</strong> Sensitivity<br />
Enhancements of Scanning Optical Microscopy<br />
Techniques for Integrated Circuit Failure Analysis,” Int<br />
Symp Physical <strong>and</strong> Failure Analysis of Integrated Circuits<br />
(IPFA 2009), 6-10 Jul 09, pp. 11-18, 2009.<br />
[3] Quah, ACT et al., “<strong>Combining</strong> Refractive Solid<br />
Immersion Lens <strong>and</strong> <strong>Pulsed</strong> Laser Induced Techniques for<br />
Effective Defect Localization on Microprocessors,” Proc<br />
<strong>International</strong> Symposium for Testing & Failure Analysis<br />
2008, pp. 402-406.<br />
[4] Faure, D <strong>and</strong> Waggoner, CA, “A New Sub-micron<br />
Probing Technique for Failure Analysis in Integrated<br />
Circuits,” ESREF 2002.<br />
[5] Mizuno, T et al., “Maximum Permissible EB Acceleration<br />
Voltage for SEM-Based Inspection before Electrical<br />
Characterization of Advanced MOS,” IEEE 45th Annual<br />
<strong>International</strong> Reliability 2007.<br />
[6] Williams, DB <strong>and</strong> Carter, CB, Transmission Electron<br />
Microscopy: A Textbook for Materials Science, Vols. 1-4<br />
(Plenum Press, New York, 1996).