Benoit Palmieri and David Ronis, Diffusion in ... - McGill University
Benoit Palmieri and David Ronis, Diffusion in ... - McGill University
Benoit Palmieri and David Ronis, Diffusion in ... - McGill University

You also want an ePaper? Increase the reach of your titles
YUMPU automatically turns print PDFs into web optimized ePapers that Google loves.
<strong>Diffusion</strong> <strong>in</strong> Channeled Structures J. Phys. Chem. B, Vol. 109, No. 45, 2005 21337<br />
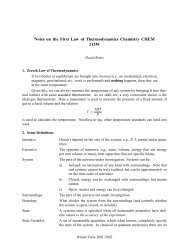
Figure 3. Potential of mean force along the reaction coord<strong>in</strong>ate (Paths<br />
1 <strong>and</strong> 2 <strong>in</strong> Figure 2), shown as the full l<strong>in</strong>e. The dashed l<strong>in</strong>e shows the<br />
potential of mean force for a reaction coord<strong>in</strong>ate that connects different<br />
channels, compare to Figure 2. The saddle po<strong>in</strong>t at “X” is <strong>in</strong>dicated <strong>in</strong><br />
Figure 2. The rate constants used <strong>in</strong> TST, compare to eq 4.1, are also<br />
<strong>in</strong>dicated at the two saddle po<strong>in</strong>ts 1 <strong>and</strong> 2.<br />
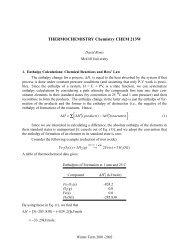
Figure 4. Plane average potential of mean force. The temperatures<br />
are, start<strong>in</strong>g with the bottom curve, T ) 100, 300, <strong>and</strong> 800 K.<br />
with the channel only at 41.0kBT. Hence, the channels will<br />
behave as if they are disconnected, at least at 100 <strong>and</strong> 300 K.<br />
Also shown <strong>in</strong> Figure 2 is the high energy reaction coord<strong>in</strong>ate<br />
that connects neighbor<strong>in</strong>g channels <strong>and</strong> whose saddle po<strong>in</strong>t is<br />
<strong>in</strong>dicated by an “X”.<br />
The plane average potentials of mean force, W(z), at the<br />
temperatures of <strong>in</strong>terest are shown <strong>in</strong> Figure 4. Note the<br />
significant <strong>in</strong>crease with temperature <strong>in</strong> the absolute potential<br />
of mean force, a feature we did not observe <strong>in</strong> I. On the other<br />
h<strong>and</strong>, the activation energy, obta<strong>in</strong>ed from W(z), for the<br />
<strong>in</strong>dividual hops between the b<strong>in</strong>d<strong>in</strong>g sites, decreases, albeit very<br />
slightly, with an <strong>in</strong>crease <strong>in</strong> temperature.<br />
B. Permeabilities. The first step <strong>in</strong> calculat<strong>in</strong>g the permeabilities,<br />
P′, is to obta<strong>in</strong> the time-correlations functions appear<strong>in</strong>g<br />
<strong>in</strong> eq 2.4. This was done by simulat<strong>in</strong>g eqs 2.5 <strong>and</strong> 2.6 with a<br />
second-order stochastic Runge-Kutta <strong>in</strong>tegrator. 17 The required<br />
correlation functions at any <strong>in</strong>itial guest position were obta<strong>in</strong>ed<br />
from an ensemble average of 2000 trajectories. Each of the<br />
trajectories was “aged”, keep<strong>in</strong>g the guest frozen while the lattice<br />
equilibrated. The ag<strong>in</strong>g <strong>and</strong> runn<strong>in</strong>g times for the <strong>in</strong>dividual<br />
runs were 4.096 × 10 -12 s. The simulations <strong>and</strong> ensemble<br />
averag<strong>in</strong>g were performed on a Beowulf Cluster conta<strong>in</strong><strong>in</strong>g 64<br />
processors. The plane averages appear<strong>in</strong>g <strong>in</strong> eq 2.4 were<br />
computed us<strong>in</strong>g f<strong>in</strong>ite grids that conta<strong>in</strong>ed from 35 to 72 po<strong>in</strong>ts.<br />
Underst<strong>and</strong><strong>in</strong>g that D(z) must scale with the probability of<br />
be<strong>in</strong>g <strong>in</strong> the z plane, which is proportional to e -W(z) , it is clear<br />
TABLE 1: D0 <strong>and</strong> P′ as a Function of Temperature a<br />
T K<br />
D0 × 109 m2 s-1 P′/n∞ eWBulk s/mkg<br />
D0,TST × 109 m2s-1 P′ TST /n∞ eWBulk s/m kg<br />
100 0.81 1.17 × 10⁻²⁴ 0.05 2.46 × 10⁻²⁵ 300 3.46 9.76 × 10⁻² 0.21 2.95 × 10⁻² 800 8.69 1.20 × 10⁶ 0.71 5.49 × 10⁵ a<br />
P′TST <strong>and</strong> D0,TST are the values obta<strong>in</strong>ed from TST.<br />
Figure 5. Intr<strong>in</strong>sic permeability, P′, show<strong>in</strong>g Arrhenius behavior <strong>in</strong><br />
the temperature range, 100-800 K. The top l<strong>in</strong>e shows ln(P′/n∞ e W Bulk),<br />
while the bottom l<strong>in</strong>e shows ln(P′ TST /n∞ e W Bulk).<br />
from eq 2.2 that the ma<strong>in</strong> contribution to the permeability will<br />
come from the planes where W(z) is large. We have checked<br />
numerically that D(z) ) n∞D0(T) e -W(z) is approximately true<br />
near the barrier tops, <strong>and</strong> the proportionality constant, D0(T), is<br />
reported <strong>in</strong> Table 1. In the same table, we report the values of<br />
P′/n∞ e W Bulk at the three temperatures. Note that the potential<br />
of mean force <strong>in</strong> the bulk was kept unspecified here. The log<br />
of the permeability is shown <strong>in</strong> Figure 5 as a function of 1/T.<br />
This figure shows that the permeability has an Arrhenius form.<br />
IV. Transition State Theory<br />
As discussed <strong>in</strong> I, an easy <strong>and</strong> much more common way of<br />
obta<strong>in</strong><strong>in</strong>g an estimate for the permeability is TST. Of the many<br />
assumptions <strong>in</strong>volved <strong>in</strong> TST, a crucial one is that the trajectory<br />
of the diffus<strong>in</strong>g particle, on average, follows the reaction<br />
coord<strong>in</strong>ate or a steepest descent path that l<strong>in</strong>ks different b<strong>in</strong>d<strong>in</strong>g<br />
sites. In I, we showed that this is <strong>in</strong>valid for small energy barrier<br />
systems. We now present the permeabilities for the present<br />
system us<strong>in</strong>g TST.<br />
In a hopp<strong>in</strong>g model that <strong>in</strong>corporates the two paths shown <strong>in</strong><br />
Figure 2, <strong>and</strong> that takes <strong>in</strong>to account the local m<strong>in</strong>ima that these<br />
paths cross, the steady-state flux through the material is given<br />
by<br />
2κ + Keqn∞ j )-<br />
kBTN(1 + κ- /k- ) (µ + - µ - ) (4.1)<br />
where κ( <strong>and</strong> k( are the rate constants whose respective rate<br />
processes are <strong>in</strong>dicated <strong>in</strong> Figure 3. The equilibrium constant<br />
Keq describes the equilibrium between the gas <strong>in</strong> the bulk <strong>and</strong><br />
the first layers of b<strong>in</strong>d<strong>in</strong>g sites (assum<strong>in</strong>g that their energies<br />
are the same as those for sites well <strong>in</strong>side the crystal). F<strong>in</strong>ally,<br />
N is the number of b<strong>in</strong>d<strong>in</strong>g sites <strong>in</strong> a channel of a given length,<br />
here, 3 per unit cell. In obta<strong>in</strong><strong>in</strong>g eq 4.1, we have assumed that<br />
the gas <strong>in</strong> the bulk is ideal, hence, δµ( ∼ δn(/n∞.<br />
TST gives analytical expressions for all rate constants <strong>in</strong> eq<br />
4.1, while Keq can be obta<strong>in</strong>ed from a Langmuir adsorption<br />
model, which assumes equilibrium between the gas <strong>and</strong> b<strong>in</strong>d<strong>in</strong>g