Benoit Palmieri and David Ronis, Diffusion in ... - McGill University
Benoit Palmieri and David Ronis, Diffusion in ... - McGill University
Benoit Palmieri and David Ronis, Diffusion in ... - McGill University

You also want an ePaper? Increase the reach of your titles
YUMPU automatically turns print PDFs into web optimized ePapers that Google loves.
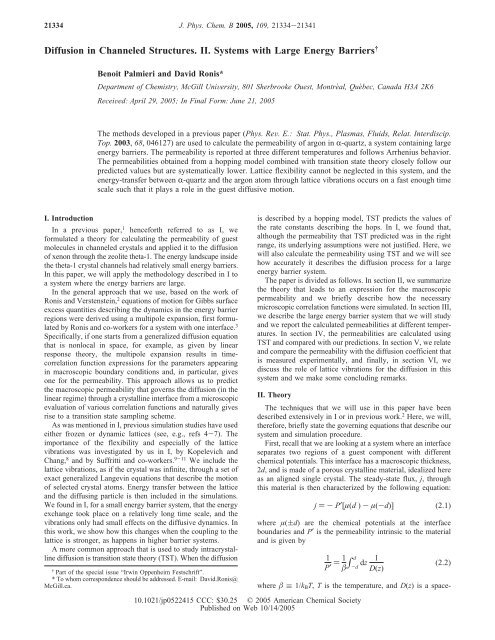
21334 J. Phys. Chem. B 2005, 109, 21334-21341<br />
<strong>Diffusion</strong> <strong>in</strong> Channeled Structures. II. Systems with Large Energy Barriers †<br />
<strong>Benoit</strong> <strong>Palmieri</strong> <strong>and</strong> <strong>David</strong> <strong>Ronis</strong>*<br />
Department of Chemistry, <strong>McGill</strong> UniVersity, 801 Sherbrooke Ouest, Montréal, Québec, Canada H3A 2K6<br />
ReceiVed: April 29, 2005; In F<strong>in</strong>al Form: June 21, 2005<br />
The methods developed <strong>in</strong> a previous paper (Phys. ReV. E.: Stat. Phys., Plasmas, Fluids, Relat. Interdiscip.<br />
Top. 2003, 68, 046127) are used to calculate the permeability of argon <strong>in</strong> R-quartz, a system conta<strong>in</strong><strong>in</strong>g large<br />
energy barriers. The permeability is reported at three different temperatures <strong>and</strong> follows Arrhenius behavior.<br />
The permeabilities obta<strong>in</strong>ed from a hopp<strong>in</strong>g model comb<strong>in</strong>ed with transition state theory closely follow our<br />
predicted values but are systematically lower. Lattice flexibility cannot be neglected <strong>in</strong> this system, <strong>and</strong> the<br />
energy-transfer between R-quartz <strong>and</strong> the argon atom through lattice vibrations occurs on a fast enough time<br />
scale such that it plays a role <strong>in</strong> the guest diffusive motion.<br />
I. Introduction<br />
In a previous paper, 1 henceforth referred to as I, we<br />
formulated a theory for calculat<strong>in</strong>g the permeability of guest<br />
molecules <strong>in</strong> channeled crystals <strong>and</strong> applied it to the diffusion<br />
of xenon through the zeolite theta-1. The energy l<strong>and</strong>scape <strong>in</strong>side<br />
the theta-1 crystal channels had relatively small energy barriers.<br />
In this paper, we will apply the methodology described <strong>in</strong> I to<br />
a system where the energy barriers are large.<br />
In the general approach that we use, based on the work of<br />
<strong>Ronis</strong> <strong>and</strong> Verstenste<strong>in</strong>, 2 equations of motion for Gibbs surface<br />
excess quantities describ<strong>in</strong>g the dynamics <strong>in</strong> the energy barrier<br />
regions were derived us<strong>in</strong>g a multipole expansion, first formulated<br />
by <strong>Ronis</strong> <strong>and</strong> co-workers for a system with one <strong>in</strong>terface. 3<br />
Specifically, if one starts from a generalized diffusion equation<br />
that is nonlocal <strong>in</strong> space, for example, as given by l<strong>in</strong>ear<br />
response theory, the multipole expansion results <strong>in</strong> timecorrelation<br />
function expressions for the parameters appear<strong>in</strong>g<br />
<strong>in</strong> macroscopic boundary conditions <strong>and</strong>, <strong>in</strong> particular, gives<br />
one for the permeability. This approach allows us to predict<br />
the macroscopic permeability that governs the diffusion (<strong>in</strong> the<br />
l<strong>in</strong>ear regime) through a crystall<strong>in</strong>e <strong>in</strong>terface from a microscopic<br />
evaluation of various correlation functions <strong>and</strong> naturally gives<br />
rise to a transition state sampl<strong>in</strong>g scheme.<br />
As was mentioned <strong>in</strong> I, previous simulation studies have used<br />
either frozen or dynamic lattices (see, e.g., refs 4-7). The<br />
importance of the flexibility <strong>and</strong> especially of the lattice<br />
vibrations was <strong>in</strong>vestigated by us <strong>in</strong> I, by Kopelevich <strong>and</strong><br />
Chang, 8 <strong>and</strong> by Suffritti <strong>and</strong> co-workers. 9-11 We <strong>in</strong>clude the<br />
lattice vibrations, as if the crystal was <strong>in</strong>f<strong>in</strong>ite, through a set of<br />
exact generalized Langev<strong>in</strong> equations that describe the motion<br />
of selected crystal atoms. Energy transfer between the lattice<br />
<strong>and</strong> the diffus<strong>in</strong>g particle is then <strong>in</strong>cluded <strong>in</strong> the simulations.<br />
We found <strong>in</strong> I, for a small energy barrier system, that the energy<br />
exchange took place on a relatively long time scale, <strong>and</strong> the<br />
vibrations only had small effects on the diffusive dynamics. In<br />
this work, we show how this changes when the coupl<strong>in</strong>g to the<br />
lattice is stronger, as happens <strong>in</strong> higher barrier systems.<br />
A more common approach that is used to study <strong>in</strong>tracrystall<strong>in</strong>e<br />
diffusion is transition state theory (TST). When the diffusion<br />
† Part of the special issue “Irw<strong>in</strong> Oppenheim Festschrift”.<br />
* To whom correspondence should be addressed. E-mail: <strong>David</strong>.<strong>Ronis</strong>@<br />
<strong>McGill</strong>.ca.<br />
is described by a hopp<strong>in</strong>g model, TST predicts the values of<br />
the rate constants describ<strong>in</strong>g the hops. In I, we found that,<br />
although the permeability that TST predicted was <strong>in</strong> the right<br />
range, its underly<strong>in</strong>g assumptions were not justified. Here, we<br />
will also calculate the permeability us<strong>in</strong>g TST <strong>and</strong> we will see<br />
how accurately it describes the diffusion process for a large<br />
energy barrier system.<br />
The paper is divided as follows. In section II, we summarize<br />
the theory that leads to an expression for the macroscopic<br />
permeability <strong>and</strong> we briefly describe how the necessary<br />
microscopic correlation functions were simulated. In section III,<br />
we describe the large energy barrier system that we will study<br />
<strong>and</strong> we report the calculated permeabilities at different temperatures.<br />
In section IV, the permeabilities are calculated us<strong>in</strong>g<br />
TST <strong>and</strong> compared with our predictions. In section V, we relate<br />
<strong>and</strong> compare the permeability with the diffusion coefficient that<br />
is measured experimentally, <strong>and</strong> f<strong>in</strong>ally, <strong>in</strong> section VI, we<br />
discuss the role of lattice vibrations for the diffusion <strong>in</strong> this<br />
system <strong>and</strong> we make some conclud<strong>in</strong>g remarks.<br />
II. Theory<br />
The techniques that we will use <strong>in</strong> this paper have been<br />
described extensively <strong>in</strong> I or <strong>in</strong> previous work. 2 Here, we will,<br />
therefore, briefly state the govern<strong>in</strong>g equations that describe our<br />
system <strong>and</strong> simulation procedure.<br />
First, recall that we are look<strong>in</strong>g at a system where an <strong>in</strong>terface<br />
separates two regions of a guest component with different<br />
chemical potentials. This <strong>in</strong>terface has a macroscopic thickness,<br />
2d, <strong>and</strong> is made of a porous crystall<strong>in</strong>e material, idealized here<br />
as an aligned s<strong>in</strong>gle crystal. The steady-state flux, j, through<br />
this material is then characterized by the follow<strong>in</strong>g equation:<br />
j )-P′[µ(d ) - µ(-d)] (2.1)<br />
where µ((d) are the chemical potentials at the <strong>in</strong>terface<br />
boundaries <strong>and</strong> P′ is the permeability <strong>in</strong>tr<strong>in</strong>sic to the material<br />
<strong>and</strong> is given by<br />
1 1<br />
)<br />
P′ ∫ d 1<br />
dz<br />
-d D(z)<br />
(2.2)<br />
where ≡ 1/kBT, T is the temperature, <strong>and</strong> D(z) is a space-<br />
10.1021/jp0522415 CCC: $30.25 © 2005 American Chemical Society<br />
Published on Web 10/14/2005
<strong>Diffusion</strong> <strong>in</strong> Channeled Structures J. Phys. Chem. B, Vol. 109, No. 45, 2005 21335<br />
-dependent Onsager diffusion coefficient given by<br />
q<br />
where Jz is the z component of the irreversible or dissipative<br />
part of the current <strong>and</strong> A is the area of the crystal. Also note<br />
that the <strong>in</strong>tegration variable, z, is def<strong>in</strong>ed to be normal to the<br />
<strong>in</strong>terface (i.e., parallel to the net flux) <strong>and</strong> is perpendicular to<br />
r|.<br />
The time correlation function that appears <strong>in</strong> eq 2.3 is not<br />
q<br />
directly amenable to simulation s<strong>in</strong>ce the dynamics <strong>in</strong> Jz(r, t)<br />
<strong>in</strong>clude a projection operator that projects out the slow parts of<br />
the motion (<strong>in</strong> practice, the parts not <strong>in</strong>cluded explicitly <strong>in</strong> the<br />
macroscopic equations). 12 By manipulat<strong>in</strong>g the well-known<br />
<strong>in</strong>tegral equations relat<strong>in</strong>g correlation <strong>and</strong> memory functions,<br />
Vertenste<strong>in</strong> <strong>and</strong> <strong>Ronis</strong>2,12 obta<strong>in</strong>ed an approximate expression<br />
for D(z) by assum<strong>in</strong>g <strong>in</strong>f<strong>in</strong>ite dilution <strong>in</strong>side the material <strong>and</strong><br />
that D(z) eW(z) is approximately constant near the W(z) barrier<br />
tops; the result is that<br />
where n∞ is the number density of the guest <strong>in</strong> the bulk, Vz is<br />
the z component of the guest velocity, 〈...〉r denotes a conditional<br />
equilibrium average under the constra<strong>in</strong>t that the <strong>in</strong>itial position<br />
of the guest is r, <strong>and</strong> W(z) <strong>and</strong> F(z) are the plane averaged<br />
potential of mean force <strong>and</strong> mean force of the guest <strong>in</strong> the plane<br />
z, respectively (we dist<strong>in</strong>guish the plane average quantities <strong>and</strong><br />
their 3D counterparts by the argument to the function, z <strong>in</strong> the<br />
former <strong>and</strong> r <strong>in</strong> the latter); <strong>in</strong> particular,<br />
Note that the denom<strong>in</strong>ator <strong>in</strong> eq 2.4 approximately reproduces<br />
the effect of the projection operator that is implicit <strong>in</strong> J q , the<br />
irreversible part of the current, compare to eq 2.3.<br />
It follows from eqs 2.3 or 2.4 that D(z) will be small when<br />
z is a barrier-top plane, <strong>and</strong> it is just these planes that give the<br />
ma<strong>in</strong> contributions to the permeability, compare to eq 2.2.<br />
Hence, provided that a practical way is found for calculat<strong>in</strong>g<br />
the potential of mean force near the transition states (e.g.,<br />
analytically or us<strong>in</strong>g umbrella sampl<strong>in</strong>g), our theory becomes<br />
a transition state sampl<strong>in</strong>g method, only requir<strong>in</strong>g a knowledge<br />
of dynamical correlations for <strong>in</strong>itial states near the transition<br />
state.<br />
Clearly, it is necessary to simulate the guest dynamics <strong>in</strong>side<br />
the crystal <strong>in</strong> order to calculate the time correlation functions<br />
appear<strong>in</strong>g <strong>in</strong> eq 2.4. As described <strong>in</strong> I, we assume that the guest<br />
<strong>in</strong>teracts with a limited number of crystal atoms (referred to as<br />
the “target atoms”, or T for short). The effect of the rest of the<br />
crystal (the bath) will be described us<strong>in</strong>g a projection operator<br />
approach, 13 where the projection operator is an average over<br />
the bath degrees of freedom <strong>and</strong> gives rise to the follow<strong>in</strong>g<br />
generalized Langev<strong>in</strong> equation:<br />
<strong>and</strong><br />
D(z) ) 1<br />
A ∫ ∞ q q<br />
dt<br />
0 ∫ dr |∫ dr′〈Jz(r, t) Jz(r′)〉<br />
(2.3)<br />
n∞ ∫0 D(z) )<br />
A + ∫0 ∞ dt1∫ dr | 〈V z (t 1 )V z 〉 r e -W(r)<br />
∞ dt1∫ dr | 〈F[z(t 1 )]V z 〉 r e -[W(r)-W(z)]<br />
e -W(z) ≡ A -1 ∫ dr | e -W(r)<br />
dp(t)<br />
dt )-dU[r(t),R T (t)]<br />
dr<br />
(2.4)<br />
(2.5)<br />
dPT (t)<br />
dt )-KeffRT (t) - dU[r(t),RT (t)]<br />
+<br />
where U is the potential <strong>in</strong>teraction between the guest <strong>and</strong> the<br />
target atoms, RT <strong>and</strong> PT are, respectively, the target position<br />
<strong>and</strong> momentum column vectors, Keff is an effective force<br />
q<br />
constant matrix, FT is a colored Gaussian noise column vector<br />
q q<br />
with zero mean <strong>and</strong> variance matrix 〈FT(t)(FT) T 〉, <strong>and</strong> the T<br />
superscript <strong>in</strong>dicates a transpose.<br />
The projection operator drops out of the time dependence of<br />
the memory function, which is obta<strong>in</strong>ed by consider<strong>in</strong>g the<br />
harmonic motion of the bath <strong>in</strong> the presence of frozen target<br />
<strong>and</strong> guest. Note that these equations are exact, provided that<br />
the <strong>in</strong>teraction between the crystal atoms is harmonic <strong>and</strong><br />
provided that the guest does not directly <strong>in</strong>teract with the bath<br />
(this last po<strong>in</strong>t can be relaxed somewhat to allow for direct<br />
harmonic <strong>in</strong>teractions between the guest <strong>and</strong> the bath). In I, we<br />
described, <strong>in</strong> detail, the procedures that allow us to calculate<br />
q q<br />
Keff <strong>and</strong> 〈FT(t)(FT) T 〉. When the Laplace transform of the<br />
memory function is approximately written as<br />
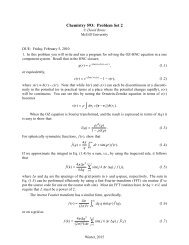
the equations of motions simplify to a set of coupled stochastic<br />
differential equations with additive white noise, which, by<br />
properly choos<strong>in</strong>g the matrices A, B, <strong>and</strong> C, reproduces the basic<br />
features of the <strong>in</strong>f<strong>in</strong>ite crystal vibrational density of states (cf.<br />
I <strong>and</strong> Figure 1).<br />
F<strong>in</strong>ally, a low-temperature expansion for the potential of mean<br />
force was developed <strong>and</strong> to l<strong>in</strong>ear order <strong>in</strong> T gives<br />
where<br />
dRT q t q q T<br />
FT(t) - ∫ dτ 〈FT(t<br />
- τ)(FT)<br />
〉R˙<br />
0<br />
T (τ) (2.6)<br />
q q T<br />
〈FT(s)(FT) 〉 )<br />
s<br />
A + B‚s + C‚s 2<br />
(2.7)<br />
Figure 1. Exact density of states (full l<strong>in</strong>e) for R-quartz obta<strong>in</strong>ed from<br />
a Brillou<strong>in</strong> zone calculation compared with the approximate density<br />
of states (dashed l<strong>in</strong>e) that is reproduced from eq 2.7.<br />
(0)<br />
W(r) ) U(r,RT ) +<br />
1<br />
2 R k (0)T (0) BT T KeffRT +<br />
2 ln{ det[ 1 + Keff (0)<br />
∂U(r,R (0) T )<br />
KeffRT )-<br />
∂RT -1∂2 (0)<br />
U(r,RT )<br />
]} 2<br />
∂RT (2.8)<br />
(2.9)
21336 J. Phys. Chem. B, Vol. 109, No. 45, 2005 <strong>Palmieri</strong> <strong>and</strong> <strong>Ronis</strong><br />
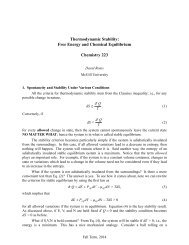
Figure 2. Constant potential of mean force surfaces for argon <strong>in</strong> R-quartz at 300 K. The surface energy is <strong>in</strong>dicated <strong>in</strong> the corner of each subfigure.<br />
Two symmetry-equivalent low-energy reaction coord<strong>in</strong>ates are shown as paths 1 (red) <strong>and</strong> 2 (blue). The k<strong>in</strong>k is the position of a local m<strong>in</strong>imum<br />
along the path. Also shown is a high-energy reaction coord<strong>in</strong>ate (green) connect<strong>in</strong>g different channels <strong>in</strong> different unit cells (the saddle po<strong>in</strong>t is<br />
<strong>in</strong>dicated by an “X”).<br />
(0)<br />
def<strong>in</strong>es new equilibrium lattice positions, RT , where the net<br />
force on the target atoms is zero <strong>in</strong> the presence of a guest fixed<br />
at r.<br />
III. Results<br />
A. Specification of the System. The system that we will be<br />
work<strong>in</strong>g with is argon diffus<strong>in</strong>g <strong>in</strong> R-quartz. This crystal conta<strong>in</strong>s<br />
multidimensional <strong>in</strong>terconnected channels that are roughly the<br />
size of an argon atom (3-4 Å). Note that quartz shows a phase<br />
transition from the R to the structures at 846 K; 14 hence, we<br />
will work below this temperature. The coord<strong>in</strong>ates of the n<strong>in</strong>e<br />
crystal atoms <strong>in</strong> the unit cell were obta<strong>in</strong>ed from ref 15. The<br />
<strong>in</strong>teratomic crystal potential, which we describe solely by<br />
stretches <strong>and</strong> bends, is described <strong>in</strong> I. The vibrational density<br />
of states obta<strong>in</strong>ed from our model is shown <strong>in</strong> Figure 1, <strong>and</strong> it<br />
agrees well with other calculations. 16 Our target zone is centered<br />
at a corner of the primitive unit cell <strong>and</strong> is rectangular with<br />
dimensions (14.7402, 14.7402, 16.2156 Å). It conta<strong>in</strong>s 279<br />
atoms <strong>and</strong> is large enough such that the <strong>in</strong>teraction energy<br />
between the guest <strong>and</strong> bath is small.<br />
In I, the target-guest <strong>in</strong>teractions were described <strong>in</strong> terms of<br />
a Lennard-Jones potential <strong>and</strong> lattice partial-charge guest<br />
polarization <strong>in</strong>teractions. Here, we use the Lennard-Jones term<br />
only, with parameters that differ slightly from I (cf. section V).<br />
We have tested our approximate expression for the potential of<br />
mean force, eq 2.8, by compar<strong>in</strong>g the result<strong>in</strong>g mean force<br />
aga<strong>in</strong>st the numerically simulated average force on a frozen<br />
guest after the lattice has equilibrated. The agreement was<br />
excellent for the three temperatures we will consider, namely,<br />
100, 300, <strong>and</strong>, surpris<strong>in</strong>gly, even at 800 K (remember that eq<br />
2.8 is a low-temperature expansion).<br />
Some constant potential of mean force surfaces are shown<br />
<strong>in</strong> Figure 2 at 300 K. The three b<strong>in</strong>d<strong>in</strong>g sites <strong>in</strong> the unit cell are<br />
equally separated along the z axis <strong>in</strong> a spiral staircase conformation.<br />
Each pair of nearest-neighbor b<strong>in</strong>d<strong>in</strong>g sites is connected<br />
by two symmetry-related steepest descent paths. They go<br />
through a local m<strong>in</strong>imum <strong>and</strong> have two saddle po<strong>in</strong>ts along the<br />
way (see the 25.7kBT contour of Figures 2, <strong>and</strong> Figure 3 which<br />
shows the potential of mean force along the path). The guest,<br />
at least at 300 K, will preferably travel along reaction paths 1<br />
<strong>and</strong> 2, shown <strong>in</strong> Figure 2, <strong>and</strong> will undergo a net displacement<br />
along z. From Figure 2 at 28.5kBT, we see that the channels lie<br />
along z <strong>and</strong> are disconnected at moderate energies. To travel<br />
from one channel to another, the guest must overcome a larger<br />
barrier. This is seen from the dashed l<strong>in</strong>e <strong>in</strong> Figure 3 <strong>and</strong> by<br />
the pocket labeled “A” <strong>in</strong> Figure 2 that makes a connection
<strong>Diffusion</strong> <strong>in</strong> Channeled Structures J. Phys. Chem. B, Vol. 109, No. 45, 2005 21337<br />
Figure 3. Potential of mean force along the reaction coord<strong>in</strong>ate (Paths<br />
1 <strong>and</strong> 2 <strong>in</strong> Figure 2), shown as the full l<strong>in</strong>e. The dashed l<strong>in</strong>e shows the<br />
potential of mean force for a reaction coord<strong>in</strong>ate that connects different<br />
channels, compare to Figure 2. The saddle po<strong>in</strong>t at “X” is <strong>in</strong>dicated <strong>in</strong><br />
Figure 2. The rate constants used <strong>in</strong> TST, compare to eq 4.1, are also<br />
<strong>in</strong>dicated at the two saddle po<strong>in</strong>ts 1 <strong>and</strong> 2.<br />
Figure 4. Plane average potential of mean force. The temperatures<br />
are, start<strong>in</strong>g with the bottom curve, T ) 100, 300, <strong>and</strong> 800 K.<br />
with the channel only at 41.0kBT. Hence, the channels will<br />
behave as if they are disconnected, at least at 100 <strong>and</strong> 300 K.<br />
Also shown <strong>in</strong> Figure 2 is the high energy reaction coord<strong>in</strong>ate<br />
that connects neighbor<strong>in</strong>g channels <strong>and</strong> whose saddle po<strong>in</strong>t is<br />
<strong>in</strong>dicated by an “X”.<br />
The plane average potentials of mean force, W(z), at the<br />
temperatures of <strong>in</strong>terest are shown <strong>in</strong> Figure 4. Note the<br />
significant <strong>in</strong>crease with temperature <strong>in</strong> the absolute potential<br />
of mean force, a feature we did not observe <strong>in</strong> I. On the other<br />
h<strong>and</strong>, the activation energy, obta<strong>in</strong>ed from W(z), for the<br />
<strong>in</strong>dividual hops between the b<strong>in</strong>d<strong>in</strong>g sites, decreases, albeit very<br />
slightly, with an <strong>in</strong>crease <strong>in</strong> temperature.<br />
B. Permeabilities. The first step <strong>in</strong> calculat<strong>in</strong>g the permeabilities,<br />
P′, is to obta<strong>in</strong> the time-correlations functions appear<strong>in</strong>g<br />
<strong>in</strong> eq 2.4. This was done by simulat<strong>in</strong>g eqs 2.5 <strong>and</strong> 2.6 with a<br />
second-order stochastic Runge-Kutta <strong>in</strong>tegrator. 17 The required<br />
correlation functions at any <strong>in</strong>itial guest position were obta<strong>in</strong>ed<br />
from an ensemble average of 2000 trajectories. Each of the<br />
trajectories was “aged”, keep<strong>in</strong>g the guest frozen while the lattice<br />
equilibrated. The ag<strong>in</strong>g <strong>and</strong> runn<strong>in</strong>g times for the <strong>in</strong>dividual<br />
runs were 4.096 × 10 -12 s. The simulations <strong>and</strong> ensemble<br />
averag<strong>in</strong>g were performed on a Beowulf Cluster conta<strong>in</strong><strong>in</strong>g 64<br />
processors. The plane averages appear<strong>in</strong>g <strong>in</strong> eq 2.4 were<br />
computed us<strong>in</strong>g f<strong>in</strong>ite grids that conta<strong>in</strong>ed from 35 to 72 po<strong>in</strong>ts.<br />
Underst<strong>and</strong><strong>in</strong>g that D(z) must scale with the probability of<br />
be<strong>in</strong>g <strong>in</strong> the z plane, which is proportional to e -W(z) , it is clear<br />
TABLE 1: D0 <strong>and</strong> P′ as a Function of Temperature a<br />
T K<br />
D0 × 109 m2 s-1 P′/n∞ eWBulk s/mkg<br />
D0,TST × 109 m2s-1 P′ TST /n∞ eWBulk s/m kg<br />
100 0.81 1.17 × 10⁻²⁴ 0.05 2.46 × 10⁻²⁵ 300 3.46 9.76 × 10⁻² 0.21 2.95 × 10⁻² 800 8.69 1.20 × 10⁶ 0.71 5.49 × 10⁵ a<br />
P′TST <strong>and</strong> D0,TST are the values obta<strong>in</strong>ed from TST.<br />
Figure 5. Intr<strong>in</strong>sic permeability, P′, show<strong>in</strong>g Arrhenius behavior <strong>in</strong><br />
the temperature range, 100-800 K. The top l<strong>in</strong>e shows ln(P′/n∞ e W Bulk),<br />
while the bottom l<strong>in</strong>e shows ln(P′ TST /n∞ e W Bulk).<br />
from eq 2.2 that the ma<strong>in</strong> contribution to the permeability will<br />
come from the planes where W(z) is large. We have checked<br />
numerically that D(z) ) n∞D0(T) e -W(z) is approximately true<br />
near the barrier tops, <strong>and</strong> the proportionality constant, D0(T), is<br />
reported <strong>in</strong> Table 1. In the same table, we report the values of<br />
P′/n∞ e W Bulk at the three temperatures. Note that the potential<br />
of mean force <strong>in</strong> the bulk was kept unspecified here. The log<br />
of the permeability is shown <strong>in</strong> Figure 5 as a function of 1/T.<br />
This figure shows that the permeability has an Arrhenius form.<br />
IV. Transition State Theory<br />
As discussed <strong>in</strong> I, an easy <strong>and</strong> much more common way of<br />
obta<strong>in</strong><strong>in</strong>g an estimate for the permeability is TST. Of the many<br />
assumptions <strong>in</strong>volved <strong>in</strong> TST, a crucial one is that the trajectory<br />
of the diffus<strong>in</strong>g particle, on average, follows the reaction<br />
coord<strong>in</strong>ate or a steepest descent path that l<strong>in</strong>ks different b<strong>in</strong>d<strong>in</strong>g<br />
sites. In I, we showed that this is <strong>in</strong>valid for small energy barrier<br />
systems. We now present the permeabilities for the present<br />
system us<strong>in</strong>g TST.<br />
In a hopp<strong>in</strong>g model that <strong>in</strong>corporates the two paths shown <strong>in</strong><br />
Figure 2, <strong>and</strong> that takes <strong>in</strong>to account the local m<strong>in</strong>ima that these<br />
paths cross, the steady-state flux through the material is given<br />
by<br />
2κ + Keqn∞ j )-<br />
kBTN(1 + κ- /k- ) (µ + - µ - ) (4.1)<br />
where κ( <strong>and</strong> k( are the rate constants whose respective rate<br />
processes are <strong>in</strong>dicated <strong>in</strong> Figure 3. The equilibrium constant<br />
Keq describes the equilibrium between the gas <strong>in</strong> the bulk <strong>and</strong><br />
the first layers of b<strong>in</strong>d<strong>in</strong>g sites (assum<strong>in</strong>g that their energies<br />
are the same as those for sites well <strong>in</strong>side the crystal). F<strong>in</strong>ally,<br />
N is the number of b<strong>in</strong>d<strong>in</strong>g sites <strong>in</strong> a channel of a given length,<br />
here, 3 per unit cell. In obta<strong>in</strong><strong>in</strong>g eq 4.1, we have assumed that<br />
the gas <strong>in</strong> the bulk is ideal, hence, δµ( ∼ δn(/n∞.<br />
TST gives analytical expressions for all rate constants <strong>in</strong> eq<br />
4.1, while Keq can be obta<strong>in</strong>ed from a Langmuir adsorption<br />
model, which assumes equilibrium between the gas <strong>and</strong> b<strong>in</strong>d<strong>in</strong>g
21338 J. Phys. Chem. B, Vol. 109, No. 45, 2005 <strong>Palmieri</strong> <strong>and</strong> <strong>Ronis</strong><br />
sites <strong>in</strong> the outermost layer of the crystal; this gives<br />
<strong>and</strong><br />
[ κ + Keq ) 2π(kBT)3 q<br />
mη1 1<br />
]1/2<br />
F<br />
q c e -(W1 q-WBulk) q)<br />
κ- )<br />
k- ( η q q 1/2<br />
2 2<br />
e<br />
q<br />
η11 -(W1 q-W2 q )<br />
(4.2)<br />
q q q<br />
where Wi is the potential of mean force, while ηi <strong>and</strong> i are<br />
the two positive potential of mean force curvature eigenvalues<br />
at the ith saddle po<strong>in</strong>t, Fc is the channel density per unit area,<br />
<strong>and</strong> m is the mass of the guest. Note that partition functions for<br />
the b<strong>in</strong>d<strong>in</strong>g sites drop out of the f<strong>in</strong>al expression, compare to<br />
eq 4.2. The permeability predicted by TST is obta<strong>in</strong>ed from<br />
eqs 4.1 <strong>and</strong> 4.2 <strong>and</strong> gives<br />
P′ TST Fcκ + Keq ) 2<br />
n∞ kBTN(1 + κ- /k- ) ≈ 2F cκ + Keq kBTN (4.3)<br />
q q<br />
where the last approximation is valid when W1 . W2 (this is<br />
the case for 100 <strong>and</strong> 300 K but not for 800 K, <strong>and</strong> the full<br />
expression will be used for the three cases). In this limit, the<br />
effective hopp<strong>in</strong>g rate constant between two b<strong>in</strong>d<strong>in</strong>g sites is<br />
unaffected by the local m<strong>in</strong>imum. The permeabilities can now<br />
be calculated. They are reported <strong>in</strong> Table 1 <strong>and</strong> are plotted <strong>in</strong><br />
Figure 5 for comparison with the permeabilities us<strong>in</strong>g the theory<br />
<strong>in</strong> I. It is seen that the temperature dependence predicted by<br />
TST is close to our value, while the actual permeabilities are<br />
consistently lower.<br />
V. Comparison With Experiment<br />
We now compare our results with experimental argon<br />
diffusivities obta<strong>in</strong>ed by Watson <strong>and</strong> Cherniak. 18 This group<br />
studied the diffusion of argon <strong>in</strong>to R- <strong>and</strong> -quartz. In this study,<br />
the silica surface was exposed to pressurized argon (around 100<br />
MPa) for several hours. Then, the near-surface region was<br />
analyzed us<strong>in</strong>g Rutherford backscatter<strong>in</strong>g spectrometry, a<br />
technique capable of measur<strong>in</strong>g the concentration profile of<br />
various species <strong>in</strong>side the material. 19 These profiles were fitted<br />
to the solution of the 1D diffusion equation<br />
∂n(z,t)<br />
∂t ) D∂2 n(z,t)<br />
∂z 2<br />
(4.4)<br />
(5.1)<br />
which describes the density n(z, t) of argon <strong>in</strong>side the material<br />
as a function of time, t, <strong>and</strong> depth, z, to obta<strong>in</strong> the diffusion<br />
coefficient, D.<br />
The diffusion equation applied to our system under steadystate<br />
conditions gives, for the net flux,<br />
j )- D<br />
[n(d) - n(-d)] (5.2)<br />
2d<br />
where, as usual, 2d is the thickness of the crystall<strong>in</strong>e <strong>in</strong>terface<br />
<strong>and</strong> n((d) is the density at the boundaries. By rewrit<strong>in</strong>g the<br />
last equation <strong>in</strong> terms of the difference <strong>in</strong> chemical potentials,<br />
we obta<strong>in</strong><br />
j )- D<br />
2d( ∂n∞ ∂µ ) [µ(d) - µ(-d)] (5.3)<br />
<br />
<strong>in</strong> the l<strong>in</strong>ear regime. It is easily shown that the permeability<br />
Figure 6. Nonideal bulk correction factor appear<strong>in</strong>g <strong>in</strong> eq 5.4 for a<br />
Lennard-Jones fluid with argon-like parameters 20 as a function of<br />
pressure, p, us<strong>in</strong>g the HNC approximation <strong>and</strong> the compressibility<br />
relation for the pressure (σ is the Lennard-Jones size parameter). Note<br />
that the HNC solution becomes unphysical for pressures beyond those<br />
shown <strong>in</strong> the figure at 100 K, possibly signal<strong>in</strong>g a phase transition.<br />
<strong>and</strong> the diffusion coefficient are related by<br />
D ) 2dkBT[ ∂<br />
(n∞ e<br />
∂n∞ WBulk P′ )] n∞ e WBulk<br />
where WBulk ) ∆µ is the nonideal part of the guest chemical<br />
potential <strong>in</strong> the bulk. For ideal gases, the factor <strong>in</strong> square<br />
brackets <strong>in</strong> eq 5.4 is equal to 1, but at the experimental pressures<br />
(around 100 MPa), the nonideal corrections are non-negligible.<br />
We computed the quantity appear<strong>in</strong>g <strong>in</strong> the square brackets by<br />
numerically solv<strong>in</strong>g the hypernetted cha<strong>in</strong> equation (HNC) for<br />
a bulk Lennard-Jones fluid <strong>and</strong> not<strong>in</strong>g that<br />
<strong>and</strong><br />
(5.4)<br />
( ∂∆µ<br />
∂n ) )-c˜(,n) (5.5)<br />
p ) n - ∫ 0<br />
where c˜(,n) is the zero wave-vector Fourier transform of the<br />
direct correlation function 20 <strong>and</strong> p is the pressure. Note that eq<br />
5.6 is the well-known compressibility expression for the equation<br />
of state. F<strong>in</strong>ally, we can use the HNC results for c˜(, n) to<br />
numerically <strong>in</strong>tegrate eqs 5.5 <strong>and</strong> 5.6, <strong>and</strong> the result is shown<br />
<strong>in</strong> Figure 6.<br />
We are now <strong>in</strong> position to compare our predicted D with the<br />
experimental ones. The experiment reports the full diffusion<br />
coefficient as follows:<br />
D ) D′ e -∆Eq<br />
n dnnc˜(, n) (5.6)<br />
(5.7)<br />
In terms of TST, the diffusion constant for multiple-barrier<br />
channel hops takes the form<br />
D ) k B T<br />
h e-∆Aq 4dF c<br />
NF 0( T 0<br />
T ) 3/2<br />
(5.8)<br />
where h is Planck’s constant <strong>and</strong> where F0 <strong>and</strong> T0 are the bulk<br />
gas density <strong>and</strong> temperature, respectively, <strong>in</strong> the st<strong>and</strong>ard state<br />
(here 300 K <strong>and</strong> 1 atm). The activation free energy is easily<br />
obta<strong>in</strong>ed by us<strong>in</strong>g either our result or TST’s result for D,<br />
compare to eq 5.4, <strong>in</strong> the last equation. The activation Helmholtz
<strong>Diffusion</strong> <strong>in</strong> Channeled Structures J. Phys. Chem. B, Vol. 109, No. 45, 2005 21339<br />
TABLE 2: Comparison with Experimental <strong>Diffusion</strong> Coefficients for the Two Potential Models, a <strong>and</strong> b<br />
our method TST<br />
a b a b ref 18 (R-quartz)<br />
∆Eq /kB(K) 7863 20 304 7912 20 601 6150 ( 750<br />
∆Sq /kB -11.80 -13.28 -12.52 -13.72 -32.47<br />
D′ 800 (m2 /s) 7.80 × 10⁻¹⁰ 1.75 × 10⁻¹⁰ 3.80 × 10⁻¹⁰ 1.13 × 10⁻¹⁰ +8.8<br />
× 10-19 -log10 D800 13.38 20.78 13.72 21.13 21.43<br />
free energy takes the usual form, ∆A q ) ∆E q - T∆S q , where,<br />
as usual, ∆E q is obta<strong>in</strong>ed from the slope of a plot of ∆A q /T<br />
versus 1/T, compare to Figure 5. In Table 2, we report ∆E q ,<br />
∆S q , <strong>and</strong> D′ <strong>and</strong> compare them with the experimental values.<br />
We report both calculated <strong>and</strong> experimental D′ only at 800 K<br />
because the experiment never considered room temperature or<br />
lower.<br />
The Lennard-Jones parameters that we used are the same as<br />
those <strong>in</strong> I, but with modified target atoms radii (rO ) 0.9720 Å<br />
<strong>and</strong> rSi ) 0.6380 Å) such that our ∆E q agrees well with the<br />
experiment. This set of potential parameters, used everywhere<br />
unless specified otherwise, is denoted as “a” <strong>in</strong> Table 2. For<br />
this potential, the Arrhenius pre-exponential factor, that is,<br />
D′ 800 , differs by 8 orders of magnitude from that reported by<br />
Watson <strong>and</strong> Cherniak <strong>and</strong> the overall D at 800 K also differs<br />
by 8 orders of magnitude. Such a big difference very likely<br />
arises from a Boltzmann factor <strong>and</strong> strongly suggests that the<br />
current potential parameters (“a”) underestimate the strength<br />
of the actual guest-lattice <strong>in</strong>teractions <strong>and</strong> that the already large<br />
energy barriers of the system are, <strong>in</strong> fact, even larger.<br />
The limited free volume for argon to diffuse <strong>in</strong> R-quartz<br />
implies that argon is always <strong>in</strong> regions of strong repulsive<br />
potential of the closest crystal atoms. In this regime, small<br />
changes <strong>in</strong> the potentials’ parameters can drastically change the<br />
shape of potential surfaces. In fact, the depth of our Lennard-<br />
Jones potential was obta<strong>in</strong>ed <strong>in</strong> I from the London formula, 24<br />
<strong>and</strong> it is well-known that this approach tends to give smaller<br />
depths than others (like the Kirkwood-Muller 25,26 formula). In<br />
ref 27, it is shown that the London formula can give depths<br />
that are too small by a factor of 3. Moreover, these formulas<br />
model the attractive part of the potential. Here, it is the repulsive<br />
part that would need to be modeled accurately. As a test, we<br />
have redone the calculation with an <strong>in</strong>creased well depth (3 times<br />
larger), <strong>in</strong>creased oxygens radii (15% larger), <strong>and</strong> <strong>in</strong>creased force<br />
constants (20% larger). While the basic features of the energy<br />
l<strong>and</strong>scape are preserved with these parameters, albeit at higher<br />
energies, the local m<strong>in</strong>imum separat<strong>in</strong>g the b<strong>in</strong>d<strong>in</strong>g sites<br />
disappears. The results with this potential are denoted as “b” <strong>in</strong><br />
Table 2. The overall diffusion constant at 800 K agrees well<br />
with the experiment, but the ∆E q is now 3 times too large. For<br />
both sets of potential parameters, the factor D′ 800 is not well<br />
reproduced. This <strong>in</strong>dicates that both potentials fail to describe<br />
accurately the entropy loss as the lattice rearranges <strong>in</strong> the<br />
presence of the guest.<br />
In I, we noted that our potential model was only qualitative,<br />
but s<strong>in</strong>ce the typical energies were small, the accuracy was<br />
reasonable. Here, ma<strong>in</strong>ly because the energies are large, small<br />
changes <strong>in</strong> the potential parameters lead to large changes <strong>in</strong> D.<br />
An accurate potential model would be necessary for good<br />
agreement with the experiments. Of the limitations of our<br />
potential model are the facts that the repulsive part is poorly<br />
described, we have neglected all long-range <strong>in</strong>teractions, <strong>and</strong><br />
the lattice may start to show anharmonic effects consider<strong>in</strong>g<br />
the large displacements that are <strong>in</strong>duced by the guest. Note that<br />
there are certa<strong>in</strong>ly some sources of errors <strong>in</strong> the experiments<br />
com<strong>in</strong>g from surface effects, defects, impurities, <strong>and</strong> nanochan-<br />
8.2 -4.2<br />
nels, but Watson <strong>and</strong> Cherniak carefully checked that these were<br />
small <strong>and</strong>, <strong>in</strong> any event, cannot be used to expla<strong>in</strong> an O(10 7 )<br />
difference.<br />
VI. Discussion<br />
The effect of the crystal vibrations on the guest motion was<br />
also addressed <strong>in</strong> I, where we found that neglect<strong>in</strong>g the lattice<br />
vibrations <strong>in</strong>troduced only small errors for a system with small<br />
energy barriers. Here, we consider aga<strong>in</strong> the role of lattice<br />
vibrations. The effect of the crystal motion appears <strong>in</strong> several<br />
ways. First, at the level of the potential of mean force, allow<strong>in</strong>g<br />
the lattice to relax to a new equilibrium position <strong>in</strong> the presence<br />
of the guest (cf. eq 2.9) significantly reduces the energy barriers<br />
<strong>in</strong> W(z), for example, by 60kBT at 300 K <strong>and</strong> 18kBT at 800 K.<br />
As was mentioned before, this happens because the argon atom<br />
is always <strong>in</strong> the steep repulsive part of the closest lattice atoms<br />
before they are allowed to relax. Also note that the flexibility<br />
of the lattice is responsible for the temperature-dependent part<br />
of W(r).<br />
Second, aside from mean potentials, the question of the<br />
importance of the lattice vibrations on the guest dynamics can<br />
be addressed by compar<strong>in</strong>g the velocity autocorrelation functions<br />
for an argon atom released from a saddle po<strong>in</strong>t <strong>in</strong> our dynamic<br />
lattice <strong>and</strong> <strong>in</strong> an adiabatically equilibrated lattice. In the latter<br />
case, we mean that the lattice follows the guest adiabatically<br />
such that the net force on the lattice rema<strong>in</strong>s zero at all times.<br />
(0)<br />
This is achieved us<strong>in</strong>g an <strong>in</strong>itial RT that solves eq 2.9 <strong>and</strong><br />
(0)<br />
propagat<strong>in</strong>g RT <strong>in</strong> time accord<strong>in</strong>g to<br />
(0)<br />
dRT dt )-[ Keff + ∂2 (0)<br />
U(r,RT )<br />
(0)<br />
∂RT ∂RT<br />
(0) ]-1 ∂ 2 U(r,RT<br />
(0)<br />
∂RT ∂r<br />
In both simulations, the force felt by the guest is simply -∂U(r,<br />
(0)<br />
RT )/∂r [the temperature dependence of W(r) is ignored <strong>in</strong> the<br />
adiabatic lattice case <strong>and</strong> is implicit <strong>in</strong> the vibrat<strong>in</strong>g lattice case].<br />
The result is shown <strong>in</strong> Figure 7. The data shows that, for the<br />
(0) )<br />
dr<br />
dt<br />
(6.1)<br />
t<br />
Figure 7. Correlation function 〈V(t)V〉 <strong>and</strong> the <strong>in</strong>tegral ∫0 ds 〈V(s)V〉,<br />
shown for an argon atom start<strong>in</strong>g at a saddle po<strong>in</strong>t <strong>in</strong> an adiabatic,<br />
flexible, <strong>and</strong> frozen lattice simulation.
21340 J. Phys. Chem. B, Vol. 109, No. 45, 2005 <strong>Palmieri</strong> <strong>and</strong> <strong>Ronis</strong><br />
Figure 8. Distribution of positions along z of the 2000 trajectories as a function of time. The left figure is for the adiabatic case, while the right<br />
figure is for the unfrozen lattice.<br />
adiabatic lattice, the correlation time is much longer <strong>and</strong> the<br />
<strong>in</strong>tegral of 〈V(t)V〉 is larger compared with the case where the<br />
vibrations are <strong>in</strong>cluded.<br />
As mentioned <strong>in</strong> I, there are two mechanisms that contribute<br />
to the decay of 〈V(t)V〉. The first is r<strong>and</strong>omization of the velocity<br />
directions, while the second is guest energy transfer to <strong>and</strong> from<br />
the lattice vibrations. The results of Figure 7 suggest that, at<br />
least for our system, the energy exchange with the lattice is<br />
strong enough to shorten the velocity relaxation time, lead<strong>in</strong>g<br />
to a reduction <strong>in</strong> the overall diffusion rate. In I, we found the<br />
opposite, that is, that this energy exchange time scale was too<br />
long <strong>and</strong> did not contribute strongly to the decay of the velocity<br />
correlations.<br />
The behavior of 〈V(t)V〉 at short times is very different <strong>in</strong> the<br />
two cases. For the adiabatic case, the guest is <strong>in</strong>itially accelerated<br />
down the barrier, produc<strong>in</strong>g a peak at short times, while for the<br />
real calculation, the collisions with the r<strong>and</strong>omly mov<strong>in</strong>g lattice<br />
<strong>in</strong>itially slow the guest. In Figure 8, we show the distributions<br />
of positions along z <strong>in</strong>side the crystal as a function of time.<br />
From these figures, it is clear that the trapp<strong>in</strong>g of the guest <strong>in</strong><br />
b<strong>in</strong>d<strong>in</strong>g sites is much more efficient for the unfrozen lattice<br />
where energy exchange is possible. In the vibrat<strong>in</strong>g case, if the<br />
guest starts at a saddle po<strong>in</strong>t, it travels ma<strong>in</strong>ly to the nearest<br />
b<strong>in</strong>d<strong>in</strong>g sites, <strong>and</strong> only a small fraction go to second nearest<br />
b<strong>in</strong>d<strong>in</strong>g sites. It travels farther <strong>and</strong> with bigger proportion <strong>in</strong><br />
the adiabatic case.<br />
Also shown <strong>in</strong> Figure 7 is the velocity autocorrelation<br />
obta<strong>in</strong>ed from the simulation of the guest released at a saddle<br />
po<strong>in</strong>t <strong>in</strong> a completely rigid lattice where the crystal atoms are<br />
frozen at their guest-free, equilibrium lattice positions. The shorttime<br />
behavior shows a much stronger acceleration down the<br />
barrier; this is not surpris<strong>in</strong>g given the much larger barrier. In<br />
addition, we see higher frequency motions, <strong>in</strong>dicative of the<br />
rattl<strong>in</strong>g motion of the guest <strong>in</strong> the narrow rigid channel.<br />
In test<strong>in</strong>g the validity of TST, we observed that the temperature<br />
dependence predicted by TST is close to the one obta<strong>in</strong>ed<br />
from our method. The activation entropy, ∆S q , is also close for<br />
the two methods. This is not surpris<strong>in</strong>g, s<strong>in</strong>ce the energy<br />
l<strong>and</strong>scape that we have <strong>in</strong> this system comb<strong>in</strong>ed with the theory,<br />
compare to eq 2.2, gives much more importance to the saddle<br />
po<strong>in</strong>t region; TST only <strong>in</strong>cludes <strong>in</strong>formation at the saddle po<strong>in</strong>t<br />
Figure 9. Steepest descent path (blue) compared aga<strong>in</strong>st the average<br />
trajectories (black) as obta<strong>in</strong>ed from our simulations started at the highenergy<br />
saddle po<strong>in</strong>t.<br />
[which, of course, is determ<strong>in</strong>ed from the same free energy<br />
surface, W(r)].<br />
In Figure 9, we compare the steepest descent path, which is<br />
assumed to describe the dynamics <strong>in</strong> TST, aga<strong>in</strong>st simulated<br />
trajectories that start at the high energy saddle po<strong>in</strong>t <strong>and</strong> that<br />
are averaged under the condition that they end up <strong>in</strong> one of the<br />
two b<strong>in</strong>d<strong>in</strong>g sites (the black path <strong>in</strong> Figure 9). From this figure,<br />
we conclude that the steepest descent path accurately describes<br />
the motion for this system (the oscillations <strong>in</strong> the black curve<br />
are expla<strong>in</strong>ed by the fact that guest particles with k<strong>in</strong>etic energy<br />
cannot take the sharp turn <strong>in</strong> the steepest descent path). Note<br />
that, start<strong>in</strong>g from the saddle po<strong>in</strong>t, 98% of the trajectories end<br />
up <strong>in</strong> one of the two b<strong>in</strong>d<strong>in</strong>g sites (almost <strong>in</strong> a 1:1 ratio). The<br />
rema<strong>in</strong>der either get trapped <strong>in</strong> the local m<strong>in</strong>imum or go to<br />
farther b<strong>in</strong>d<strong>in</strong>g sites. These observations, comb<strong>in</strong>ed with the<br />
fact that the permeabilities obta<strong>in</strong>ed from transition state theory<br />
are systematically lower, tells us that someth<strong>in</strong>g is still miss<strong>in</strong>g<br />
<strong>in</strong> TST (note that the TST transmission coefficient, <strong>in</strong> this case,<br />
is close to unity, <strong>and</strong> <strong>in</strong> any event, <strong>in</strong>clud<strong>in</strong>g it would only make<br />
the agreement worse). This is surpris<strong>in</strong>g s<strong>in</strong>ce TST usually gives
<strong>Diffusion</strong> <strong>in</strong> Channeled Structures J. Phys. Chem. B, Vol. 109, No. 45, 2005 21341<br />
∞<br />
Figure 10. Factor ∫0 dt 〈Vz(t1)Vz〉r e-[W(r)-W(z)] <strong>in</strong> the maximum W(z)<br />
plane where an area of 2.757 × 3.46 Å is shown.<br />
an upper bound to Smoluchowski processes (cf. ref 28). The<br />
difference cannot be expla<strong>in</strong>ed from the cooperative motion of<br />
the guest <strong>and</strong> the lattice atoms s<strong>in</strong>ce, as shown <strong>in</strong> Figure 7, the<br />
vibrations tend to reduce the diffusion. One possible explanation<br />
of the discrepancy between TST <strong>and</strong> our calculation is the<br />
follow<strong>in</strong>g. First recall that D0 is obta<strong>in</strong>ed from the plane average<br />
∞<br />
of ∫0 dt 〈Vz(t1)Vz〉r e-[W(r)-W(z)] . This factor is shown <strong>in</strong> Figure<br />
10 for the W(z) maximum energy plane (which is very close to<br />
the plane that conta<strong>in</strong>s the saddle po<strong>in</strong>t). In the context of TST,<br />
this factor is assumed to be harmonic with the maximum at the<br />
saddle po<strong>in</strong>t. It is clear from the figure that the harmonic<br />
approximation is not accurate. In conclusion, TST seems to more<br />
effectively describe the averaged diffusion process <strong>in</strong> our large<br />
energy barriers system (18kBT at 300 K) than it did <strong>in</strong> I for<br />
smaller energy barriers (2kBT at 300 K), although the assumption<br />
about what regions of phase space contribute to the diffusion<br />
process is still wrong.<br />
Most experiments (cf. refs 18 <strong>and</strong> 21) claim that the preexponential<br />
factor, D′, as def<strong>in</strong>ed <strong>in</strong> eq 5.7, does not appreciably<br />
change with temperature. The prefactor is directly proportional<br />
to D0 <strong>and</strong> the nonideal corrections appear<strong>in</strong>g <strong>in</strong> eq 5.4. By<br />
assum<strong>in</strong>g the gas is ideal <strong>in</strong> the bulk <strong>and</strong> that the saddle-po<strong>in</strong>t<br />
curvatures are <strong>in</strong>dependent of temperature, TST predicts that<br />
D0 ∝ T3/2 , compare to eq 4.2. This is not supported by the data,<br />
compare to Table 1, s<strong>in</strong>ce there is significant temperature<br />
dependence <strong>in</strong> the curvatures. Indeed, the TST results are welldescribed<br />
by a T1.28 power law, while our method predicts T1.1 ,<br />
albeit with larger deviations. In both models, the temperature<br />
dependence is clear, but this effect is very hard to see <strong>in</strong> an<br />
Arrhenius plot (cf. Figure 5) <strong>and</strong> would be even harder to see<br />
<strong>in</strong> a real experiment given the large error bars reported for D′.<br />
In conclusion, we have shown that the driv<strong>in</strong>g forces for the<br />
diffusion of a guest <strong>in</strong> a large energy barrier system are different<br />
than <strong>in</strong> I where we considered a small energy barrier system.<br />
The permeability is very sensitive to the accuracy of the<br />
activation energy, <strong>and</strong> that of the underly<strong>in</strong>g potential model,<br />
<strong>and</strong> to the flexibility of the lattice. For a more accurate<br />
evaluation of the permeabilities, a potential model that describes<br />
the repulsive <strong>in</strong>teractions better, result<strong>in</strong>g <strong>in</strong> a more negative<br />
activation entropy, would be required. The goal of this work<br />
was to establish what phenomena contribute to the prefactor,<br />
<strong>and</strong> we have shown that the prefactor depends on the cooperative<br />
motion between the guest <strong>and</strong> the lattice. This effect is absent<br />
<strong>in</strong> TST <strong>and</strong> all frozen lattice or adiabatically equilibrated lattice<br />
simulations <strong>and</strong> can lead to non-negligible errors <strong>in</strong> systems<br />
with large energy barriers <strong>and</strong> concomitantly large forces.<br />
Acknowledgment. First <strong>and</strong> foremost, we thank the organizers<br />
of this Festschrift honor<strong>in</strong>g Irw<strong>in</strong> Oppenheim for <strong>in</strong>vit<strong>in</strong>g<br />
us to take part. Irw<strong>in</strong> has been a mentor <strong>and</strong> friend for many<br />
years, is <strong>in</strong>terested <strong>in</strong> all aspects of science, <strong>and</strong> has played an<br />
important role <strong>in</strong> help<strong>in</strong>g many young scientists get started. That<br />
he has done all this while, at the same time, rema<strong>in</strong><strong>in</strong>g a decent<br />
<strong>and</strong> gentle man is someth<strong>in</strong>g we should all strive to emulate.<br />
We thank the <strong>McGill</strong>’s Center for the Physics of Materials for<br />
the use of the Beowulf cluster <strong>and</strong>, <strong>in</strong> particular, Dr. Juan<br />
Gallego for help<strong>in</strong>g us with several parallel process<strong>in</strong>g issues.<br />
We also thank the Natural Sciences <strong>and</strong> Eng<strong>in</strong>eer<strong>in</strong>g Research<br />
Council of Canada for support<strong>in</strong>g this work. F<strong>in</strong>ally, one of us<br />
(B.P.) thanks the Fonds de recherche sur la nature et les<br />
technologies for support.<br />
References <strong>and</strong> Notes<br />
(1) <strong>Palmieri</strong>, B.; <strong>Ronis</strong>, D. Phys. ReV. E: Stat. Phys., Plasmas, Fluids,<br />
Relat. Interdiscip. Top. 2003, 68, 046127.<br />
(2) Vertenste<strong>in</strong>, M.; <strong>Ronis</strong>, D. J. Chem. Phys. 1986, 85, 1628.<br />
(3) <strong>Ronis</strong>, D.; Bedeaux, B.; Oppenheim, I. Physica A 1978, 90, 487.<br />
(4) Mehra, V.; Basra, R.; Khanna, M.; Chakravarty, C. J. Phys. Chem.<br />
B 1999, 103, 2740.<br />
(5) Mossell, T.; Schrimpf, G.; Brickmann, J. J. Phys. Chem. B 1997,<br />
101, 9476.<br />
(6) Mossell, T.; Schrimpf, G.; Brickmann, J. J. Phys. Chem. 1996, 100,<br />
4582.<br />
(7) Demontis, P.; Stara, G.; Suffritti, G. B. J. Chem. Phys. 2004, 120,<br />
9233.<br />
(8) Kopelevich, D. I.; Chang, H.-C. J. Chem. Phys. 2001, 114, 3776.<br />
(9) Demontis, P.; Suffritti, G. B.; Fois, E. S.; Quartieri, S. J. Phys.<br />
Chem. 1992, 96, 1482.<br />
(10) Suffritti, G. B.; Demontis, P.; Ciccotti, G. J. Chem. Phys. 2003,<br />
118, 3439.<br />
(11) Demontis, P.; Suffritti, G.; Bordiga, S.; Buzzoni, R. J. Chem. Soc.,<br />
Faraday Trans. 1995, 91, 525.<br />
(12) Vertenste<strong>in</strong>, M.; <strong>Ronis</strong>, D. J. Chem. Phys. 1987, 87, 5457.<br />
(13) Deutch, J. M.; Silbey, R. Phys. ReV. A: At., Mol., Opt. Phys. 1971,<br />
3, 2049.<br />
(14) Rickwardt, C.; Nielaba, P.; Müser, M. H.; B<strong>in</strong>der, K. Phys. ReV.<br />
B: Solid State 2001, 63, 045204.<br />
(15) Schober, H.; Strauch, D.; Nützel, K.; Dorner, B. J. Phys.: Condens.<br />
Matter 1993, 5, 6155.<br />
(16) Striefler, M. E.; Barsch, R. Phys. ReV. B: Solid State 1975, 12,<br />
4553.<br />
(17) Kloeden, P. E.; Platen, E. Numerical Solutions of Stochastic<br />
Differential Equations; Spr<strong>in</strong>ger-Verlag: Berl<strong>in</strong>, 1994.<br />
(18) Watson, E. B.; Cherniak, D. J. Geochim. Cosmochim. Acta 2003,<br />
67, 2043.<br />
(19) Chu, W.-K.; Mayer, J. W.; Nicolet, M.-A. Backscatter<strong>in</strong>g Spectrometry;<br />
Academic Press: New York, 1978.<br />
(20) Hansen, J. P.; McDonald, I. R. Theory of simple liquids; Academic<br />
Press: London, 1976.<br />
(21) Carroll, M. R.; Stolper, E. M. Geochim. Cosmochim. Acta 1991,<br />
55, 211.<br />
(22) Cherniak, D. J. Earth Planet. Sci. Lett. 2003, 214, 655.<br />
(23) Béj<strong>in</strong>a, F.; Jaoul, O. Phys. Earth Planet. Inter. 1996, 97, 145.<br />
(24) London, F. Z. Phys. Chem. B 1930, 11, 222.<br />
(25) Kirkwood, J. G. Phys. Z. 1932, 33, 57.<br />
(26) Muller, H. R. Proc. R. Soc. London, Ser. A 1936, 154, 624.<br />
(27) Barrer, R. M.; Peterson, D. L. Proc. R. Soc. London, Ser. A. 1964,<br />
280, 466.<br />
(28) Ch<strong>and</strong>rasekhar, S. ReV. Mod. Phys. 1943, 15, 1.