Measuring Nanoparticle Exposure - Application Note NSAM-001 - TSI
Measuring Nanoparticle Exposure - Application Note NSAM-001 - TSI
Measuring Nanoparticle Exposure - Application Note NSAM-001 - TSI

Create successful ePaper yourself
Turn your PDF publications into a flip-book with our unique Google optimized e-Paper software.
MEASURING<br />
NANOPARTICLE<br />
EXPOSURE<br />
APPLICATION NOTE <strong>NSAM</strong>-<strong>001</strong><br />
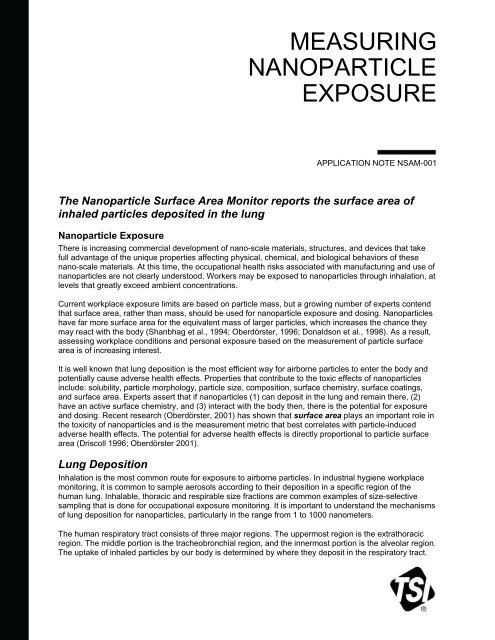
The <strong>Nanoparticle</strong> Surface Area Monitor reports the surface area of<br />
inhaled particles deposited in the lung<br />
<strong>Nanoparticle</strong> <strong>Exposure</strong><br />
There is increasing commercial development of nano-scale materials, structures, and devices that take<br />
full advantage of the unique properties affecting physical, chemical, and biological behaviors of these<br />
nano-scale materials. At this time, the occupational health risks associated with manufacturing and use of<br />
nanoparticles are not clearly understood. Workers may be exposed to nanoparticles through inhalation, at<br />
levels that greatly exceed ambient concentrations.<br />
Current workplace exposure limits are based on particle mass, but a growing number of experts contend<br />
that surface area, rather than mass, should be used for nanoparticle exposure and dosing. <strong>Nanoparticle</strong>s<br />
have far more surface area for the equivalent mass of larger particles, which increases the chance they<br />
may react with the body (Shanbhag et al., 1994; Oberdörster, 1996; Donaldson et al., 1998). As a result,<br />
assessing workplace conditions and personal exposure based on the measurement of particle surface<br />
area is of increasing interest.<br />
It is well known that lung deposition is the most efficient way for airborne particles to enter the body and<br />
potentially cause adverse health effects. Properties that contribute to the toxic effects of nanoparticles<br />
include: solubility, particle morphology, particle size, composition, surface chemistry, surface coatings,<br />
and surface area. Experts assert that if nanoparticles (1) can deposit in the lung and remain there, (2)<br />
have an active surface chemistry, and (3) interact with the body then, there is the potential for exposure<br />
and dosing. Recent research (Oberdörster, 2<strong>001</strong>) has shown that surface area plays an important role in<br />
the toxicity of nanoparticles and is the measurement metric that best correlates with particle-induced<br />
adverse health effects. The potential for adverse health effects is directly proportional to particle surface<br />
area (Driscoll 1996; Oberdörster 2<strong>001</strong>).<br />
Lung Deposition<br />
Inhalation is the most common route for exposure to airborne particles. In industrial hygiene workplace<br />
monitoring, it is common to sample aerosols according to their deposition in a specific region of the<br />
human lung. Inhalable, thoracic and respirable size fractions are common examples of size-selective<br />
sampling that is done for occupational exposure monitoring. It is important to understand the mechanisms<br />
of lung deposition for nanoparticles, particularly in the range from 1 to 1000 nanometers.<br />
The human respiratory tract consists of three major regions. The uppermost region is the extrathoracic<br />
region. The middle portion is the tracheobronchial region, and the innermost portion is the alveolar region.<br />
The uptake of inhaled particles by our body is determined by where they deposit in the respiratory tract.
The figure below shows the various regions of the human lung and is the model used by the International<br />
Commission of Radiological Protection (ICRP) and the U.S. Environmental Protection Agency (US EPA)<br />
to define and characterize human lung deposition.<br />
Based on International Commission of Radiological Protection (1994) and U.S. Environmental Protection Agency<br />
(1996a). Air Quality Criteria for Particulate matter, 2004, p 6-5.<br />
In 1966, the ICRP developed a comprehensive lung deposition model for radioactive aerosols. Several<br />
parameters are required to construct the model including the breathing rate, lung volume, activity,<br />
nose/mouth breathing, and others. The deposition curves (for tracheobronchial and alveolar deposition)<br />
derived from the model vary based on these parameters. For industrial hygiene applications, Robert<br />
Phalen (Particle Size-Selective Sampling for Particulate Air Contaminants, (1999), Ed. James H. Vincent,<br />
American Conference for Governmental Industrial Hygienists (ACGIH), Cincinnati, OH) developed a<br />
definition for a reference worker that is used to derive the deposition curves. The reference worker is<br />
defined as follows:<br />
Physiological Parameters<br />
Subject = Adult male<br />
Functional Residual Capacity = 2200 cc<br />
Extra-Thoracic Dead Space = 50 cc<br />
Bronchial Dead Space = 49 cc<br />
Bronchiolar Dead Space = 47 cc<br />
Height = 175 cm<br />
Tracheal Diameter = 1.65 cm<br />
First Bronchial Diameter= 0.165 cm<br />
-2-
Other parameters considered in the model include the following:<br />
Activity Related Parameters<br />
Activity level = Light exercise<br />
Activity Type = Nose breathing only<br />
Ventilation Rate = 1.3 m 3 /hr<br />
Respiratory Frequency = 15.0 breaths/minute<br />
Tidal Volume = 1450 cc<br />
Volumetric Flow Rate = 725 cc/sec<br />
Fraction Breathed through Nose = 1.0<br />
Aerosol Parameters<br />
Activity Mean Aerodynamic Diameter = 0.<strong>001</strong> µm – 0.5 µm<br />
Geometric Standard Deviation = 1.0<br />
Density = 1.0 g/cc<br />
Shape Factor = 1.0<br />
The following curves for tracheobronchial and alveolar lung deposition are based on the reference worker<br />
parameters and the ICRP model.<br />
The tracheobronchial deposition curve represents the fraction of aerosol that deposits in the<br />
tracheobronchial region of the lung and the alveolar deposition curve represents the fraction of the<br />
aerosol that deposits in the alveolar region of the lung.<br />
As discussed, for exposure assessment applications it is common to sample aerosols relevant to their<br />
deposition in a specific region of the human lung. This is often referred to as size-selective health hazard<br />
sampling. The criterion for size-selective sampling depends on the aerosol being sampled. For example,<br />
for coal dust, the health effects relate to the deposition deep in the alveolar regions of the lung, so the<br />
respirable fraction of the aerosol is the metric of interest. In contrast, the throracic fraction of the aerosol is<br />
of interest for sampling cotton dust.<br />
-3-
The Instrument, the Measurement, and Calibration<br />
The patented Model 3550 <strong>Nanoparticle</strong> Surface Area Monitor * indicates the human lung-deposited<br />
surface area of particles in units of square micrometers per cubic centimeter (µm 2 /cc), corresponding to<br />
tracheobronchial (TB) and alveolar (A) regions of the lung.<br />
The Instrument<br />
The Model 3550 is based on diffusion charging of sampled particles, followed by detection of the charged<br />
aerosol using an electrometer. Using an integral pump, an aerosol sample is drawn into the instrument<br />
through a cyclone with a 1 micrometer (µm) cut point. The sample flow is split, with one stream going<br />
through a set of carbon and HEPA filters and an ionizer to introduce positively charged ions into the a<br />
mixing chamber. The other aerosol flow stream is mixed with the ionized stream in a mixing chamber and<br />
charged aerosol and excess ions move onto an ion trap. The instrument can be switched between<br />
sampling for the tracheobronchial (TB) and alveolar (A) fractions of the total aerosol. This is achieved by<br />
changing the ion trap voltage to either the tracheobronchial (TB) or alveolar (A) response settings. The<br />
ion trap essentially acts as an inlet conditioner or a size-selective sampler for the electrometer, by<br />
collecting the excess ions and particles that are not of a charge state (i.e., surface area/size)<br />
corresponding to the tracheobronchial or alveolar response settings. The aerosol then moves on to the<br />
electrometer for charge measurement. In the electrometer, current is passed from the particles to a<br />
conductive filter and measured by a very sensitive amplifier. The charge measured by the electrometer is<br />
directly proportional to the surface area of the particles passing through the electrometer. A<br />
microprocessor controls the instrument flows and measures various operational parameters and converts<br />
the measurement output into units of square micrometers per cubic centimeter (µm 2 /cm 3 ). While the<br />
Model 3550’s performance is well characterized up to 400 nanometers, the instrument’s response for<br />
larger particles is not as clearly understood.<br />
The Measurement<br />
The Model 3550, when set to either tracheobronchial (TB) or alveolar (A) response settings, matches the<br />
corresponding lung deposition criteria of particles for a reference worker as predicted by human lung<br />
deposition models published by the International Commission on Radiological Protection (ICRP, 1995).<br />
The lung deposition is calculated for a reference worker as defined in a publication by the American<br />
Conference of Governmental Industrial Hygienists (ACGIH, ed. Vincent J.H., 1999).<br />
The Model 3550 does not measure the total active surface area (i.e., Fuch’s surface area) of particles<br />
suspended in air. It indicates the surface area of the fraction of these particles that deposit in either the<br />
tracheobronchial or alveolar regions of the human respiratory tract. The ion trap voltages are optimized to<br />
correspond to the ICRP model-based tracheobronchial and alveolar lung deposition curves, and the<br />
Model 3550 indicates the lung deposited surface area, not the total active surface area of the aerosol<br />
sampled. The current measured by the electrometer downstream of the ion trap in the Model 3550, when<br />
set to either tracheobronchial or alveolar response settings, correlates well with the calculated value of<br />
deposited surface area of particles in these respective regions of the lung as shown in the following<br />
figure.<br />
*U.S. Patents 6,544,484 and 7,812,306<br />
-4-
<strong>NSAM</strong> Current (pA)<br />
0.8<br />
0.7<br />
0.6<br />
0.5<br />
0.4<br />
0.3<br />
0.2<br />
0.1<br />
Surface Surafec Area of of Particles<br />
R 2 = 0.9967<br />
-5-<br />
R 2 = 0.9834<br />
Alveolar Region<br />
0.0<br />
0 50 100 150 200 250 300<br />
Deposited Surface Area (µm 2 /cm 3 )<br />
Tracheobronchial Region<br />
Calibration<br />
The Model 3550 is calibrated using a sodium chloride (NaCl) solution. Typically, atomizing a low<br />
concentration 0.01% sodium chloride solution is adequate to generate an aerosol with size distribution<br />
centered at 60 nm. The classifier assembly, consisting of a <strong>TSI</strong> Model 3080 + <strong>TSI</strong> Model 3081 Long DMA<br />
is then used to classify the poly-dispersed sodium chloride aerosol to generate monodispersed 80 nm<br />
particles that are used to calibrate the Model 3550. The calibration setup is shown in the figure below.<br />
The Model 3550 calibration constant is determined by running the monodispersed aerosol simultaneously<br />
between the SMPS and the Model 3550. The total surface area of the 80 nm particles determined by the<br />
SMPS is then multiplied by the lung deposition efficiency of 80 nm particles as determined by the ICRP<br />
lung deposition curve for a reference worker. This is the lung deposited surface area for 80 nm particles<br />
as determined by the SMPS. A ratio of the Model 3550’s response to SMPS determined lung deposited<br />
surface area is the calibration factor. This method is used for both the tracheobronchial (TB) and the<br />
alveolar (A) deposition by changing the Model 3550’s response and using the appropriate ICRP lung<br />
deposition efficiency curve. The resulting calibration factors for tracheobronchial (TB) and alveolar (A) are<br />
programmed into the Model 3550.<br />
The verification of the Model 3550 for tracheobronchial (TB) and alveolar (A) response settings are<br />
performed using polydispersed sodium chloride solution. Instead of classifying the sodium chloride<br />
aerosol, the entire size distribution is used for comparing the Model 3550’s response with the SMPS. The<br />
SMPS obtained surface area distribution is multiplied by the ICRP curves (for TB and A) obtained for the<br />
entire size range of interest, which gives the total lung deposited surface area. This number is then
compared with the Model 3550 reading averaged over the entire period of SMPS sampling. They must be<br />
within ±10% (for TB and A) for the Model 3550 to pass calibration and verification testing.<br />
<strong>Application</strong>s<br />
The Model 3550 provides a simple and fast solution for indicating the surface area equivalent dose of<br />
particles in the size range of 10 to 1000 nanometers. The Model 3550 is well suited for the following<br />
applications:<br />
• Monitoring workplace exposure to nanoparticles<br />
o Industrial hygiene surveys<br />
o Ambient work area monitoring<br />
o Baseline screening and trending<br />
o Engineering studies<br />
• Material science and production process monitoring<br />
• Inhalation toxicology research studies<br />
• Epidemiology research studies<br />
Theory of Operation<br />
The Model 3550 is based on diffusion charging of sampled particles, followed by detection of the charged<br />
aerosol using an electrometer. An aerosol sample is drawn into the instrument continuously at a rate of<br />
2.5 L/min. The flow is split with 1 L/min passing through two filters (a carbon and a HEPA) and an ionizer<br />
and 1.5 L/min of aerosol sample flow.<br />
The flow streams are merged in a mixing chamber where particles in the aerosol flow mix with the ions<br />
carried by the filtered clean air. This patented counter-flow diffusion charging ** brings the aerosol particles<br />
into a defined, charged state. The separation of particles from direct interaction with the corona needle<br />
and/or the strong field near it reduces particle loss and makes the charging process more efficient and<br />
reproducible. The charged aerosol then passes through an ion trap to remove excess ions and charged<br />
aerosol. The aerosol then moves on to an electrometer for charge measurement. In the electrometer,<br />
current is passed from the particles to a conductive filter and measured by a very sensitive amplifier. A<br />
microprocessor controls the instrument flows and measures various operational parameters and converts<br />
the measurement output into units of square micrometers per cubic centimeter (µm 2 /cc 3 ).<br />
** U.S. Patent No. 6,544,484<br />
-6-
<strong>TSI</strong> Incorporated – Visit our website www.tsi.com for more information.<br />
USA Tel: +1 800 874 2811<br />
UK Tel: +44 149 4 459200<br />
France Tel: +33 4 91 11 87 64<br />
Germany Tel: +49 241 523030<br />
India Tel: +91 80 67877200<br />
China Tel: +86 10 8251 6588<br />
Singapore Tel: +65 6595 6388<br />
<strong>NSAM</strong>-<strong>001</strong> Rev. C ©2012 <strong>TSI</strong> Incorporated Printed in U.S.A.