Download - UNESCO Deutschland
Download - UNESCO Deutschland
Download - UNESCO Deutschland

Create successful ePaper yourself
Turn your PDF publications into a flip-book with our unique Google optimized e-Paper software.
outdoor climate data and observed damages<br />
have been collected. The list of case<br />
study buildings will be continuously updated<br />
and further extended. In several<br />
case studies in situ investigations of<br />
existing problems are carried out which<br />
will then be used for the projection of future<br />
challenging issues using whole<br />
building simulation models and different<br />
situ monitoring technologies. In situ<br />
measurements by laser speckle interferometry<br />
and 3D microscopy have been<br />
already successfully applied at the test<br />
site in Holzkirchen (Germany) and show<br />
good complementarity. Further investigations<br />
by glass dosimeters to assess the<br />
impact of indoor and outdoor conditions<br />
at cultural heritage sites throughout Europe<br />
will allow a much more precise and<br />
integrated assessment of the real damage<br />
impact of climate change on cultural heritage<br />
at regional scale. In terms of climatization<br />
of historic buildings a survey of<br />
the state of the art has been finalized and<br />
will be used to develop appropriate mitigation<br />
/ adaptation strategies with special<br />
emphasis on energy efficiency. All these<br />
results will be finally incorporated into<br />
the assessment of the economic costs and<br />
impacts – for the first time economists<br />
will calculate the impact of climate<br />
change on the maintenance costs of<br />
Cultural Heritage sites. The thusly identified<br />
risks and the economic consequences<br />
for European Cultural Heritage will be<br />
communicated to policy makers, together<br />
with possible mitigation strategies to be<br />
included in future IPCC Reports.<br />
More information available at<br />
www.climateforculture.eu<br />
Dr. Johanna Leissner works as a scientific<br />
representative in the institute Fraunhofer<br />
at the European Union in Brussels.<br />
geRMaNy – a FORWaRd-lOOkiNg PaRtNeR FOR WORld HeRitage CHalleNges<br />
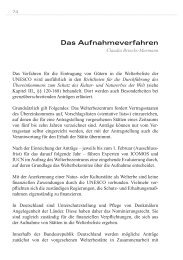
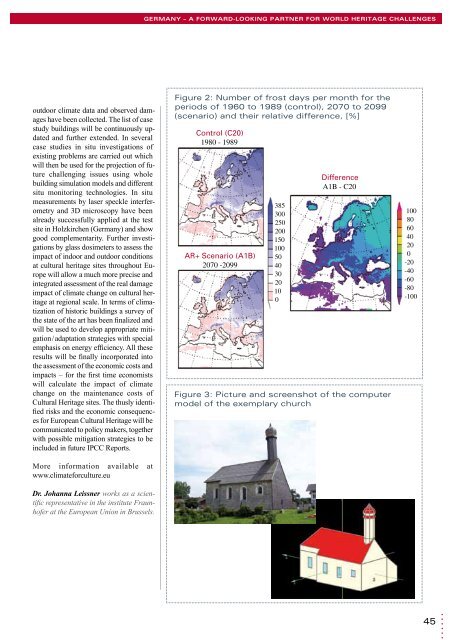
Figure 2: Number of frost days per month for the<br />
periods of 1960 to 1989 (control), 2070 to 2099<br />
(scenario) and their relative difference, [%]<br />
Control (C20)<br />
1980 - 1989<br />
AR+ Scenario (A1B)<br />
2070 -2099<br />
385<br />
300<br />
250<br />
200<br />
150<br />
100<br />
50<br />
40<br />
30<br />
20<br />
10<br />
0<br />
Difference<br />
A1B - C20<br />
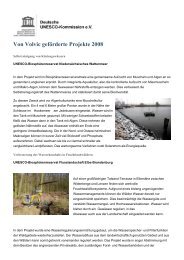
Figure 3: Picture and screenshot of the computer<br />
model of the exemplary church<br />
100<br />
80<br />
60<br />
40<br />
20<br />
0<br />
-20<br />
-40<br />
-60<br />
-80<br />
-100<br />
45