EPI DATA BRIEF - Louisville Metro Government
EPI DATA BRIEF - Louisville Metro Government
EPI DATA BRIEF - Louisville Metro Government

Create successful ePaper yourself
Turn your PDF publications into a flip-book with our unique Google optimized e-Paper software.
Dr. LaQuandra Nesbitt, Director<br />
Office of Policy Planning and Evaluation November 2012, No. 1<br />
Health Behavioral Outcomes for Adolescents and Young Adults in<br />
<strong>Louisville</strong> <strong>Metro</strong><br />
DEMOGRAPHICS<br />
In 2010, more than one-third of the total population for <strong>Louisville</strong> <strong>Metro</strong> was 24 years of age<br />
and under (239,630). i<br />
Fifty one percent were male and 49% were female.<br />
According to 2010 American Community Survey estimates, there were 157,619 White,<br />
61,448 African American and 12,666 Hispanic/Latino individuals 24 years of age and under<br />
living in Jefferson County. ii<br />
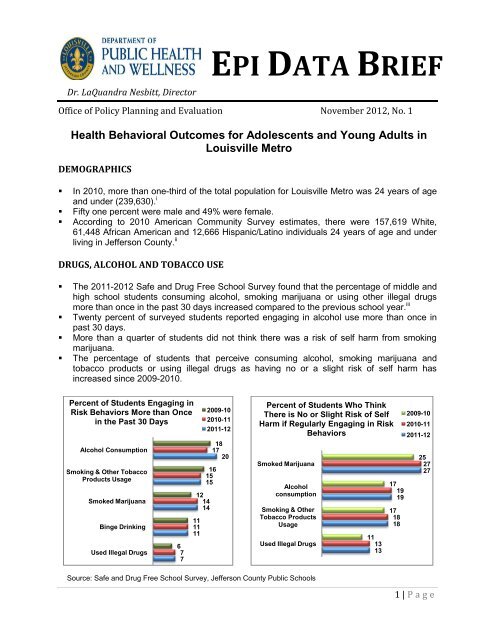
DRUGS, ALCOHOL AND TOBACCO USE<br />
The 2011-2012 Safe and Drug Free School Survey found that the percentage of middle and<br />
high school students consuming alcohol, smoking marijuana or using other illegal drugs<br />
more than once in the past 30 days increased compared to the previous school year. iii<br />
Twenty percent of surveyed students reported engaging in alcohol use more than once in<br />
past 30 days.<br />
More than a quarter of students did not think there was a risk of self harm from smoking<br />
marijuana.<br />
The percentage of students that perceive consuming alcohol, smoking marijuana and<br />
tobacco products or using illegal drugs as having no or a slight risk of self harm has<br />
increased since 2009-2010.<br />
Percent of Students Engaging in<br />
Risk Behaviors More than Once<br />
in the Past 30 Days<br />
Alcohol Consumption<br />
Smoking & Other Tobacco<br />
Products Usage<br />
Smoked Marijuana<br />
Binge Drinking<br />
Used Illegal Drugs<br />
6<br />
7<br />
7<br />
12<br />
14<br />
14<br />
11<br />
11<br />
11<br />
2009-10<br />
2010-11<br />
2011-12<br />
18<br />
17<br />
20<br />
16<br />
15<br />
15<br />
Smoked Marijuana<br />
Alcohol<br />
consumption<br />
Smoking & Other<br />
Tobacco Products<br />
Usage<br />
Used Illegal Drugs<br />
Source: Safe and Drug Free School Survey, Jefferson County Public Schools<br />
<strong>EPI</strong> <strong>DATA</strong> <strong>BRIEF</strong><br />
Percent of Students Who Think<br />
There is No or Slight Risk of Self<br />
Harm if Regularly Engaging in Risk<br />
Behaviors<br />
11<br />
13<br />
13<br />
17<br />
19<br />
19<br />
17<br />
18<br />
18<br />
2009-10<br />
2010-11<br />
2011-12<br />
25<br />
27<br />
27<br />
1 | P a g e
TEEN BIRTHS<br />
In 2010, the estimated<br />
birth rate to teenage<br />
females between 15 to 19<br />
years of age in <strong>Louisville</strong><br />
<strong>Metro</strong> was 41.4 per 1,000<br />
females.<br />
This rate was lower than<br />
the state (46.2) but higher<br />
than the national rate.<br />
(34.2).<br />
Females 19 years of age<br />
and under had the highest<br />
rates of low birth weight<br />
births in 2010 (12.7%).<br />
COMMUNICABLE DISEASES<br />
Source: 2010 Vital Statistics Jefferson County Preliminary Birth Records, Kentucky<br />
Department for Public Health; 2010 National Vital statistics Final Report, U.S.<br />
Centers for Disease Control and Prevention<br />
From 2007 to 2011, more than half of all Gonorrhea and Chlamydial infections reported were<br />
seen in individuals that were less than 25 years of age.<br />
The reported incidence of Chlamydial infections has more than doubled among this age group<br />
and increased by 60% for Gonorrhea infections during the same time period.<br />
From 2010 to 2011, the incidence rates among Blacks under the age of 25 increased by 23%<br />
for Gonorrhea and 21% for Chlamydia.<br />
For Whites under the age of 25 the incidence rates for Gonorrhea increased by 27% and 18%<br />
for Chlamydia during the same time period.<br />
528<br />
605<br />
1512<br />
1225<br />
<strong>Louisville</strong> <strong>Metro</strong><br />
Source: Kentucky Department for Public Health<br />
2915<br />
Source: KY Department for Public Health<br />
2404<br />
90<br />
Kentucky<br />
114<br />
USA<br />
LM White<br />
LM Black<br />
Birth Rates per 1,000 Females<br />
15-19 Years of Age by Race, 2010<br />
Trends of Gonorrhea and Chlamydia Incidence Rates<br />
per 100,000 Population Under 25 Year Age, Jefferson<br />
County/<strong>Louisville</strong> <strong>Metro</strong><br />
1427<br />
1568<br />
Total Black White Total Black White<br />
Gonorrhea Chlamydia<br />
Gonorrhea Chlamydia<br />
27.8<br />
34.2<br />
369<br />
2010<br />
2011<br />
435<br />
41.4<br />
46.2<br />
2 | P a g e<br />
60.8<br />
0.0 16.0 32.0 48.0 64.0
NUTRITION AND PHYSICAL ACTIVITY<br />
Of all high school students participating in the Youth Risk Behavioral Surveillance Survey<br />
(YRBS), 37% reported being physically active for at least an hour per day or more over the<br />
past 7 days.<br />
Twenty percent of female and 14% male high school students reported not being physically<br />
active in the past week.<br />
17<br />
Percentage of Students Participating in Physical Activities,<br />
2010<br />
Not Physically Active in past 7 days<br />
Physically active for at least 60 minutes per day on five or more of the past 7 days<br />
37<br />
Source: Community Putting Prevention to Work Youth Risk Behavior Surveillance Survey,<br />
Jefferson County Public Schools<br />
Seventeen percent of high school students reported consuming fruits and vegetables<br />
5 or more times per day in the past week.<br />
Twenty percent of male students and 14% of female students reported consuming 5<br />
or more fruits and vegetables.<br />
Percentage of Students Consuming Fruits and Vegetables<br />
5 or More Times Within the Past<br />
Week, 2010<br />
17<br />
14<br />
48<br />
20<br />
20<br />
All Students Male Female White Black<br />
14 14<br />
All Students Male Female White Black<br />
Source: Community Putting Prevention to Work Youth Risk Behavior Surveillance<br />
Survey, Jefferson County Public Schools<br />
26<br />
15<br />
41<br />
21<br />
21<br />
31<br />
3 | P a g e
INJURY AND VIOLENCE<br />
Unintentional injuries,<br />
assault (homicide) and<br />
motor vehicle crashes are<br />
the top three leading<br />
causes of death among<br />
adolescents and young<br />
adults in <strong>Louisville</strong> <strong>Metro</strong>.<br />
The assault (homicide)<br />
death rate for Blacks<br />
(12.2) is more than eight<br />
times that for Whites<br />
(1.5).<br />
i<br />
9.4<br />
Age-Adjusted Death Rate per 100,000<br />
Population for 24 Years Age and Under by<br />
Race, 2009<br />
<strong>Louisville</strong><br />
<strong>Metro</strong><br />
8.2<br />
12.9<br />
U.S. Census Bureau. (2010). Retrieved 2012 from American Factfinder at:<br />
http://factfinder2census.gov/faces/nav/jsf/pages/index.xhtml.<br />
ii American Community survey, U.S. Census Bureau. (2010). Retrieved 2012 from American Factfinder at:<br />
http://factfinder2.census.gov/faces/tableservices/jsf/pages/productview.xhtml?pid=ACS_10_3YR_S0201&<br />
prodType=table<br />
3.5<br />
3.8<br />
3.2<br />
4.1<br />
1.5<br />
12.2<br />
2.0<br />
White<br />
Black<br />
Unintentional injuries Motor vehicle crash Assault (Homicide) Suicide<br />
Source: 2009 Vital Statistics Final Death Records, Kentucky Department for Public Health<br />
Race/Ethnicity: For purposes of this report, specific terms of reference were selected. For race categories, the terms “White”<br />
and “Black” are used. Hispanic refers to an ethnic category and not one race. However, the ethnic category of Hispanic and<br />
other race categories, such as Asian/Pacific Islander and American Indian, were not included in this analysis due to limited<br />
sample size yielding unreliable data results.<br />
Data Sources: Sources include vital statistics obtained from Kentucky Department for Public Health; U.S. Census, U.S.<br />
Centers for Disease Control and Prevention (CDC); Jefferson County Public Schools and data collected and maintained at<br />
<strong>Louisville</strong> <strong>Metro</strong> Department of Public Health and Wellness (LMPHW).<br />
Result findings from the Safe and Drug-free School Survey (SDFS) were conducted in Jefferson County Public School district<br />
during the school years 2009-10, 2010-11 and 2011-12. The numbers of responses were more than 100,000 for three years<br />
combined and include students from grades 6-12. Every year the data is collected from different cohorts. The total sample<br />
size for each school year 2009-10, 2010-11 and 2011-12 was 31,647, 35,708 and 39,904 respectively. The following<br />
conclusions were drawn from the comparison of three years survey results. These results should be interpreted with caution<br />
as they may be impacted by total sample size for each year, response rates, size of the school and other issues.<br />
The Youth Risk Behavior Surveillance Survey (YRBS) was conducted as a part of Communities Putting Prevention to Work<br />
(CPPW) grant among 9th to 12 th grade students from selected Jefferson County Public Schools in 2011.<br />
Produced by: Office of Policy Planning and Evaluation, LMPHW<br />
For more information contact 502-574-8270 or visit the LMPHW website at: www.louisvilleky.gov/health.<br />
2.0<br />
4 | P a g e<br />
1.9