
Create successful ePaper yourself
Turn your PDF publications into a flip-book with our unique Google optimized e-Paper software.
Research Analysts<br />
Jack Yeung<br />
852 2101 6779<br />
jack.yeung@credit-suisse.com<br />
Contribution by<br />
Alex Yang<br />
<strong>China</strong> <strong>Auto</strong> <strong>Sector</strong><br />
INITIATION<br />
Selectively accumulate in 2013<br />
08 January 2013<br />
Asia Pacific/<strong>China</strong><br />
Equity Research<br />
<strong>Auto</strong>mobile Manufacturers<br />
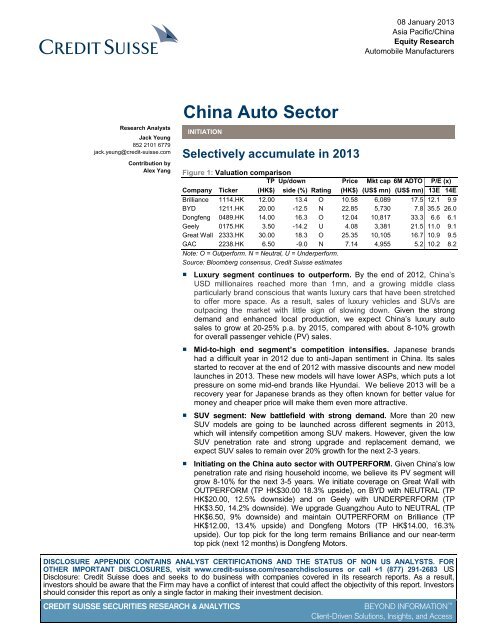
Figure 1: Valuation comparison<br />
TP Up/down Price Mkt cap 6M ADTO P/E (x)<br />
Company Ticker (HK$) side (%) Rating (HK$) (US$ mn) (US$ mn) 13E 14E<br />
Brilliance 1114.HK 12.00 13.4 O 10.58 6,089 17.5 12.1 9.9<br />
BYD 1211.HK 20.00 -12.5 N 22.85 5,730 7.8 35.5 26.0<br />
Dongfeng 0489.HK 14.00 16.3 O 12.04 10,817 33.3 6.6 6.1<br />
Geely 0175.HK 3.50 -14.2 U 4.08 3,381 21.5 11.0 9.1<br />
Great Wall 2333.HK 30.00 18.3 O 25.35 10,105 16.7 10.9 9.5<br />
GAC 2238.HK 6.50 -9.0 N 7.14 4,955 5.2 10.2 8.2<br />
Note: O = Outperform. N = Neutral, U = Underperform.<br />
Source: Bloomberg consensus, Credit Suisse estimates<br />
■ Luxury segment continues to outperform. By the end of 2012, <strong>China</strong>’s<br />
USD millionaires reached more than 1mn, and a growing middle class<br />
particularly brand conscious that wants luxury cars that have been stretched<br />
to offer more space. As a result, sales of luxury vehicles and SUVs are<br />
outpacing the market with little sign of slowing down. Given the strong<br />
demand and enhanced local production, we expect <strong>China</strong>’s luxury auto<br />
sales to grow at 20-25% p.a. by 2015, compared with about 8-10% growth<br />
for overall passenger vehicle (PV) sales.<br />
■ Mid-to-high end segment’s competition intensifies. Japanese brands<br />
had a difficult year in 2012 due to anti-Japan sentiment in <strong>China</strong>. Its sales<br />
started to recover at the end of 2012 with massive discounts and new model<br />
launches in 2013. These new models will have lower ASPs, which puts a lot<br />
pressure on some mid-end brands like Hyundai. We believe 2013 will be a<br />
recovery year for Japanese brands as they often known for better value for<br />
money and cheaper price will make them even more attractive.<br />
■ SUV segment: New battlefield with strong demand. More than 20 new<br />
SUV models are going to be launched across different segments in 2013,<br />
which will intensify competition among SUV makers. However, given the low<br />
SUV penetration rate and strong upgrade and replacement demand, we<br />
expect SUV sales to remain over 20% growth for the next 2-3 years.<br />
■ Initiating on the <strong>China</strong> auto sector with OUTPERFORM. Given <strong>China</strong>’s low<br />
penetration rate and rising household income, we believe its PV segment will<br />
grow 8-10% for the next 3-5 years. We initiate coverage on Great Wall with<br />
OUTPERFORM (TP HK$30.00 18.3% upside), on BYD with NEUTRAL (TP<br />
HK$20.00, 12.5% downside) and on Geely with UNDERPERFORM (TP<br />
HK$3.50, 14.2% downside). We upgrade Guangzhou <strong>Auto</strong> to NEUTRAL (TP<br />
HK$6.50, 9% downside) and maintain OUTPERFORM on Brilliance (TP<br />
HK$12.00, 13.4% upside) and Dongfeng Motors (TP HK$14.00, 16.3%<br />
upside). Our top pick for the long term remains Brilliance and our near-term<br />
top pick (next 12 months) is Dongfeng Motors.<br />
DISCLOSURE APPENDIX CONTAINS ANALYST CERTIFICATIONS AND THE STATUS OF NON US ANALYSTS. FOR<br />
OTHER IMPORTANT DISCLOSURES, visit www.credit-suisse.com/researchdisclosures or call +1 (877) 291-2683 US<br />
Disclosure: Credit Suisse does and seeks to do business with companies covered in its research reports. As a result,<br />
investors should be aware that the Firm may have a conflict of interest that could affect the objectivity of this report. Investors<br />
should consider this report as only a single factor in making their investment decision.<br />
CREDIT SUISSE SECURITIES RESEARCH & ANALYTICS BEYOND INFORMATION <br />
Client-Driven Solutions, Insights, and Access
Focus charts and table<br />
Figure 2: Growth of <strong>China</strong> auto sales by segment Figure 3: Foreign brands’ PV market share in <strong>China</strong><br />
60%<br />
50%<br />
40%<br />
30%<br />
20%<br />
10%<br />
0%<br />
-10%<br />
2004 2006 2008 2010 2012E 2014E 2016E 2018E 2020E<br />
<strong>Auto</strong> sales YoY % PV sales YoY % CV sales YoY %<br />
Source: CAAM, Credit Suisse estimates Source: CAAM<br />
08 January 2013<br />
0%<br />
Jan-09 Oct-09 Jul-10 Apr-11 Jan-12 Nov-12<br />
<strong>China</strong> <strong>Auto</strong> <strong>Sector</strong> 2<br />
25%<br />
20%<br />
15%<br />
10%<br />
5%<br />
Japanese German American<br />
Korean French<br />
Figure 4: Luxury PV sales in <strong>China</strong> Figure 5: SUV sales as % of <strong>China</strong>’s PV sales<br />
'000 Units<br />
2,500<br />
2,000<br />
1,500<br />
1,000<br />
500<br />
0<br />
181<br />
39%<br />
22%<br />
252<br />
25%<br />
7%<br />
314<br />
53%<br />
76%<br />
1,551<br />
1,877<br />
2,252<br />
33%<br />
29%<br />
718<br />
1,272<br />
42%<br />
1,017<br />
25%<br />
5% 7%<br />
22% 21% 20%<br />
10% 10%<br />
407<br />
9%<br />
2006 2007 2008 2009 2010 2011 2012E 2013E 2014E 2015E<br />
Luxury PV sales (LHS) Luxury PV sales YoY (RHS)<br />
Total PV sales YoY (RHS)<br />
Source: Roland Berger, Credit Suisse estimates Source: CAAM<br />
100%<br />
80%<br />
60%<br />
40%<br />
20%<br />
0%<br />
-20%<br />
Figure 6: Valuation comparison of major listed automakers<br />
16%<br />
14%<br />
12%<br />
10%<br />
8%<br />
6%<br />
4%<br />
2%<br />
0%<br />
Jan/04 Oct/05 Jul/07 Apr/09 Jan/11 Oct/12<br />
SUV sales as % of PV sales<br />
Upside/ Share Market Dividend<br />
Company Ticker TP downside price cap P/E (x) P/B (x) yield (%) ROE (%)<br />
(HK$) (%) (HK$) (US$mn) 11 12E 13E 14E 11 12E 13E 14E 11 12E 13E 14E 11 12E 13E 14E<br />
Brilliance 1114.HK 12.00 13.4 10.58 6,089 19.7 14.8 12.1 9.9 7.6 5.7 4.3 3.3 - 0.0 0.1 0.3 27.2 29.4 28.6 26.6<br />
BYD 1211.HK 20.00 -12.5 22.85 5,730 26.3 77.6 35.5 26.0 2.1 2.0 1.9 1.8 - 0.0 0.0 0.1 7.0 1.7 4.1 5.0<br />
Dongfeng Motors 0489.HK 14.00 16.3 12.04 10,817 8.0 9.6 6.6 6.1 2.2 1.9 1.7 1.4 1.5 1.3 1.5 1.6 25.0 17.6 18.0 17.3<br />
Geely 0175.HK 3.50 -14.2 4.08 3,381 16.1 12.9 11.0 9.1 2.6 2.3 1.9 1.7 0.7 0.9 1.1 1.3 18.6 17.1 17.6 17.3<br />
Great Wall Motor 2333.HK 30.00 18.3 25.35 10,105 16.3 12.7 10.9 9.5 3.8 3.0 2.5 2.1 1.4 1.9 2.1 2.4 25.6 24.9 23.3 21.6<br />
Guangzhou <strong>Auto</strong> 2238.HK 6.50 -9.0 7.14 4,955 7.8 15.0 10.2 8.2 1.5 1.4 1.3 1.2 2.8 1.5 2.2 2.6 15.6 8.3 10.5 12.1<br />
Mkt cap–wtd avg 16.0 22.4 13.7 11.1 3.6 2.9 2.4 2.0 0.9 1.0 1.2 1.3 22.1 19.1 19.0 18.1<br />
Source: Bloomberg consensus
Selectively accumulate<br />
PV growth remains solid in 2013<br />
<strong>China</strong>’s low auto penetration rate and strong income growth will further its growth in the<br />
passenger vehicles (PV) segment in the next 3-5 years. Low-tier cities and inland regions<br />
have lower-than-average auto penetration rates, higher income growth rate as well as<br />
higher GDP growth; we believe they will become major auto markets in the next 5-10<br />
years. Although automakers are expanding capacity aggressively, their overall utilization<br />
rate is still above 70%. <strong>Auto</strong>makers also have the flexibility to adjust their capacity plans to<br />
meet real demand growth.<br />
SUV segment: New battlefield with strong demand<br />
<strong>China</strong>’s sports utility vehicle (SUV) segment has maintained strong sales growth in recent<br />
years despite slowing PV sales in 2011 and 2012. Over 20 new SUV models are planned<br />
to be launched in 2013 across all segments. We expect competition within the SUV<br />
segment to intensify, as most JV players are equally competitive. However, we note that<br />
rising upgrade and replacement demand will mainly benefit the mid-to-low end SUV<br />
segment. We expect Great Wall to maintain its leadership in this segment due to lack of<br />
strong competitors.<br />
Mid-to-high end segment: Intensifying competition<br />
Due to anti-Japan protests in <strong>China</strong> in 2012, Japanese brands had a difficult year last year.<br />
Its sales started to recover at the end of 2012 with massive discounts and new model<br />
launches in 2013 in hoping to regain some of its lost market share. These new models will<br />
have lower ASPs, which will put a lot pressure on some of the mid-end brands like Korean<br />
brands. With cheaper price, we believe sales of Japanese brands will recover significantly<br />
in 2013 as they often known for better value for money.<br />
Luxury segment: Rising along with wealth in <strong>China</strong><br />
<strong>China</strong>’s luxury auto segment is still in its early growth stage, with a low penetration rate.<br />
We believe growing wealth will drive the country’s luxury auto sales. We also expect<br />
strong waves of replacement purchases to support luxury auto sales in the next 3-5 years.<br />
Many luxury brands have launched their economy models with prices close to the mid-tohigh<br />
end. We believe these models will become strong engines for luxury auto sales and<br />
help luxury automakers to gain market share from mid- to high-end players.<br />
Valuation and stock picks<br />
We are initiating <strong>China</strong> <strong>Auto</strong> <strong>Sector</strong> with OUTPERFORM given <strong>China</strong>’s low penetration<br />
rate and rising household income. We initiate on Great Wall Motor with an OUTPERFORM<br />
(TP HK$30.00 based on 13x 2013E EPS) given its leading position in <strong>China</strong>’s SUV<br />
segment. For BYD, we initiate with NEUTRAL, (TP HK$20.00 based on a sum-of-the-parts<br />
valuation) as we believe its electric cars are yet to be commercialized. We initiate<br />
coverage on Geely with an UNDERPERFORM (TP HK$3.50 based on 10x 2013E EPS)<br />
as we believe it will face competition from JV brands moving toward low-end segment as it<br />
tries to move upward. We upgrade Guangzhou <strong>Auto</strong> to NEUTRAL from<br />
UNDERPERFORM (TP HK$6.50 based on 10x 2013E EPS) given recovering Japanese<br />
auto sales. Brilliance remains OUTPERFORM (TP HK$12.00, based on 14x 2013E EPS)<br />
as our long term top pick for the sector and Dongfeng Motors maintains OUTPERFORM,<br />
(TP HK$14.00, based on 9x 2013E EPS) as our near term (12 month) top pick for the<br />
sector.<br />
08 January 2013<br />
<strong>China</strong>’s low auto penetration<br />
rate and strong income<br />
growth will further its PV<br />
growth in the next 3-5 years<br />
We expect competition in<br />
the SUV segment to<br />
intensify but demand to<br />
remain strong<br />
Japanese brands’ new<br />
models in 2013 would help<br />
them to regain market share<br />
but intensify competition in<br />
mid-to-high end segment<br />
We believe rising wealth in<br />
<strong>China</strong> will continue to drive<br />
luxury auto sales<br />
We are positive on sector<br />
growth and initiate coverage<br />
on Great Wall Motor, BYD,<br />
and Geely. Brilliance and<br />
Dongfeng Motors remain<br />
our top picks<br />
<strong>China</strong> <strong>Auto</strong> <strong>Sector</strong> 3
<strong>Sector</strong> valuation comparison<br />
Figure 7: <strong>Auto</strong> sector valuation table<br />
Share Dividend<br />
08 January 2013<br />
Ticker price Mkt cap P/E (x) P/B (x) yield (%) ROE (%)<br />
Company (local ccy) (US$ mn) 11 12E 13E 14E 11 12E 13E 14E 11 12E 13E 14E 11 12E 13E 14E<br />
H share automakers<br />
Brilliance <strong>China</strong> <strong>Auto</strong> 1114.HK 10.58 6,089 19.7 14.8 12.1 9.9 7.6 5.7 4.3 3.3 - 0.0 0.1 0.3 27.2 29.4 28.6 26.6<br />
BYD 1211.HK 22.85 5,730 26.3 77.6 35.5 26.0 2.1 2.0 1.9 1.8 - 0.0 0.0 0.1 7.0 1.7 4.1 5.0<br />
Dongfeng Motors 0489.HK 12.04 10,817 8.0 9.6 6.6 6.1 2.2 1.9 1.7 1.4 1.5 1.3 1.5 1.6 25.0 17.6 18.0 17.3<br />
Geely 0175.HK 4.08 3,381 16.1 12.9 11.0 9.1 2.6 2.3 1.9 1.7 0.7 0.9 1.1 1.3 18.6 17.1 17.6 17.3<br />
Great Wall Motor 2333.HK 25.35 10,105 16.3 12.7 10.9 9.5 3.8 3.0 2.5 2.1 1.4 1.9 2.1 2.4 25.6 24.9 23.3 21.6<br />
Guangzhou <strong>Auto</strong> 2238.HK 7.14 4,955 7.8 15.0 10.2 8.2 1.5 1.4 1.3 1.2 2.8 1.5 2.2 2.6 15.6 8.3 10.5 12.1<br />
Qingling Motors 1122.HK 2.05 599 11.1 11.7 10.2 9.9 0.6 0.6 0.6 0.6 7.1 6.4 6.9 7.0 4.9 4.6 5.1 5.5<br />
Sinotruk 3808.HK 6.2 1,632 11.1 29.4 13.9 10.1 0.8 0.8 0.8 0.8 1.6 1.1 1.4 1.6 5.4 2.8 3.8 5.0<br />
Weichai Power Co. 2338.HK 35.8 8,295 10.1 14.8 12.3 11.0 2.6 2.0 1.8 1.6 0.3 0.6 0.6 0.7 27.0 14.0 14.6 14.3<br />
Mkt cap–wtd avg 14.0 20.6 13.1 10.8 3.1 2.5 2.1 1.8 1.1 1.1 1.3 1.4 21.5 16.5 16.8 16.3<br />
Global automakers<br />
Honda Motor 7267 3270 65,635 10.4 20.4 9.4 7.9 1.3 1.3 1.3 1.2 1.7 1.8 2.3 2.6 12.2 4.8 10.1 10.7<br />
Nissan Motor 7201 854 36,558 9.1 10.3 9.9 6.6 1.2 1.1 1.0 0.9 1.2 2.3 2.9 3.5 11.3 11.2 10.9 11.9<br />
Toyota Motor 7203 4260 136,134 24.2 35.0 14.0 9.4 1.3 1.3 1.2 1.1 1.2 1.2 1.7 2.2 3.9 2.7 7.9 9.1<br />
Mitsubishi Motors 7211 94 4,995 32.3 21.1 23.1 8.6 (2.6) (2.9) 1.8 1.5 - - - 0.7 6.7 9.7 13.0 20.0<br />
Mitsubishi Corp 8058 1710 31,839 5.8 5.9 7.6 6.7 0.9 0.8 0.8 0.7 3.8 3.8 3.1 3.5 14.8 13.5 9.7 10.7<br />
Mazda Motor 7261 185 7,488 (3.1) (2.6) 45.8 10.5 0.8 1.2 1.2 1.1 - - - 0.5 1.9 6.2<br />
Hyundai Motor 005380.KS 206000 40,975 7.9 6.4 5.6 5.1 1.2 1.2 1.0 0.9 0.8 0.9 1.0 1.0 22.8 21.7 19.3 17.6<br />
Kia Motors 000270.KS 53600 22,181 6.8 5.7 5.3 4.6 1.6 1.3 1.0 0.8 1.1 1.2 1.3 1.4 29.1 27.4 23.0 20.8<br />
Ford Motor Co. F.N 13.46 52,711 7.3 8.4 8.0 6.4 3.4 2.7 2.3 1.9 0.4 1.7 1.8 2.2 85.3 33.0 28.4 27.9<br />
General Motors Corp. GM.N 29.82 39,918 6.6 7.8 6.6 5.2 1.5 1.3 1.1 - 0.2 0.4 18.7 18.6 19.9<br />
Fiat FIA.MI 3.946 6,112 12.9 7.6 4.9 3.4 0.6 0.5 0.5 0.4 - 1.4 2.2 3.9 3.6 5.3 8.8 12.3<br />
BMW AG BMWG.DE 75.61 57,409 9.7 8.4 9.2 8.0 1.6 1.4 1.3 3.0 3.5 3.6 3.9 20.5 17.1 15.6 14.7<br />
Porsche <strong>Auto</strong> PSHG_p.DE 63.19 9,911 6.2 4.5 4.0 0.6 0.6 0.5 0.4 1.2 1.9 2.6 5.6 20.2 10.8 10.4<br />
Daimler DAIGn.DE 42.455 49,794 7.6 8.9 7.4 7.5 1.1 1.0 0.9 5.2 5.0 4.9 5.3 15.5 12.5 12.4 13.0<br />
Mkt cap–wtd avg 12.1 15.9 9.9 7.4 1.1 1.4 1.3 1.1 1.7 2.0 2.2 2.6 18.4 13.2 13.8 14.2<br />
Source: Bloomberg consensus<br />
Figure 8: Comparison within our coverage—P/E vs RoE Figure 9: Comparison within our coverage—P/E vs P/B<br />
2013E ROE (%)<br />
35.0<br />
30.0<br />
25.0<br />
20.0<br />
15.0<br />
10.0<br />
5.0<br />
-<br />
Dongfeng<br />
Motors<br />
Brilliance<br />
Great Wall<br />
Motor<br />
Geely<br />
Guangzhou<br />
<strong>Auto</strong><br />
BYD<br />
- 10.0 20.0<br />
2013E P/E (x)<br />
30.0 40.0<br />
Dongfeng<br />
Motors<br />
Source: Bloomberg consensus Source: Bloomberg consensus<br />
Brilliance<br />
Great Wall<br />
Motor<br />
<strong>China</strong> <strong>Auto</strong> <strong>Sector</strong> 4<br />
2013E P/B (x)<br />
5.0<br />
4.0<br />
3.0<br />
2.0<br />
1.0<br />
-<br />
Geely<br />
Guangzhou<br />
<strong>Auto</strong><br />
BYD<br />
- 10.0 20.0<br />
2013E P/E (x)<br />
30.0 40.0
Table of contents<br />
Selectively accumulate ........................................................................................................ 3<br />
PV growth remains solid in 2013 ..................................................................................... 3<br />
SUV segment: New battlefield with strong demand ........................................................ 3<br />
Mid-to-high end segment: Intensifying competition ......................................................... 3<br />
Luxury segment: Rising along with wealth in <strong>China</strong> ........................................................ 3<br />
Valuation and stock picks ................................................................................................ 3<br />
<strong>Sector</strong> valuation comparison ........................................................................................... 4<br />
PV growth remains solid in 2013 ......................................................................................... 6<br />
Low penetration rate suggests high growth potential ...................................................... 6<br />
Income growth is driving auto sales ................................................................................ 8<br />
Growing demand in low-tier cities and inland regions ..................................................... 9<br />
Risks of oversupply ....................................................................................................... 10<br />
SUV segment: New battlefield with strong demand........................................................... 11<br />
Low SUV penetration rate with strong sales ................................................................. 11<br />
Upgrade and replacement demand to boost sales ....................................................... 12<br />
New model launches to intensify competition ............................................................... 13<br />
Limited competition in mid-to-low end segment ............................................................ 16<br />
Mid-to-high end segment: Intensifying competition ........................................................... 17<br />
Slowdown of PV sales ................................................................................................... 17<br />
Intensifying competition in PV segment ........................................................................ 18<br />
Japanese brands to regain market share in 2013 ......................................................... 19<br />
Low-end segment is under pressure ............................................................................. 20<br />
Luxury segment: Rising alone with wealth in <strong>China</strong> .......................................................... 23<br />
Low luxury auto penetration rate ................................................................................... 23<br />
Growing wealth strengthens luxury auto demand ......................................................... 23<br />
Replacement demand drives luxury auto sales ............................................................ 24<br />
Proliferation of economy models ................................................................................... 25<br />
Restrictive policies won’t hurt luxury segment .............................................................. 28<br />
Great Wall Motor (2333.HK / 2333 HK) ............................................................................ 29<br />
BYD Co Ltd (1211.HK / 1211 HK) .................................................................................... 44<br />
Geely <strong>Auto</strong>mobile Holdings Ltd (0175.HK / 175 HK) ......................................................... 62<br />
Guangzhou <strong>Auto</strong>mobile Group (2238.HK / 2238 HK) ........................................................ 80<br />
Dongfeng Motors Group Co Ltd (0489.HK / 489 HK) ........................................................ 83<br />
Brilliance <strong>China</strong> <strong>Auto</strong>motive Holding (1114.HK / 1114 HK) ............................................... 86<br />
08 January 2013<br />
<strong>China</strong> <strong>Auto</strong> <strong>Sector</strong> 5
PV growth remains solid in 2013<br />
Low penetration rate suggests high growth potential<br />
<strong>China</strong>’s auto penetration rate (number of vehicles owned by per 1,000 people) was around<br />
69 in 2011, much lower than mature auto markets such as Japan and Korea, Germany,<br />
and the US (Figure 10). It is also lower than the world’s average of around 140. Given<br />
<strong>China</strong>’s GDP per capita already exceeded US$5,000 in 2011, we believe its reasonable<br />
auto penetration rate is around 100 (Figure 10). However, most provincial regions in <strong>China</strong><br />
have penetrations rate below 100 (Figure 11), suggesting high potential for auto sales<br />
growth.<br />
Figure 10: 2011 auto penetration rate by country<br />
900<br />
800<br />
700<br />
600<br />
500<br />
400<br />
300<br />
200<br />
100<br />
(No. of autos per<br />
1,000 people)<br />
<strong>China</strong> (69)<br />
United states (815)<br />
Japan (622)<br />
Korea (381)<br />
Germany (567)<br />
0<br />
GDP per capita (USD)<br />
100 1,000 10,000 100,000<br />
Source: United Nation Statistics, Ward <strong>Auto</strong>, CEIC, IMF, Credit Suisse estimates<br />
Figure 11: 2011 <strong>China</strong> auto penetration rate by region<br />
250<br />
200<br />
150<br />
100<br />
50<br />
No. of autos / 1,000<br />
persons<br />
GDP per capita (RMB)<br />
0<br />
10,000 20,000 30,000 40,000 50,000 60,000 70,000 80,000 90,000<br />
Source: CEIC, Credit Suisse estimates<br />
Zhejiang<br />
08 January 2013<br />
<strong>China</strong> <strong>Auto</strong> <strong>Sector</strong> 6<br />
Beijing<br />
Tianjin<br />
Shanghai<br />
<strong>China</strong>’s auto penetration<br />
rate is much lower than<br />
mature auto markets,<br />
suggesting high growth<br />
potential for auto sales
We plot the GDP per capita and auto penetration rate of more than 100 countries in Figure<br />
10. We find auto penetration rates generally grow with GDP per capita and follow an Sshaped<br />
curve. We note that <strong>China</strong> is entering a stage of high growth on this S curve<br />
(Figure 10). We also note that growth of <strong>China</strong>’s GDP per capita and its auto penetration<br />
from 2000-11 has generally followed the trend for Korea over 1978-89 (Figure 12). We<br />
expect <strong>China</strong> to continue to follow Korea’s growth trends of 1990-98 between 2012 and<br />
2020. According to International Monetary Fund (IMF) estimates, <strong>China</strong>’s GDP per capita<br />
is likely to exceed US$9,500 in 2017, similar to Korea’s in 1994 when Korea’s auto<br />
penetration rate reached 167. We assume <strong>China</strong>’s auto penetration rate will reach 160 in<br />
2017. Then we use Korea’s auto penetration rate for 1990-98 as a proxy to simulate<br />
<strong>China</strong>’s penetration rate over 2012-20 (Figure 12). This suggests <strong>China</strong>’s total number of<br />
autos would reach around 200 mn units in 2016 and its annual auto sales growth rate<br />
would be maintained at around 10% by 2015 then 8-9% up to 2020 (Figure 13 and Figure<br />
14).<br />
Figure 12: Growth of GDP per capita and auto penetration rate<br />
USD<br />
25,000<br />
20,000<br />
15,000<br />
10,000<br />
5,000<br />
-<br />
Korea<br />
1978-1989 1990-1998<br />
-<br />
1978 1981 1984 1987 1990 1993 1996 1999 2002 2005 2008 2011<br />
GDP per capita (LHS) <strong>Auto</strong> penetration rate (RHS)<br />
Source: World Bank, IMF, Credit Suisse estimates<br />
No. of vehilces<br />
per 1,000 people<br />
450<br />
400<br />
350<br />
300<br />
250<br />
200<br />
150<br />
100<br />
50<br />
08 January 2013<br />
-<br />
2000 2005 2010 2015E 2020E<br />
<strong>China</strong> <strong>Auto</strong> <strong>Sector</strong> 7<br />
USD<br />
15,000<br />
12,000<br />
9,000<br />
6,000<br />
3,000<br />
-<br />
<strong>China</strong><br />
2000-2011 2012-2000<br />
GDP per capita (LHS) <strong>Auto</strong> penetration rate (RHS)<br />
Figure 13: Growth of auto sales and auto population Figure 14: Growth of auto sales by segment<br />
('000 units)<br />
350,000<br />
300,000<br />
250,000<br />
200,000<br />
150,000<br />
100,000<br />
50,000<br />
-<br />
-<br />
2004 2006 2008 2010 2012E 2014E 2016E 2018E 2020E<br />
<strong>Auto</strong> sales (RHS) Total No. of autos (LHS)<br />
('000 units)<br />
40,000<br />
35,000<br />
30,000<br />
25,000<br />
20,000<br />
15,000<br />
10,000<br />
5,000<br />
60%<br />
50%<br />
40%<br />
30%<br />
20%<br />
10%<br />
0%<br />
-10%<br />
No. of vehilces<br />
per 1,000 people<br />
2004 2006 2008 2010 2012E 2014E 2016E 2018E 2020E<br />
<strong>Auto</strong> sales YoY % PV sales YoY % CV sales YoY %<br />
Source: CAAM, Credit Suisse estimates Source: CAAM, Credit Suisse estimates<br />
We expect <strong>China</strong>’s annual<br />
auto sales growth rate to be<br />
around 10% by 2015 and 8-<br />
9% up to 2020<br />
250<br />
200<br />
150<br />
100<br />
50
Income growth is driving auto sales<br />
We expect <strong>China</strong>’s auto sales to exceed 19 mn units in 2012, representing a 2005-12<br />
CAGR of more than 20%. This remarkable growth was mainly driven by a fast-growing<br />
domestic economy and rising individual incomes, with real GDP growing by around 10%<br />
p.a. from 2005-11 and Chinese disposable incomes per capita also growing by double<br />
digits. According to the National Bureau of Statistics, <strong>China</strong>’s disposable income per capita<br />
for urban residents in 1H12 increased 13.3% YoY to Rmb13,679 or US$2,183, faster than<br />
1H11’s 11.2%. During the same period, cash income per capita for rural residents<br />
increased 16.1% to Rmb4,303 or US$687, much faster than the growth of disposable<br />
income per capita for urban residents. With this rise in income, <strong>China</strong>’s middle class—<br />
defined as individuals earning more than Rmb50,000 or US$7,978 annually—doubled<br />
2006’s scale of about 12% of the country’s total population in 2010 and may account for<br />
about 45% of the total population by 2020 (Figure 15). We believe the emergence of<br />
<strong>China</strong>’s middle class is the power engine that will drive <strong>China</strong>’s auto sales in the next few<br />
years.<br />
Figure 15: Growth of middle class in <strong>China</strong> Figure 16: Income growth of Chinese households<br />
200<br />
180<br />
160<br />
140<br />
120<br />
100<br />
80<br />
60<br />
40<br />
20<br />
-<br />
million<br />
1952 1978 1988 1991 1999 2004 2008 2020E<br />
Number of middle class household or higher (LHS)<br />
Share of middle class & higher (RHS)<br />
%<br />
45<br />
40<br />
35<br />
30<br />
25<br />
20<br />
15<br />
10<br />
5<br />
-<br />
income YoY<br />
25%<br />
Source: CEIC, Credit Suisse estimates Source: CEIC<br />
Figure 17: Income distribution of Chinese urban households<br />
%<br />
16<br />
14<br />
12<br />
10<br />
8<br />
6<br />
4<br />
2<br />
0<br />
10 15 20 25 30 35 40 45 50 55 60 65 70 75 80 85 90 95 100<br />
2005 2007 2009 2011<br />
Source: National Bureau of Statistics, CEIC<br />
RMB '000<br />
08 January 2013<br />
<strong>China</strong> <strong>Auto</strong> <strong>Sector</strong> 8<br />
20%<br />
15%<br />
10%<br />
%<br />
20<br />
18<br />
16<br />
14<br />
12<br />
10<br />
5%<br />
0%<br />
-5%<br />
8<br />
6<br />
4<br />
2<br />
0<br />
1997 1999 2001 2003 2005 2007 2009 2011<br />
2.1<br />
3.0<br />
Urban household Rural household<br />
4.5<br />
We believe strong income<br />
growth and rising middle<br />
class will be major engines<br />
for <strong>China</strong>’s auto sales<br />
7.5<br />
9.5<br />
12.2<br />
18.1<br />
2005 2006 2007 2008 2009 2010 2011<br />
Share of urban households with annual income > RMB100,000
Growing demand in low-tier cities and inland regions<br />
The number of <strong>China</strong>’s urban residents exceeded rural residents for the first time in 2011.<br />
The Chinese government was anticipating an urbanization rate of 51.5% by 2015E, which<br />
seems to have been easily realized in 2012. Tier 2 and 3 cities are the major engine of<br />
<strong>China</strong>’s urbanization. Tier 2 cities accounted for around 16% of the country’s population,<br />
but generated about 30% of total GDP and consumed over half of its foreign direct<br />
investment (Figure 18). The GDP growth rate of Tier 2 cities is about 2% higher than the<br />
whole economy in 2011 (Figure 19). We estimate that new car sales in Tier 2 cities will<br />
grow more than 10% p.a. by 2015. This rate would be 5-8% higher in Tier 3 cities, but less<br />
than 5% in Tier 1 cities, mainly due to auto restrictive policies. Moreover, <strong>China</strong>’s inland<br />
regions have lower auto penetration rates, but higher income (indicated by GDP per capita)<br />
growth rates than the national average (Figure 20 and Figure 21). We believe auto sales<br />
growth in these regions will also be faster than other parts of <strong>China</strong>.<br />
08 January 2013<br />
Figure 18: GDP contribution of Tier 1 and 2 cities Figure 19: GDP growth rates of Tier 1 and 2 cities<br />
100%<br />
90%<br />
80%<br />
70%<br />
60%<br />
50%<br />
40%<br />
30%<br />
20%<br />
10%<br />
0%<br />
65% 64% 63% 62%<br />
23% 23% 24% 23%<br />
60% 60% 60% 60% 60% 58% 58%<br />
26% 26% 26% 27% 27% 30% 30%<br />
12% 13% 13% 14% 14% 14% 14% 13% 13% 12% 12%<br />
2001 2002 2003 2004 2005 2006 2007 2008 2009 2010 2011<br />
Tier-1 cties Tier-2 cities Other cities<br />
<strong>China</strong> <strong>Auto</strong> <strong>Sector</strong> 9<br />
30%<br />
25%<br />
20%<br />
15%<br />
10%<br />
5%<br />
2,002 2,003 2,004 2,005 2,006 2,007 2,008 2,009 2,010 2,011<br />
<strong>China</strong> total Tier-1 cties Tier-2 cities<br />
Source: CREIS, CEIC, Credit Suisse estimates Source: CREIS, CEIC, Credit Suisse estimates<br />
Figure 20: PV penetration rate (number of PV per 1,000<br />
persons) by region<br />
National average = 55.3<br />
Figure 21: 2005-11 CAGR of GDP per capita by region<br />
National average = 16.3%<br />
Source: CEIC, Credit Suisse estimates Source: CEIC, Credit Suisse estimates<br />
We believe auto sales<br />
growth in low-tier cities and<br />
inland regions will be faster<br />
than the national average
Risks of oversupply<br />
The return to strong growth in Chinese vehicle sales has prompted a wave of investment<br />
in new capacity. It has raised concerns that the industry could be left with a supply glut<br />
when sales growth slows following the end of government incentive schemes. The<br />
National Development and Reform Commission (NDRC) estimated that the industry was<br />
using 80% of its installed capacity in 2011, while we expect this to drop to about 75% in<br />
2012 and less than 70% by 2013. Compared with JVs, domestic brands seem to be more<br />
aggressive on capacity expansion (Figure 22 and Figure 23). They also have much lower<br />
capacity utilization rates (Figure 24 and Figure 25). We expect domestic brands to be<br />
more rational facing the slowdown of demand in the low-end segment. As most new<br />
capacities are still being planned, there would be sufficient time for them to adjust their<br />
capacity expansion to fit the industry’s demand growth.<br />
08 January 2013<br />
Figure 22: Capacity expansion of major JVs Figure 23: Capacity expansion of major domestic brands<br />
DF Honda<br />
GAC Toyota<br />
Changan Ford Mazda<br />
GAC Honda<br />
DF PSA<br />
DF Yueda Kia<br />
FAW VW<br />
FAW VW<br />
SH VW<br />
SH GM<br />
JVs<br />
- 500 1,000 1,500 2,000<br />
2012E capacity 2015E capacity<br />
FAW Xiali<br />
Jianghuai<br />
Great Wall Motor<br />
- 500 1,000 1,500 2,000<br />
<strong>China</strong> <strong>Auto</strong> <strong>Sector</strong> 10<br />
FAW Car<br />
Changan <strong>Auto</strong><br />
Brilliance <strong>Auto</strong><br />
Shanghai <strong>Auto</strong><br />
Source: Company data Source: Company data<br />
Geely<br />
BYD<br />
Chery<br />
Domestic brands<br />
2012E capacity 2015E capacity<br />
Figure 24: Capacity utilisation rate of JVs Figure 25: Capacity utilisation rate of domestic brands<br />
Million units<br />
20<br />
18<br />
16<br />
14<br />
12<br />
10<br />
8<br />
6<br />
4<br />
2<br />
0<br />
90% 88%<br />
9.8<br />
11.2<br />
JVs<br />
14.9<br />
75%<br />
15.0<br />
84%<br />
2012E 2013E 2014E 2015E<br />
PV capacity* (LHS) Capacity utilization rate (RHS)<br />
* Including capacities for sedan, SUV and MPV<br />
Source: Company data, Credit Suisse estimates<br />
100%<br />
90%<br />
80%<br />
70%<br />
60%<br />
50%<br />
40%<br />
30%<br />
Million units<br />
20<br />
18<br />
16<br />
14<br />
12<br />
10<br />
8<br />
6<br />
4<br />
2<br />
0<br />
7.8<br />
56%<br />
Domestic brands<br />
8.8<br />
53%<br />
14.7<br />
34%<br />
16.6<br />
32%<br />
2012E 2013E 2014E 2015E<br />
PV capacity* (LHS) Capacity utilization rate (RHS)<br />
* Including capacities for sedan, SUV, and MPV<br />
Source: Company data, Credit Suisse estimates<br />
Domestic brands have<br />
higher risks of overcapacity.<br />
100%<br />
90%<br />
80%<br />
70%<br />
60%<br />
50%<br />
40%<br />
30%
SUV segment: New battlefield with<br />
strong demand<br />
Low SUV penetration rate with strong sales<br />
SUVs are expected to contribute around 13% of <strong>China</strong>’s PV sales in 2012, compared with<br />
about 5% in 2004 (Figure 26). However, this ratio is still much lower than the more than<br />
30% in the US and Australia, and is also lower than <strong>China</strong>’s neighbor such as Russia<br />
(Figure 27). SUV sales have grown much stronger than the PV industry in recent years<br />
(Figure 28). This is probably due to Chinese customers’ preferences for a more spacious<br />
driving experience, better visibility, outdoor lifestyles and better handling over tough road<br />
conditions. Moreover, prices for SUVs seem to be more resilient compared with other PV<br />
products, implying a lucrative playground for automakers (Figure 29). Given the low<br />
penetration rate and strong demand, we believe <strong>China</strong>’s SUV sales will remain strong in<br />
the next few years, which should attract more players to enter the market.<br />
08 January 2013<br />
Figure 26: SUV sales as a % of <strong>China</strong>’s PV sales Figure 27: 2011 SUV sales as a % of PV sales (by country)<br />
16%<br />
14%<br />
12%<br />
10%<br />
8%<br />
6%<br />
4%<br />
2%<br />
0%<br />
Jan/04 Oct/05 Jul/07 Apr/09 Jan/11 Oct/12<br />
SUV sales as % of PV sales<br />
Source: CAAM Source: CAAM, VDA, FCAJ, SMMT<br />
Figure 28: PV sales growth by segment<br />
Sales YoY%<br />
120<br />
100<br />
80<br />
60<br />
40<br />
20<br />
0<br />
-20<br />
2005 2006 2007 2008 2009 2010 2011 2012E 2013E 2014E 2015E<br />
Source: CAAM, Credit Suisse estimates<br />
<strong>China</strong> <strong>Auto</strong> <strong>Sector</strong> 11<br />
35%<br />
30%<br />
25%<br />
20%<br />
15%<br />
10%<br />
Total PV Sedan MPV SUV<br />
5%<br />
0%<br />
11%<br />
32%<br />
16%<br />
25%<br />
30%<br />
<strong>China</strong> US* Germany Russia Australia<br />
SUV sales as % of taotal PV sales (RHS)<br />
<strong>China</strong>’s SUV penetration<br />
rate is lower than major<br />
economies. We believe the<br />
segment’s sales will remain<br />
strong in next few years.
Figure 29: PV prices by segment<br />
4<br />
2<br />
0<br />
-2<br />
-4<br />
-6<br />
-8<br />
-10<br />
Price change (%)<br />
vs. Jan 2008 price<br />
-12<br />
Jan-08 Dec-08 Nov-09 Nov-10 Oct-11 Oct-12<br />
Source: NDRC<br />
PV Sedan SUV Mini Bus<br />
Upgrade and replacement demand to boost sales<br />
The SUV segment grows the fastest among all PV segments in <strong>China</strong>. One of the main<br />
reasons for this increase is that Chinese customers tend to choose bigger vehicles to<br />
upgrade/replace their existing car. A family car is quickly becoming a desired, and<br />
attainable, consumer product in <strong>China</strong>. Many Chinese consumers have already purchased<br />
a first, entry-level car and will be ready to upgrade to newer, better models. According to<br />
Sinotrust’s latest survey done in November 2012 on Chinese car owners’ preferences on<br />
their second vehicle, over 80% of Chinese car owners have only one car, who will become<br />
the major engine for auto sales in the next few years. Moreover, around 40% of Chinese<br />
car owners have indicated that they are going to buy an SUV as their second car, just<br />
behind sedans 49% (Figure 30: ). Also, the majority of upgrade and replacement<br />
purchases focus on models with an engine size between 1.7 and 2.0L and prices of<br />
Rmb50,000-150,000 (Figure 31, Figure 32). These models are usually classified as the<br />
mid-end and mid-to-low end segments. Therefore, we believe the mid-end and mid- to<br />
low-end SUV segments will have high sales growth potential given rising upgrade and<br />
replacement demand.<br />
Figure 30: Preference on vehicle model for first vehicle<br />
vs. second vehicle in <strong>China</strong><br />
70%<br />
60%<br />
50%<br />
40%<br />
30%<br />
20%<br />
10%<br />
0%<br />
14.7%<br />
6.8%<br />
Hatchback<br />
sedan<br />
64.4%<br />
48.6%<br />
39.8%<br />
16.9%<br />
2.5% 1.4%<br />
1.8% 1.4%<br />
0.5%<br />
0.2%<br />
0.8%<br />
0.3%<br />
Sedan SUV MPV Cross-over Minibus Others<br />
1st vehicle 2nd vehicle<br />
08 January 2013<br />
Figure 31: Preference on engine size for first vehicle vs.<br />
second vehicle in <strong>China</strong><br />
<strong>China</strong> <strong>Auto</strong> <strong>Sector</strong> 12<br />
70%<br />
60%<br />
50%<br />
40%<br />
30%<br />
20%<br />
10%<br />
0%<br />
1.2%<br />
0.6%<br />
57.8%<br />
38.1%<br />
32.2%<br />
26.3%<br />
7.1%<br />
23.9%<br />
7.1%<br />
1.0%<br />
2.9% 1.2%<br />
0.4% 0.4%<br />
4.0L<br />
1st vehicle 2nd vehicle<br />
Source: Sinotrust, Credit Suisse estimates Source: Sinotrust, Credit Suisse estimates<br />
We expect rising upgrade<br />
and replacement demand to<br />
mainly benefit mid-end and<br />
mid-to-low end SUV sales.
Figure 32: Preference on price of first vehicle vs. second vehicle in <strong>China</strong><br />
80%<br />
70%<br />
60%<br />
50%<br />
40%<br />
30%<br />
20%<br />
10%<br />
0%<br />
0.60% 0.30%<br />
3.3%<br />
0.7%<br />
72.6%<br />
38.5%<br />
12.9%<br />
19.0%<br />
08 January 2013<br />
<strong>China</strong> <strong>Auto</strong> <strong>Sector</strong> 13<br />
7.5%<br />
22.6%<br />
3.0%<br />
19.0%<br />
Rmb 300k<br />
Source: Sinotrust, Credit Suisse estimates<br />
1st vehicle 2nd vehicle<br />
New model launches to intensify competition<br />
Attracted by the lucrative SUV market, many automakers launched their new models to<br />
gain market share. Generally, JVs have launched more new models than domestic brands,<br />
expanding their market share since 2008 (Figure 33). Four new models were launched in<br />
4Q12 and over 20 new models are in the 2013 pipeline across different segments (Figure<br />
34 through to Figure 38). In the high-end and luxury segments, Audi Q3 should become a<br />
strong competitor for the BMW X1, while the Land Rover Freelander 2 and Volvo XC60<br />
will likely compete with each other starting 4Q13 (Figure 35). In the mid-to-high end<br />
segment, new models account for almost 40% of the total number of models (Figure 36).<br />
JV producers are major players in this segment and we expect their average margins to<br />
decline as competition intensifies. Although new models also account for around 40% of<br />
total models in the mid-end segment (Figure 37), we believe that Great Wall will retain its<br />
position as the No.1 best-selling brand. Its competitors in the mid-end segment are mainly<br />
domestic players not specialized in SUVs and with tiny market shares (Figure 38).<br />
Figure 33: SUV sales by automaker type<br />
100%<br />
90%<br />
80%<br />
70%<br />
60%<br />
50%<br />
40%<br />
30%<br />
20%<br />
10%<br />
0%<br />
45% 45%<br />
40% 38%<br />
48%<br />
59% 57%<br />
62% 59% 61% 63% 66%<br />
2004 2005 2006 2007 2008 2009 2010 2011 2012E 2013E 2014E 2015E<br />
Source: CAAM, Credit Suisse estimates<br />
JVs Domestic brands<br />
Over 20 new models are<br />
due to be launched in 2013,<br />
which will intensify<br />
competition in the SUV<br />
segment
Figure 34: Launch time of new models<br />
Buick Encore<br />
Changan CS35<br />
Mitsubishi ASX<br />
Beijing B40<br />
Ford Kuga<br />
Peugeot 3008<br />
JAC Rein II<br />
Geely Emgrand SX7<br />
Zotye T600<br />
Audi Q3<br />
Benteng X80<br />
Yongman T5<br />
Mitsubishi Pajero Sport<br />
Mazda CX-7<br />
Geely Emgrand EX8<br />
Ford Ecosport<br />
Geely Emgrand EX6<br />
Mazda CX-5<br />
Chery T21<br />
Great Wall H2<br />
Geely Gleagle GX5<br />
Haima C2<br />
Beijing SC20<br />
Volvo XC60<br />
Land Rover Freelander 2<br />
Skoda Yeti<br />
Chevrolet Orlando<br />
08 January 2013<br />
- 100,000 200,000 300,000 400,000 500,000 600,000 700,000<br />
Source: Company data, Credit Suisse estimates<br />
New models<br />
Figure 35: Price range of <strong>China</strong>-made SUV models in high-end and luxury segments<br />
Toyota Prado<br />
Nissan Murano<br />
Volvo XC60<br />
Benz GLK<br />
Audi Q5<br />
Land Rover Freelander 2<br />
BMW X1<br />
Toyota Highlander<br />
Audi Q3<br />
Mitsubishi Pajero<br />
Mitsubishi Pajero Sport<br />
Source: Company data<br />
<strong>China</strong> <strong>Auto</strong> <strong>Sector</strong> 14<br />
4Q12<br />
1Q13<br />
2Q13<br />
3Q13<br />
4Q13<br />
200,000 300,000 400,000 500,000 600,000 700,000 800,000<br />
Existing models New models<br />
RMB<br />
RMB
Figure 36: Price range of <strong>China</strong>-made SUV models in mid-to-high end segment<br />
Mazda CX-7<br />
VW Tiguan<br />
Ford Kuga<br />
Chevrolet Captiva<br />
Nissan X-Trail<br />
Roewe W5<br />
Nissan Paladin<br />
Mazda CX-5<br />
Luxgen 7<br />
Toyota RAV4<br />
Honda CR-V<br />
Skoda Yeti<br />
Kia Sportage R<br />
Hyundai IX35<br />
Peugeot 3008<br />
Changfeng Leopard CS7<br />
Chevrolet Orlando<br />
Hyundai Tucson<br />
Nissan Qashqai<br />
Kia Sportage<br />
Trumpche GS5<br />
Benteng X80<br />
Hawtai Boliger<br />
Mitsubishi ASX<br />
Buick Encore<br />
Jiangling Yusheng<br />
Geely Emgrand EX8<br />
Source: Company data<br />
08 January 2013<br />
100,000 150,000 200,000 250,000 300,000 350,000<br />
Existing models New models<br />
Figure 37: Price range of <strong>China</strong>-made SUV models in mid-end segment<br />
75,000 100,000 125,000 150,000 175,000 200,000<br />
Beijing B40<br />
Changfeng Leopard CT5<br />
Zhonghua V5<br />
Dongfeng Oting<br />
Great Wall H5<br />
Landwind X Series<br />
Haima 7<br />
Great Wall H6<br />
Great Wall H3<br />
Ford Ecosport<br />
Yongman T5<br />
JAC Rein II<br />
Chery T21<br />
BYD S6<br />
Geely Gleagle GX7<br />
Geely Emgrand SX7<br />
Zotye T600<br />
JAC Rein<br />
Huanghai V3<br />
Chery Tiggo<br />
Great Wall H2<br />
Source: Company data<br />
Existing models New models<br />
<strong>China</strong> <strong>Auto</strong> <strong>Sector</strong> 15<br />
RMB<br />
RMB
08 January 2013<br />
Figure 38: Price range of <strong>China</strong>-made SUV models in low-end segment<br />
50,000 75,000 100,000 125,000<br />
Hawtai Santa Fe<br />
Haima C2<br />
Changan CS35<br />
Lifan X60<br />
Geely Emgrand EX6<br />
Zotye 5008<br />
Beijing SC20<br />
Source: Company data<br />
Existing models New models<br />
Limited competition in mid-to-low end segment<br />
Top JVs have equal strengths in the mid-to-high end SUV segment (Figure 39). Many of<br />
them are launching new models in 2013 and competition would become tougher. In<br />
contrast, the mid-to-low end SUV segment is dominated by Great Wall Motor (Figure 40).<br />
More than ten new models will be launched in 2013 in this segment. However, we believe<br />
Great Wall will be able to keep its leadership given its traditional strength in SUV and its<br />
good brand image. We expect the mid-to-low end segment to have less intensive<br />
competition but higher sales growth potential, which will mainly benefit Great Wall Motor.<br />
Figure 39: Market share in mid-to-high end SUV segment<br />
FAW Toyota<br />
10%<br />
DF Yueda<br />
Kia<br />
12%<br />
DF Nissan<br />
14%<br />
Others<br />
11%<br />
Jan-Nov 2012<br />
Source: CAAM, Credit Suisse estimates<br />
SH VW<br />
19%<br />
DF Honda<br />
17%<br />
BJ Hyundai<br />
17%<br />
Figure 40: Market share in mid-to-low end SUV segment<br />
Hawtai<br />
4%<br />
Geely<br />
4%<br />
Brilliance<br />
<strong>Auto</strong><br />
6%<br />
Jiangnan<br />
6%<br />
BYD<br />
11%<br />
Jan-Nov 2012<br />
Others<br />
19%<br />
Source: CAAM, Credit Suisse estimates<br />
Chery<br />
14%<br />
Great Wall<br />
36%<br />
FAW Toyota<br />
9%<br />
DF Yueda<br />
Kia<br />
11%<br />
DF Nissan<br />
12%<br />
<strong>China</strong> <strong>Auto</strong> <strong>Sector</strong> 16<br />
Hawtai<br />
4%<br />
Geely<br />
8%<br />
Brilliance<br />
<strong>Auto</strong><br />
5%<br />
Others<br />
20%<br />
Jiangnan<br />
7%<br />
Others<br />
21%<br />
2013E<br />
2013E<br />
BYD<br />
9%<br />
Chery<br />
13%<br />
SH VW<br />
17%<br />
DF Honda<br />
16%<br />
BJ Hyundai<br />
15%<br />
Great Wall<br />
33%<br />
RMB<br />
We believe Great Wall will<br />
continue to lead the mid-tolow<br />
end SUV segment due<br />
to lack of strong competitors
Mid-to-high end segment:<br />
Intensifying competition<br />
Slowdown of PV sales<br />
<strong>China</strong>’s auto sales slowed down after its high growth of 2009-10 (Figure 41). In the first 11<br />
months of 2012, <strong>China</strong>’s auto sales grew 3.9% YoY, rebounding a little from 2.6% for 2011.<br />
We expect its entire 2012 sales to reach around 19 mn units. The YoY growth rate of its<br />
quarterly sales has dropped to single digits since 1Q11 when most of the government’s<br />
stimulus policies faded (Figure 42). Mid-to-high end PV sales have closely followed the<br />
industrial trend in recent years (Figure 43). We expect them to keep growing in single<br />
digits by 2015 (Figure 43).<br />
Figure 41: <strong>Auto</strong> sales of major countries<br />
20,000<br />
18,000<br />
16,000<br />
14,000<br />
12,000<br />
10,000<br />
8,000<br />
6,000<br />
4,000<br />
2,000<br />
0<br />
'000 units<br />
2004 2005 2006 2007 2008 2009 2010 2011 2012E<br />
<strong>China</strong> India Japan Western Europe<br />
Russia USA (Light vehicles) Brazil<br />
Source: CAAM, Gasgoo, Wind, Credit Suisse estimates<br />
Figure 42: <strong>China</strong>’s passenger vehicle (PV) sales<br />
('000 units)<br />
4,500<br />
4,000<br />
3,500<br />
3,000<br />
2,500<br />
2,000<br />
1,500<br />
1,000<br />
500<br />
-<br />
77%<br />
26%<br />
17%<br />
25%<br />
9%<br />
3%<br />
8%<br />
2% -2%<br />
1Q10 2Q10 3Q10 4Q10 1Q11 2Q11 3Q11 4Q11 1Q12 2Q12 3Q12 4Q12E<br />
Source: CAAM, Credit Suisse estimates<br />
08 January 2013<br />
<strong>China</strong> <strong>Auto</strong> <strong>Sector</strong> 17<br />
17%<br />
<strong>China</strong>'s PV sales (LHS) <strong>China</strong>'s PV sales YoY (RHS)<br />
7%<br />
8%<br />
YoY<br />
90%<br />
80%<br />
70%<br />
60%<br />
50%<br />
40%<br />
30%<br />
20%<br />
10%<br />
0%<br />
-10%<br />
Given the slowdown of<br />
<strong>China</strong>’s PV sales, we<br />
believe the mid-to-high end<br />
segment will grow in the<br />
single digits by 2015
Figure 43: PV sales comparison by segment<br />
100%<br />
80%<br />
60%<br />
40%<br />
20%<br />
0%<br />
-20%<br />
39%<br />
22%<br />
25%<br />
7%<br />
53%<br />
29%<br />
76%<br />
33%<br />
5%<br />
42%<br />
25%<br />
22% 21% 20%<br />
7% 10% 10%<br />
2007 2008 2009 2010 2011 2012E 2013E 2014E 2015E<br />
Mid-to-high end YoY Luxury YoY Ultra-luxury YoY Total PV YoY<br />
Source: Roland Berger, Credit Suisse estimates<br />
Intensifying competition in PV segment<br />
<strong>China</strong>’s auto sector is highly competitive and original equipment manufacturers (OEM) are<br />
flooding the market. There are more than 50 auto makers in <strong>China</strong> and the industry is<br />
relatively fragmented. Foreign brands dominate, with their Chinese JVs accounting for<br />
almost 70% of <strong>China</strong>’s PV sales. Among them, GM and Volkswagen had a joint market<br />
share of around 35% in the first 11 months of 2012 (Figure 44). Their market shares have<br />
improved quickly in recent years, as Japanese brands lost market share in the mid- to<br />
high-end segment, especially after the Diaoyu islands dispute in mid-September 2012.<br />
The joint market share of domestic auto brands has kept decreasing in recent years,<br />
mainly due to weakening low-end PV sales, and is now less than one-third in 2012.<br />
Meanwhile, auto prices have also kept falling in recent years due to intensifying<br />
competition, while luxury auto prices are much more resilient compared with other<br />
segments (Figure 46).<br />
Figure 44: PV market share of major foreign auto brands in <strong>China</strong><br />
20%<br />
18%<br />
16%<br />
14%<br />
12%<br />
10%<br />
8%<br />
6%<br />
4%<br />
2%<br />
0%<br />
GM Volkswagen Nissan Hyundai Toyota Honda Ford Kia PSA<br />
Source: CAAM, Credit Suisse estimates<br />
2008 2009 2010 2011 Jan-Nov 2012<br />
08 January 2013<br />
<strong>China</strong> <strong>Auto</strong> <strong>Sector</strong> 18<br />
9%<br />
JVs are gaining market<br />
share in <strong>China</strong>’s PV<br />
segment, while auto prices<br />
are declining due to<br />
intensifying competition.
Figure 45: PV market share of major domestic auto brands in <strong>China</strong><br />
6%<br />
5%<br />
4%<br />
3%<br />
2%<br />
1%<br />
0%<br />
Chery Geely Great Wall BYD Brilliance Changan Jianghuai Lifan<br />
Source: CAAM, Credit Suisse estimates<br />
2008 2009 2010 2011 Jan-Nov 2012<br />
Figure 46: Change of auto prices by segments<br />
(Jan 2008 price = 100)<br />
105<br />
100<br />
95<br />
90<br />
85<br />
80<br />
Jan-08 Jun-08 Dec-08 Jun-09 Nov-09 May-10 Nov-10 May-11 Oct-11 Apr-12 Oct-12<br />
PV Mini Small Medium Class High Class Luxury<br />
Source: Cheshi, Credit Suisse estimates<br />
Japanese brands to regain market share in 2013<br />
Probably due to conservative market strategies, Japanese auto brands’ market shares<br />
have kept declining in recent years. Moreover, they suffered strikes from the Japanese<br />
earthquake in March 2011 and the Diaoyu island dispute in September 2012. Top<br />
Japanese auto brands such as Nissan, Toyota, Honda, and Mazda saw their Sep-Nov<br />
2012 sales decline sharply from the previous year (Figure 47). Japanese brands’ joint<br />
market share in <strong>China</strong> has fallen below 20% in the first 11 months of 2012 from more than<br />
22% in 2010 (Figure 48). The market share losses of Japanese brands are mainly the<br />
gains of JV brands especially German brands such as Volkswagen (Figure 48). Domestic<br />
players have not gained much, as they do not have intensive overlap with Japanese<br />
brands, which primarily focus on the mid-to-high end segment. December 2012 shipment<br />
of major Japanese auto brands rebounded to around 75-85% of their December 2011<br />
levels, suggesting a recovery is on track (Figure 47). Through our channel checks, we also<br />
learn that inventories at dealers’ have dropped to 1.3-1.6 months from their peaks at 2-3<br />
months in October 2012. Retail of Japanese auto brands in December 2012 has also<br />
08 January 2013<br />
We expect Japanese<br />
brands’ new models to help<br />
them regain market share in<br />
2013<br />
<strong>China</strong> <strong>Auto</strong> <strong>Sector</strong> 19
ecovered to similar level as in December 2011. Brands, such as Nissan and Honda, plan<br />
to launch their new generation of sedans in 2013, which we expect will help them improve<br />
sales and regain market share. We expect these models to have lower ASPs than existing<br />
ones, which will not only intensify competition in the mid-to-high end segment, but also<br />
post high price pressure on the mid-end segment. However, luxury brand economy<br />
models are priced close to Japanese brands’ high-end models. Facing this top-down price<br />
pressure from the luxury segment, we expect Japanese brands to encounter a tough<br />
recovery in 2013.<br />
Figure 47: <strong>China</strong> sales of major Japanese auto brands<br />
<strong>China</strong> sales YoY (%) Sep-12 Oct-12 Nov-12 Dec-12 2012<br />
Nissan -35.3 -41.0 -29.8 -24.0 -5.3<br />
Toyota -48.9 -44.1 -22.1 -15.9 -4.9<br />
Honda -40.5 -54.0 -29.2 -19.2 -3.1<br />
Source: Company data, Credit Suisse estimates<br />
Figure 48: Foreign brands’ PV market shares in <strong>China</strong><br />
25%<br />
20%<br />
15%<br />
10%<br />
5%<br />
0%<br />
Jan-09 May-09 Oct-09 Feb-10 Jul-10 Dec-10 Apr-11 Sep-11 Jan-12 Jun-12 Nov-12<br />
Source: CAAM<br />
Japanese German American Korean French<br />
Low-end segment is under pressure<br />
Usually PVs with an engine size of less than 1.6L are classified as low-end vehicles in<br />
<strong>China</strong>. They achieved impressive sales growth in 2009, outpacing the country’s PV sector<br />
(Figure 49). However, since 2010 the sales of low-end PVs have generally<br />
underperformed the sector (Figure 49). And we expect the share of low-end sedans<br />
(including A00, A0 and A classes) in <strong>China</strong>’s total PV sales to drop to around 51% in 2012<br />
from over 53% in 2006 (Figure 50). Given the slowdown in sales, we believe the peak<br />
period of strong demand growth for low-end vehicles has already passed. <strong>Auto</strong>makers<br />
with a primary focus on low-end sedans, such as Geely and BYD, are therefore likely to be<br />
seriously affected.<br />
08 January 2013<br />
Low-end PV sales is slowing<br />
down as demand weakens.<br />
<strong>China</strong> <strong>Auto</strong> <strong>Sector</strong> 20
Figure 49: <strong>China</strong>’s low-end PV sales growth vs. total PV sales growth<br />
140%<br />
120%<br />
100%<br />
80%<br />
60%<br />
40%<br />
20%<br />
0%<br />
-20%<br />
-40%<br />
Jan, 2009<br />
y-y<br />
Apr, 2009<br />
Source: CEIC, Credit Suisse estimates<br />
Jul, 2009<br />
Figure 50: <strong>China</strong> PV sales by class<br />
100%<br />
90%<br />
80%<br />
70%<br />
60%<br />
50%<br />
40%<br />
30%<br />
20%<br />
10%<br />
0%<br />
30%<br />
Oct, 2009<br />
Jan, 2010<br />
Apr, 2010<br />
Jul, 2010<br />
Oct, 2010<br />
Engine
Figure 51: Sedan market shares of top domestic automakers<br />
7.0%<br />
6.0%<br />
5.0%<br />
4.0%<br />
3.0%<br />
2.0%<br />
1.0%<br />
0.0%<br />
4.4%<br />
4.2%<br />
5.7%<br />
3.7%<br />
3.4%<br />
3.2%<br />
0.8%<br />
2.1%<br />
0.2%<br />
Geely <strong>Auto</strong> Chery <strong>Auto</strong> BYD Changan <strong>Auto</strong> Great Wall<br />
Motor<br />
Source: CAAM, Credit Suisse estimates<br />
3.5%<br />
2008 2009 2010 2011 Jan-Nov 2012<br />
08 January 2013<br />
<strong>China</strong> <strong>Auto</strong> <strong>Sector</strong> 22<br />
2.4%<br />
1.8% 1.8% 1.7%<br />
Tianjin FAW<br />
<strong>Auto</strong><br />
0.2%<br />
1.2%<br />
FAW Car Jianghuai <strong>Auto</strong><br />
Figure 52: Official prices of major JV self-owned brands<br />
Self- Lowest Highest Lowest Highest<br />
owned price price Original price price<br />
Manufacturer brand (Rmb) (Rmb) platform (Rmb) (Rmb)<br />
GAC Honda Linian 69,800 99,800 Honda City 96,800 159,800<br />
SH GM Wuling Baojun 62,800 95,800 Chevrolet Spark 77,800 88,800<br />
DF Nissan Venucia 67,800 83,800 Nissan TIIDA 105,300 158,800<br />
DF Honda CIIMO 111,800 119,800 Honda Civic 131,800 135,800<br />
Source: Company data, Credit Suisse estimates
Luxury segment: Rising alone with<br />
wealth in <strong>China</strong><br />
Low luxury auto penetration rate<br />
Luxury PVs contribute to about 7% of total PV sales in <strong>China</strong>. This compares with 13% in<br />
the US and more than 20% in Europe (Figure 53). Luxury PVs account for about 9% of<br />
total automobiles in <strong>China</strong>, lower than most mature auto markets such as the US,<br />
Germany and the UK (Figure 54). Therefore, we believe that there is still large potential for<br />
luxury auto sales growth in <strong>China</strong>. We expect the luxury segment to keep growing at 20-<br />
25% p.a. by 2015 (Figure 56,Figure 57).<br />
Figure 53: Luxury* PV sales as % of total PV sales (2011) Figure 54: Luxury* PV as % of total number of autos<br />
35%<br />
30%<br />
25%<br />
20%<br />
15%<br />
10%<br />
5%<br />
0%<br />
7%<br />
13%<br />
10%<br />
29%<br />
9%<br />
23%<br />
<strong>China</strong> US** Japan Germany Russia UK<br />
Luxury* PV sales as % of taotal PV sales<br />
* Includes both luxury and ultra-luxury models.<br />
** PV sales here refer to light vehicle sales.<br />
Source: CPCA, LMC <strong>Auto</strong>motive, AEB, Credit Suisse estimates<br />
(2011)<br />
08 January 2013<br />
<strong>China</strong> <strong>Auto</strong> <strong>Sector</strong> 23<br />
35%<br />
30%<br />
25%<br />
20%<br />
15%<br />
10%<br />
5%<br />
0%<br />
9%<br />
11%<br />
3%<br />
29%<br />
15%<br />
16%<br />
<strong>China</strong> US Japan Germany Russia UK<br />
Luxury* vehilce as % of total number of automobiles<br />
* Includes both luxury and ultra-luxury models<br />
Source: SXRB, Credit Suisse estimates<br />
Growing wealth strengthens luxury auto demand<br />
Figure 55: Growth of number of millionaires in <strong>China</strong><br />
80%<br />
70%<br />
60%<br />
50%<br />
40%<br />
30%<br />
20%<br />
10%<br />
0%<br />
-10%<br />
-20%<br />
320<br />
345<br />
7% 8%<br />
20%<br />
413<br />
364 343<br />
2005 2006 2007 2008 2009 2010 2011 1H12<br />
-12%<br />
-6%<br />
56%<br />
535<br />
562<br />
Number of millionaires (RHS) Number of millionaires y-y (LHS)<br />
5%<br />
'000 persons<br />
1,200<br />
72%<br />
Source: Capgemini, Merrill Lynch Global Wealth Management, RBC Wealth Management, Citi Private<br />
Bank, Credit Suisse Research Institute<br />
964<br />
1,000<br />
800<br />
600<br />
400<br />
200<br />
-<br />
We believe luxury auto<br />
sales have high growth<br />
potential in <strong>China</strong> mainly<br />
due to a low penetration rate
Figure 56: Luxury PV sales in <strong>China</strong><br />
'000 Units<br />
2,500<br />
2,000<br />
1,500<br />
1,000<br />
500<br />
0<br />
181<br />
39%<br />
22%<br />
252<br />
25%<br />
7%<br />
314<br />
53%<br />
29%<br />
407<br />
76%<br />
33%<br />
718<br />
42%<br />
1,017<br />
1,272<br />
25%<br />
08 January 2013<br />
<strong>China</strong> <strong>Auto</strong> <strong>Sector</strong> 24<br />
1,551<br />
1,877<br />
2,252<br />
22% 21% 20%<br />
5% 7% 10% 10%<br />
2006 2007 2008 2009 2010 2011 2012E 2013E 2014E 2015E<br />
Luxury PV sales (LHS) Luxury PV sales YoY (RHS) Total PV sales YoY (RHS)<br />
Source: Roland Berger, Credit Suisse estimates<br />
Figure 57: Ultra-luxury PV sales in <strong>China</strong><br />
'000 Units<br />
90<br />
80<br />
70<br />
60<br />
50<br />
40<br />
30<br />
20<br />
10<br />
0<br />
4<br />
51%<br />
22%<br />
6<br />
83%<br />
7%<br />
11<br />
53%<br />
10<br />
17<br />
-12%<br />
79% 77%<br />
33%<br />
30<br />
5%<br />
35%<br />
41<br />
7%<br />
53<br />
30%<br />
66<br />
25%<br />
9%<br />
79<br />
20%<br />
10% 10% 9%<br />
2006 2007 2008 2009 2010 2011 2012E 2013E 2014E 2015E<br />
Ultra-luxury PV sales (LHS) Ultra-luxury PV sales YoY (RHS) Total PV sales YoY (RHS)<br />
Source: Roland Berger, Credit Suisse estimates<br />
Replacement demand drives luxury auto sales<br />
Most Chinese auto buyers are still first-time buyers and contributed more than 90% of total<br />
auto sales in 2011 (Figure 58). As the auto stock ages in <strong>China</strong>, people who bought their<br />
cars during 2009-10 should be looking to make a replacement purchase in the next few<br />
years. This trend may continue and we believe that replacement demand will gradually<br />
become the major driver of <strong>China</strong>’s auto sales in the next 5-10 years. It is difficult to<br />
describe the Chinese customers’ affinity for luxury goods, such as luxury cars. In particular,<br />
they love SUVs or luxury cars for their second car. Since about 2003, <strong>China</strong>'s affluent<br />
population has completely overtaken Americans with similar incomes in the purchase of<br />
luxury vehicles (Figure 59). For the same income bracket per 1,000 households, Chinese<br />
customers purchase nearly six times as many luxury cars as Americans do. We believe<br />
replacement demand will boost luxury auto sales in <strong>China</strong>, stronger than it did in other<br />
developed countries.<br />
100%<br />
80%<br />
60%<br />
40%<br />
20%<br />
0%<br />
-20%<br />
100%<br />
80%<br />
60%<br />
40%<br />
20%<br />
0%<br />
-20%<br />
We believe replacement<br />
demand will be the major<br />
driver of luxury auto sales in<br />
<strong>China</strong>
Figure 58: New demand vs. replacement demand<br />
100%<br />
90%<br />
80%<br />
70%<br />
60%<br />
50%<br />
40%<br />
30%<br />
20%<br />
10%<br />
0%<br />
87%<br />
13%<br />
91%<br />
9%<br />
76%<br />
24%<br />
50%<br />
50%<br />
<strong>China</strong> (2010) <strong>China</strong> (2011) India Korea USA Japan UK German<br />
Source: JD Power, Wardsauto, <strong>China</strong> <strong>Auto</strong> Market<br />
25%<br />
75%<br />
Replacement demand 1st time demand<br />
Figure 59: Luxury car sales per 1,000 households with annual disposable incomes over US$100,000<br />
Unit US<br />
100<br />
90<br />
80<br />
70<br />
60<br />
50<br />
40<br />
30<br />
20<br />
10<br />
0<br />
68<br />
69<br />
75<br />
80<br />
84 84<br />
80 79<br />
2000 2001 2002 2003 2004 2005 2006 2007 2008 2009 2010 2011<br />
Source: Euromonitor, US Census Bureau, HIS, World Bank, TNS, Credit Suisse estimates<br />
Proliferation of economy models<br />
67<br />
53<br />
58<br />
53<br />
08 January 2013<br />
<strong>China</strong> <strong>Auto</strong> <strong>Sector</strong> 25<br />
17%<br />
83%<br />
40<br />
6%<br />
94%<br />
72<br />
76<br />
5%<br />
95%<br />
Unit <strong>China</strong><br />
350<br />
Many luxury brands have launched their economy models with affordable prices. Some of<br />
them are selling below Rmb300,000, which is the traditional price range for the mid-to-high<br />
end segment (Figure 60 through to Figure 63). Major economy models, such as the<br />
Mercedes-Benz C class, BMW 3 series, Audi A4L and Volvo S60, are also the best-selling<br />
models for these luxury brands. We believe their good brand image and attractive prices<br />
will enable them to expand their customer base and gain market share from mid-to-high<br />
end players. This should fuel their sales growth in the next 3-5 years.<br />
300<br />
250<br />
200<br />
150<br />
100<br />
50<br />
0<br />
122<br />
97 93<br />
130<br />
161<br />
177<br />
231<br />
340 339<br />
2000 2001 2002 2003 2004 2005 2006 2007 2008 2009 2010 2011<br />
Luxury brands’ economy<br />
models will help them to<br />
boost sales and gain market<br />
share
Figure 60: Official prices of luxury brands’ economy models vs. key mid-to-high end models<br />
BMW New 3 Series<br />
Volvo S60<br />
BMW 3 Series<br />
Mercedes-Benz C Class<br />
Audi A4L<br />
Nissan Teana<br />
Buick LaCrosse<br />
Source: Company data<br />
Honda Accord<br />
Toyota Camry<br />
VW Passart<br />
08 January 2013<br />
100,000 150,000 200,000 250,000 300,000 350,000 400,000 450,000 500,000 550,000 600,000<br />
Figure 61: Nov 12 retail prices of luxury brands’ economy models vs. key mid-to-high end models<br />
BMW New 3 Series<br />
Volvo S60<br />
BMW 3 Series<br />
Mercedes-Benz C Class<br />
Audi A4L<br />
Nissan Teana<br />
Buick LaCrosse<br />
Honda Accord<br />
Toyota Camry<br />
VW Passart<br />
Source: Channel checks with dealers<br />
100,000 150,000 200,000 250,000 300,000 350,000 400,000 450,000 500,000 550,000 600,000<br />
<strong>China</strong> <strong>Auto</strong> <strong>Sector</strong> 26<br />
RMB<br />
RMB
Figure 62: Comparison among cheapest economy models of major luxury brands<br />
Model<br />
Official price<br />
(’000 Rmb)<br />
Dec-12 Retail price<br />
(’000 Rmb)<br />
Mercedes-Benz<br />
C Class<br />
BMW 3 Series<br />
BMW New 3 Series<br />
(Long-wheelbase)<br />
08 January 2013<br />
Audi A4L Volvo S60<br />
C180 CGI Classic 318i Advance 320Li Fashion 30TFS I MT Comfort 2.0T Advance<br />
308.0 296.0 354.6 272.8 282.8<br />
158.0 241.0 354.6 217.8 212.8<br />
Size (m) 4.581/1.770/1.448 4.531/1.817/1.421 4.734/1.811/1.455 4.791/1.826/1.439 4.628/1.865/1.484<br />
Wheelbase (m) 2.76 2.76 2.92 2.869 2.776<br />
Trunk volume (litre) 475 460 480 480 380<br />
Tank volume (litre) 66 63 60 65 67.5<br />
Complete mass (kg) 1545 1465 1540 1550 1591<br />
Engine size (L) 1.796 1.995 1.997 1.798 1.984<br />
Max power (kW/rpm) 115/5000 100/5750 135/5000 118/4500-6200 132/5000<br />
Max toque (n.m/rpm) 250/1600-4200 180/3250 270/1250-4500 250/1500-4500 300/2700-4200<br />
Acceleration 0-100 km/h<br />
(seconds)<br />
8.9 10.8 7.9 8.3 8.7<br />
Transmission 7AT 6AT 8AT 6MT 6AT<br />
Fuel consumption<br />
(L/100km)<br />
7.7 8.5 6.9 6.5 8.3<br />
Warranty 2 years 2 years 2 years 2 years 2 years or 100,000 km<br />
Emission standard Euro IV Euro IV Euro IV National IV National IV<br />
Source: Xcar, Channel checks with dealers<br />
Figure 63: Major luxury models with retail prices below Rmb300,000<br />
Official Oct-12 Price Nov-12 Price Dec-12 Price<br />
price retail price cut retail price cut retail price cut<br />
Brand Model (’000 Rmb) (’000 Rmb) (%) (’000 Rmb) (%) (’000 Rmb) (%)<br />
Mercedes-Benz C180K CGI Classic 308.0 233.0 24 218.0 29 158.0 49<br />
C200 CGI 348.0 258.0 26 248.0 29 193.0 45<br />
C200 CGI Fashion 388.0 283.0 27 268.0 31 233.0 40<br />
BMW 318i 2.0 AT Advance 2012 296.0 249.0 16 246.0 17 241.0 55<br />
Audi A4L 1.8 30TFSI MT Comfort 2012 272.8 232.8 15 234.8 14 217.8 20<br />
A4L 1.8 30TFSI CVT Comfort 2012 291.0 251.0 14 253.0 13 236.0 19<br />
A4L 2.0 35TFSI CVT Standard<br />
2012<br />
309.8 269.8 13 271.8 12 254.8 18<br />
A4L 2.0 35TFSI CVT Comfort 2012 329.9 289.9 12 291.9 12 274.9 17<br />
Volvo S60 2.0T Advance 2013 282.8 242.8 14 222.8 21 257.8 9<br />
S60 2.0T T5 Smart 2013 299.8 259.8 13 239.8 20 274.8 8<br />
S60 2.0T T5 Comfort 2013 322.8 282.8 12 262.8 19 297.8 8<br />
S60 2.0T DCTT5 Smart 2012 249.8 199.8 20 189.8 24 199.8 20<br />
S60 2.0T DCTT5 Comfort 2012 319.9 269.9 16 259.9 19 264.9 17<br />
S60 1.6T DCTDRIVe Smart 2012 282.8 232.8 18 222.8 21 212.8 25<br />
S60 1.6T DCTDRIVe Comfort 2012 306.8 256.8 16 246.8 20 236.8 23<br />
S60 1.6T DCTDRIVe Smart 2012 334.8 284.8 15 274.8 18 264.8 21<br />
S60 2.0T DCTT5 Comfort 2012 339.8 259.8 24 264.8 22 259.8 24<br />
S60 2.0T DCTT5 Delux 2012 369.8 289.8 22 294.8 20 289.8 22<br />
Lexus CT200h 1.8 CVT Elite 2012 279.0 234.0 16 239.0 14 229.0 18<br />
CT200h 1.8 CVT Advance 2012 339.0 294.0 13 289.0 15 289.0 15<br />
Source: Channel checks with dealers<br />
<strong>China</strong> <strong>Auto</strong> <strong>Sector</strong> 27
Restrictive policies won’t hurt luxury segment<br />
Beijing and Guangzhou are adopting restrictive policies on auto sales to control<br />
congestion. Beijing announced the most strict restrictive policies on auto license plates in<br />
December 2010. The new measures set a 2011 annual quota for Beijing’s new PV<br />
licenses of only 240,000 units, compared with its 2010 total auto sales of around 900,000<br />
vehicles. Quotas for new car licenses are distributed by lottery draw, while<br />
upgrading/replacement purchases are not regulated by the new measures once an owner<br />
disposes of his/her old car. With this new license quota limit, car growth in Beijing has<br />
slowed down since 2011 (Figure 64). Accordingly, the CAGR for total number of autos in<br />
Beijing is expected to drop to about 3.7% in 2012-16E from over 11% for 2007-11. It is<br />
also estimated that only one person in 20 can win the quota to buy a new car. Moreover,<br />
people with that precious quota are less likely to buy a cheap car, which in turn stimulates<br />
luxury auto sales. Further, luxury autos are bought by Chinese customers mainly as status<br />
symbols rather than a mode of transportation. Although some of the potential buyers may<br />
not have a valid Beijing license to bypass the quota application, they are still allowed to<br />
buy cars with non-Beijing licenses with some restrictions on driving areas. Guangzhou’s<br />
government announced its own auto purchase restriction policy on 30 June 2012. In the<br />
coming year, the number of incremental small- and medium-sized passenger cars in<br />
Guangzhou is capped at 120,000 units, translating into a monthly quota of 10,000 units.<br />
However, data shows that 226,000 vehicles were registered with license plates in<br />
Guangzhou in 2011, equivalent to around 19,000 units per month. As in Beijing, we<br />
believe auto buyers are more likely to choose high-end models, boosting sales of luxury<br />
autos.<br />
Figure 64: Number of automobiles in Beijing<br />
6<br />
5<br />
4<br />
3<br />
2<br />
1<br />
0<br />
1997<br />
million vehicles<br />
1<br />
1998<br />
1999<br />
2000<br />
2<br />
2.58<br />
Source: Beijing Municipal Commission of Transport<br />
2001<br />
2002<br />
2003<br />
2004<br />
2005<br />
2006<br />
3<br />
2007<br />
3.5<br />
4.02<br />
4.5m<br />
(2010 Sep)<br />
2008<br />
2009<br />
Sep-10<br />
Dec-10<br />
4.81m<br />
(2010 Dec)<br />
08 January 2013<br />
<strong>China</strong> <strong>Auto</strong> <strong>Sector</strong> 28<br />
5.02<br />
2011<br />
2012E<br />
2013E<br />
2014E<br />
2015E<br />
2016E<br />
6<br />
We believe restrictive<br />
policies in Tier 1 cities will<br />
create opportunities for<br />
luxury auto sales given<br />
precious quota and licences
Rating OUTPERFORM* [V]<br />
Price (04 Jan 13, HK$) 25.35<br />
Target price (HK$) 30.00¹<br />
Upside/downside (%) 18.3<br />
Mkt cap (HK$ mn) 84,052 (US$ 10,845)<br />
Enterprise value (Rmb mn) 58,413<br />
Number of shares (mn) 3,042.42<br />
Free float (%) 44.0<br />
52-week price range 25.4 - 11.2<br />
ADTO - 6M (US$ mn) 16.9<br />
*Stock ratings are relative to the coverage universe in each<br />
analyst's or each team's respective sector.<br />
¹Target price is for 12 months.<br />
[V] = Stock considered volatile (see Disclosure Appendix).<br />
Share price performance<br />
Research Analysts<br />
Jack Yeung<br />
852 2101 6779<br />
jack.yeung@credit-suisse.com<br />
40<br />
30<br />
20<br />
10<br />
0<br />
Price (LHS) Rebased Rel (RHS)<br />
Jan-11 May-11 Sep-11 Jan-12 May-12 Sep-12<br />
The price relative chart measures performance against the<br />
MSCI CHINA F IDX which closed at 6647.58 on 07/01/13<br />
On 07/01/13 the spot exchange rate was HK$7.75/US$1<br />
400<br />
300<br />
200<br />
100<br />
0<br />
Performance over 1M 3M 12M<br />
Absolute (%) 5.2 19.6 130.9<br />
Relative (%) -0.1 8.0 105.2<br />
Great Wall Motor<br />
(2333.HK / 2333 HK)<br />
Greatly moving ahead<br />
08 January 2013<br />
Asia Pacific / <strong>China</strong><br />
■ Initiate with OUTPERFORM. We initiate coverage on Great Wall Motor<br />
(GWM) with an OUTPERFORM rating and a target price of HK$30.00, which<br />
implies 18.3% potential upside. GWM is the largest SUV maker in <strong>China</strong> with<br />
a market share around 13%. It is also <strong>China</strong>’s largest pick-up maker,<br />
contributing 33% of the country’s total pick-up sales .<br />
■ Strong SUV demand. <strong>China</strong>’s SUV segment is growing much faster than its<br />
other PV segments. It contributes 13% of the country’s total PV sales vs.<br />
32% in the US, implying high growth potential for SUV sales in <strong>China</strong>. Many<br />
Chinese car owners are choosing SUVs as their second vehicle. Therefore,<br />
we expect upgrade and replacement demand to become the major engine<br />
for SUV sales in the next few years. As the largest SUV maker in <strong>China</strong>, we<br />
believe GWM will be the major beneficiary of this strong SUV demand.<br />
■ New plant to support sales. GWM’s H6 is facing capacity constraints, with<br />
a waiting list of around 20 days. GWM will open its second plant in Tianjin in<br />
2H13, adding about 100,000 units of initial capacity. C50 will be transferred<br />
to the new plant to leave the existing plant purely for H6 production. We<br />
believe this arrangement will lay a solid foundation for GWM’s SUV sales in<br />
2013 and 2014. GWM also plans to launch five new models in 2H13, which<br />
we believe will enhance its leading position in this segment. Key downside<br />
risks include: (1) tougher-than-expected competition in the SUV segment; (2)<br />
slower-than-expected ramp up of its new capacity.<br />
■ Valuation. <strong>China</strong>’s SUV sales are growing at more than 20% per year,<br />
similar to its luxury auto sales. We believe that GWM is well positioned in the<br />
SUV sector and should trade at 13x 2013E EPS, a premium to its Chinese<br />
peers (10x 2013E EPS) given its higher-than-peers’ sales growth rate,<br />
margins as well as strong product mix.<br />
Financial and valuation metrics<br />
Year 12/11A 12/12E 12/13E 12/14E<br />
Revenue (Rmb mn) 30,089.5 41,600.0 47,220.3 54,770.0<br />
EBITDA (Rmb mn) 4,640.8 6,944.8 7,919.6 9,098.9<br />
EBIT (Rmb mn) 3,966.8 6,009.7 6,672.5 7,559.8<br />
Net profit (Rmb mn) 3,426.2 5,044.7 5,613.0 6,140.7<br />
EPS (CS adj.) (Rmb) 1.22 1.66 1.84 2.02<br />
Change from previous EPS (%) n.a.<br />
Consensus EPS (Rmb) n.a. 1.66 1.88 2.07<br />
EPS growth (%) 23.4 36.2 11.3 9.4<br />
P/E (x) 16.7 12.3 11.0 10.1<br />
Dividend yield (%) 0.6 0.8 0.9 1.0<br />
EV/EBITDA (x) 13.2 8.4 7.0 5.6<br />
P/B (x) 3.8 3.0 2.4 2.0<br />
ROE (%) 26.2 27.0 23.9 21.4<br />
Net debt/equity (%) Net cash Net cash Net cash Net cash<br />
Source: Company data, Thomson Reuters, Credit Suisse estimates.<br />
<strong>China</strong> <strong>Auto</strong> <strong>Sector</strong> 29
Greatly moving ahead<br />
No.1 SUV producer<br />
Hover series has been the No.1 best-selling SUV brand in <strong>China</strong> since 2009. Its first<br />
sedan-chassis SUV H6 was launched in August 2011. Its sales hit 15,800 units in<br />
November 2012, versus less than 6,000 in January 2012. Despite price cuts offered by its<br />
competitors, H6’s prices have stayed resilient throughout the year and customers still need<br />
to queue up for the vehicle. We believe H6’s strong sales is mainly due to GWM’s<br />
traditional strength in SUV production. We believe that GWM will maintain its leadership in<br />
the SUV segment over the next few years and be the major beneficiary of the strong SUV<br />
demand.<br />
Dominant pick-up market share<br />
GWM is also <strong>China</strong>’s largest pick-up producer, contributing about a third of the country’s<br />
total pick-up sales. In particular, its key pick-up brand, Wingle, has maintained its position<br />
as the No.1 best-selling pick-up for 15 years. Given GWM’s dominant share in the pick-up<br />
segment, we believe other players will not be able to challenge its leadership in the next<br />
few years. Moreover, we believe demand for pick-up trucks in inland regions will maintain<br />
strong growth in the next few years with GWM being the largest beneficiary.<br />
Expanding capacity + new models<br />
GWM’s second plant in Tianjin will start operations in 2H13, adding about 100,000 units of<br />
capacity by end-2013. C50 will be transferred to the second plant and the existing plant<br />
will be used to purely produce H6. We believe the capacity expansion will lay a solid<br />
foundation for GWM’s sales growth in the next few years. The company also plans to<br />
launch five new models in 2H13. We believe they will help to enhance its sales and<br />
improve its ASP. In particular, H8 is GWM’s first SUV model priced above Rmb150,000,<br />
which we expect to help improving its brand image and paving the way for its further<br />
expansion.<br />
Solid exports and sedan sales<br />
GWM is the fifth-largest auto exporter in <strong>China</strong>. SUVs and sedans have become its major<br />
export drivers in recent years. Its H6 has received the European Union’s market entry<br />
permit in December 2012, which would boost its exports to European markets starting<br />
from 2013. Its sedan exports grew the fastest among all segments in 2012 and we expect<br />
it to remain solid in the next few years. GWM’s two key sedan models—the C30 and<br />
C50—are very competitive in the low-end segment. We believe the sportive versions C30<br />
and C50 to be launched in 2013 will enhance GWM’s sedan sales. We also expect sedans<br />
to be a stable sales engine for the firm in the next two years.<br />
Initiate with an OUTPERFORM<br />
We initiate coverage on GWM with an OUTPERFORM rating given its leading position in<br />
<strong>China</strong>’s SUV segment. We believe it is well positioned to cater to strong SUV demand<br />
growth in <strong>China</strong>. Our target price for GWM is HK$30.00 based on 13x 2013E EPS. We<br />
believe it deserves to trade at premium toward its domestic peers (10x 2013E EPS), given<br />
strong sales volume in SUV, leading position in pick-up tracks as well as higher than<br />
industry average margins. Downside risks include tougher-than-expected competition in<br />
the SUV segment and slower-than-expected ramp-up of GWM’s new capacity.<br />
08 January 2013<br />
We believe GWM will be<br />
able to maintain its<br />
leadership in <strong>China</strong>’s SUV<br />
market<br />
We believe GWM will<br />
maintain its No.1 position in<br />
the pick-up segment and<br />
benefit from rising demand<br />
in inland regions<br />
We expect GWM’s<br />
expanding capacity and new<br />
models to enhance its<br />
position in the SUV segment<br />
We expect solid export and<br />
sedan business to be<br />
GWM’s stable sales engine<br />
in the next two years<br />
Initiate with an<br />
OUTPERFORM with TP<br />
based on 13x2013E EPS<br />
<strong>China</strong> <strong>Auto</strong> <strong>Sector</strong> 30
Great Wall Motor 2333.HK / 2333 HK<br />
Price (04 Jan 13): HK$25.35, Rating:: NEUTRAL [V], Target Price: HK$30.00, Analyst: Jack Yeung<br />
Target price scenario<br />
Scenario TP %Up/Dwn Assumptions<br />
Upside 32.02 26.31 2013E auto sales: 750,000 units<br />
Central Case 30.00 18.34 2013E auto sales: 701,000 units<br />
Downside 27.81 9.70 2013E auto sales: 650,000 units<br />
Income statement (Rmb mn) 12/11A 12/12E 12/13E 12/14E<br />
Sales revenue 30,089 41,600 47,220 54,770<br />
Cost of goods sold 22,594 30,889 35,212 41,021<br />
SG&A 2,477 3,203 3,636 4,217<br />
Other operating exp./(inc.) 378.3 562.5 452.9 432.7<br />
EBITDA 4,641 6,945 7,920 9,099<br />
Depreciation & amortisation 674 935 1,247 1,539<br />
EBIT 3,967 6,010 6,673 7,560<br />
Net interest expense/(inc.) (22.9) (18.4) (30.2) (42.3)<br />
Non-operating inc./(exp.) 143.2 199.7 226.7 262.9<br />
Associates/JV — — — —<br />
Recurring PBT 4,133 6,228 6,929 7,865<br />
Exceptionals/extraordinaries (2.2) — — —<br />
Taxes 620 1,059 1,178 1,573<br />
Profit after tax 3,511 5,169 5,751 6,292<br />
Other after tax income — — — —<br />
Minority interests 84.5 124.4 138.4 151.4<br />
Preferred dividends — — — —<br />
Reported net profit 3,426 5,045 5,613 6,141<br />
Analyst adjustments — — — —<br />
Net profit (Credit Suisse) 3,426 5,045 5,613 6,141<br />
Cash flow (Rmb mn) 12/11A 12/12E 12/13E 12/14E<br />
EBIT 3,967 6,010 6,673 7,560<br />
Net interest — 18.4 30.2 42.3<br />
Tax paid (620) (1,059) (1,178) (1,573)<br />
Working capital 303 1,063 374 503<br />
Other cash & non-cash items 799 1,135 1,474 1,802<br />
Operating cash flow 4,449 7,167 7,373 8,334<br />
Capex (3,759) (4,000) (3,800) (3,500)<br />
Free cash flow to the firm 690 3,167 3,573 4,834<br />
Disposals of fixed assets — — — —<br />
Acquisitions (7.4) — — —<br />
Divestments 1,802 — — —<br />
Associate investments — — — —<br />
Other investment/(outflows) (1,700) — — —<br />
Investing cash flow (3,664) (4,000) (3,800) (3,500)<br />
Equity raised 3,894 — — —<br />
Dividends paid (663.4) (347.4) (511.5) (569.1)<br />
Net borrowings 4.8 — — —<br />
Other financing cash flow 220.2 — — —<br />
Financing cash flow 3,456 (347) (511) (569)<br />
Total cash flow 4,241 2,820 3,061 4,265<br />
Adjustments (7.9) — — —<br />
Net change in cash 4,233 2,820 3,061 4,265<br />
Balance sheet (Rmb mn) 12/11A 12/12E 12/13E 12/14E<br />
Cash & cash equivalents 6,306 9,126 12,187 16,452<br />
Current receivables 10,033 12,296 13,958 16,189<br />
Inventories 2,777 3,554 4,052 4,720<br />
Other current assets 1,259 1,257 1,257 1,257<br />
Current assets 20,374 26,235 31,454 38,619<br />
Property, plant & equip. 7,392 10,457 13,010 14,971<br />
Investments 76.5 76.5 76.5 76.5<br />
Intangibles 1,871 1,871 1,871 1,871<br />
Other non-current assets 3,420 3,420 3,420 3,420<br />
Total assets 33,135 42,060 49,833 58,959<br />
Accounts payable 10,011 12,448 14,167 16,476<br />
Short-term debt — — — —<br />
Current provisions — — — —<br />
Other current liabilities 4,702 6,370 7,184 8,278<br />
Current liabilities 14,714 18,818 21,351 24,754<br />
Long-term debt — — — —<br />
Non-current provisions — — — —<br />
Other non-current liab. 1,400 1,400 1,400 1,400<br />
Total liabilities 16,113 20,218 22,751 26,154<br />
Shareholders' equity 16,396 20,929 25,973 31,491<br />
Minority interests 284.4 408.8 547.1 698.5<br />
Total liabilities & equity 33,135 42,060 49,832 58,958<br />
08 January 2013<br />
Key earnings drivers 12/11A 12/12E 12/13E 12/14E<br />
<strong>Auto</strong> sales volume (Unit) 463,391 620,500 701,000 801,000<br />
— — — —<br />
— — — —<br />
— — — —<br />
Per share data<br />
—<br />
12/11A<br />
—<br />
12/12E<br />
—<br />
12/13E<br />
—<br />
12/14E<br />
Shares (wtd avg.) (mn) 2,814 3,042 3,042 3,042<br />
EPS (Credit Suisse)<br />
1.22 1.66 1.84 2.02<br />
(Rmb) DPS (Rmb) 0.12 0.17 0.19 0.20<br />
BVPS (Rmb) 5.4 6.9 8.5 10.4<br />
Operating CFPS (Rmb) 1.58 2.36 2.42 2.74<br />
Key ratios and valuation 12/11A 12/12E 12/13E 12/14E<br />
Growth(%)<br />
Sales revenue 30.9 38.3 13.5 16.0<br />
EBIT 35.3 51.5 11.0 13.3<br />
Net profit 26.9 47.2 11.3 9.4<br />
EPS 23.4 36.2 11.3 9.4<br />
Margins (%)<br />
EBITDA 15.4 16.7 16.8 16.6<br />
EBIT 13.2 14.4 14.1 13.8<br />
Pre-tax profit 13.7 15.0 14.7 14.4<br />
Net profit 11.4 12.1 11.9 11.2<br />
Valuation metrics (x)<br />
P/E 16.7 12.3 11.0 10.1<br />
P/B 3.78 2.96 2.39 1.97<br />
Dividend yield (%) 0.61 0.83 0.92 1.00<br />
P/CF 12.9 8.6 8.4 7.4<br />
EV/sales 2.04 1.40 1.17 0.93<br />
EV/EBITDA 13.2 8.4 7.0 5.6<br />
EV/EBIT 15.4 9.7 8.3 6.8<br />
ROE analysis (%)<br />
ROE 26.2 27.0 23.9 21.4<br />
ROIC 35.4 42.6 40.1 38.7<br />
Asset turnover (x) 0.91 0.99 0.95 0.93<br />
Interest burden (x) 1.04 1.04 1.04 1.04<br />
Tax burden (x) 0.85 0.83 0.83 0.80<br />
Financial leverage (x) 1.95 1.93 1.84 1.80<br />
Credit ratios<br />
Net debt/equity (%) (37.0) (41.8) (45.0) (50.2)<br />
Net debt/EBITDA (x) (1.36) (1.31) (1.54) (1.81)<br />
Interest cover (x) (173) (327) (221) (179)<br />
Source: Company data, Thomson Reuters, Credit Suisse estimates.<br />
0<br />
2008 2009 2010 2011 2012 2013<br />
<strong>China</strong> <strong>Auto</strong> <strong>Sector</strong> 31<br />
16<br />
14<br />
12<br />
10<br />
8<br />
6<br />
4<br />
2<br />
3.0<br />
2.5<br />
2.0<br />
1.5<br />
1.0<br />
0.5<br />
12MF P/E multiple<br />
12MF P/B multiple<br />
0.0<br />
2008 2009 2010 2011 2012 2013<br />
Source: IBES
No.1 SUV producer<br />
GWM is <strong>China</strong>’s largest SUV producer, with a current market share around 13%, much<br />
higher than other top players (Figure 65). Its SUV sales have maintained strong growth in<br />
recent years, generally outperforming the industry average and major JV SUV makers<br />
(Figure 66, Figure 67 and Figure 68). In particular, its Hover series have been ranked the<br />
No.1 best-selling SUV in <strong>China</strong> since 2009, contributing to about half of its SUV sales and<br />
more than 20% of its total auto sales. Its first sedan-chassis Hover SUV H6 was launched<br />
in August 2011, mainly competing with domestic SUV models such as the BYD S6, Geely<br />
GX7 and Chery Tiggo (Figure 70). Despite price cuts offered by these domestic models,<br />
the H6 has the most resilient retail prices and customers still need to queue for the vehicle.<br />
H6 sales hit 15,800 units in November 2012 versus less than 6,000 in January 2012. Its<br />
strong sales are probably due to its outstanding quality and GWM’s good brand image in<br />
the domestic market. Given <strong>China</strong>’s rising SUV demand and GWM’s traditional strength in<br />
SUV production, we believe it will maintain its leadership in the SUV segment in the next<br />
few years.<br />
Figure 65: Top-15 SUV producers in <strong>China</strong><br />
Company JV/Indigenous 2011 sales Market share (%) Jan-Nov 12 sales Market share (%) Key model<br />
Great Wall Motor Indigenous 164,379 10.3 249,397 13.9 Hover<br />
Shanghai VW JV 129,172 8.1 168,472 9.4 Tiguan<br />
Dongfeng Honda JV 160,003 10.0 150,059 8.4 CR-V<br />
Beijing Hyundai JV 154,211 9.7 143,649 8.0 Tucson, IX35<br />
08 January 2013<br />
Dongfeng Nissan JV 140,426 8.8 120,329 6.7 Qashqai, X-Trail<br />
FAW Toyota JV 129,374 8.1 113,560 6.3 RAV4<br />
Chery <strong>Auto</strong> Indigenous 115,977 7.3 109,183 6.1 Tiggo<br />
Dongfeng Yueda KIA JV 109,095 6.8 104,837<br />
Sportage, Sportage<br />
5.9<br />
R<br />
FAW VW JV 58,632 3.7 83,094 4.6 Audi Q5<br />
BYD Indigenous 60,198 3.8 78,792 4.4 S6<br />
GAC Toyota JV 94,635 5.9 69,065 3.9 Highlander<br />
Jiangnan <strong>Auto</strong> Indigenous 73,349 4.6 44,009 2.5 Zotye T600<br />
Brilliance <strong>Auto</strong> Indigenous 1,233 0.1 43,579 2.4 Zhonghua V5<br />
Hawtai <strong>Auto</strong> Indigenous 18,486 1.2 29,864 1.7 Santa Fe<br />
Dongfeng Yulong JV 7,058 0.4 27,627 1.5 Luxgen 7<br />
Source: CAAM, Credit Suisse estimates<br />
Figure 66: SUV market share of top producers Figure 67: SUV sales of top producers<br />
16%<br />
14%<br />
12%<br />
10%<br />
8%<br />
6%<br />
4%<br />
2%<br />
0%<br />
Great Wall<br />
Motor<br />
Shanghai VW Dongfeng<br />
Honda<br />
2010 2011 2012E<br />
Beijing Hyundai FAW Toyota<br />
<strong>China</strong> <strong>Auto</strong> <strong>Sector</strong> 32<br />
300<br />
250<br />
200<br />
150<br />
100<br />
50<br />
-<br />
('000 units)<br />
Great Wall<br />
Motor<br />
Shanghai VW Dongfeng<br />
Honda<br />
2010 2011 2012E<br />
Source: CAAM, Credit Suisse estimates Source: CAAM, Credit Suisse estimates<br />
GWM is <strong>China</strong>’s No.1 SUV<br />
makers. We believe it will<br />
maintain its leadership in the<br />
SUV segment in the next<br />
few years.<br />
Beijing<br />
Hyundai<br />
FAW Toyota
Figure 68: Great Wall’s SUV sales vs. <strong>China</strong> SUV sales Figure 69: Great Wall’s revenue by product<br />
250%<br />
200%<br />
150%<br />
100%<br />
50%<br />
0%<br />
46%<br />
203%<br />
32%<br />
135%<br />
8%<br />
88%<br />
29%<br />
2007 2008 2009 2010 2011 2012E 2013E 2014E<br />
<strong>China</strong> SUV sales YoY Great Wall Motor SUV sales YoY<br />
20%<br />
08 January 2013<br />
<strong>China</strong> <strong>Auto</strong> <strong>Sector</strong> 33<br />
100%<br />
90%<br />
80%<br />
70%<br />
60%<br />
50%<br />
40%<br />
30%<br />
20%<br />
10%<br />
0%<br />
4% 4% 1% 1% 1% 1% 1%<br />
5%<br />
47%<br />
44%<br />
27%<br />
34%<br />
35%<br />
28%<br />
46%<br />
34%<br />
25% 24%<br />
25% 23% 21%<br />
40% 55% 59% 62%<br />
19% 17% 16%<br />
2008 2009 2010 2011 2012E 2013E 2014E<br />
Pick-up truck SUV Sedan Others<br />
Source: CAAM, Great Wall Motor, Credit Suisse estimates Source: Great Wall Motor, Credit Suisse estimates<br />
Figure 70: Comparison of Great Wall H6 and its major competitors<br />
Model<br />
Great Wall H6 BYD S6 Geely GLEagle GX7 Chery Tiggo<br />
1.5TMT Urban 2.0MT Delux 2.0MT Comfort 2.0MT Elite<br />
Official price (’000 Rmb) 100.8 89.8 102.9 115.8<br />
Dec-12 retail price (’000 Rmb) 100.8 81.8 95.9 104.8<br />
Size (m) 4.640/1.825/1.690 4.810/1.855/1.680 4.541/1.833/1.700 4.390/1.765/1.705<br />
Wheelbase (m) 2.68 2.72 2.661 2.51<br />
Trunk volume (Litre) 808 465 580 520<br />
Tank volume (Litre) 58 72 60 55<br />
Complete mass (kg) 1690 1620 1564 1455<br />
Engine size (L) 1.497 1.991 1.997 1.971<br />
Max power (kW/rpm) 110/5600 103/6000 104/6000 102/5750<br />
Max toque (n.m/rpm) 210/2200-4500 186/4000-4500 178/4000-4500 182/4600-4500<br />
Acceleration 0-100 km/h (s) 13.1 14.2 13.7 12.9<br />
Transmission 6MT 5MT 5MT 5MT<br />
Fuel consumption (L/100km) 8.7 8.6 8.8 7.2<br />
Warranty 5 years or 100,000km 4 years or 100,000km 3 years or 100,000km 2 years or 60,000km<br />
Emission standard National IV National IV National IV National IV<br />
Source: Xcar, Channel checks with dealers
Dominant in pick-up segment<br />
GWM is also <strong>China</strong>’s largest pick-up producer with a market share of around 33% (Figure<br />
72). Its Wingle series has been the No.1 best-selling pick-up for 15 years, with sales<br />
almost equivalent to the aggregate pick-up sales of the No.2 and No.3 players JAC and<br />
Zhengzhou Nissan (Figure 71). Given GWM’s dominant share in the pick-up segment, we<br />
believe that other players would not be able to challenge its No.1 position in the next few<br />
years. Pick-up has also shown stronger growth potential than other CV products in <strong>China</strong>.<br />
Pick-up sales grew by around 7% YoY in the first ten months of 2012, the highest in the<br />
CV segment (Figure 73). More than half of the pick-ups are priced below Rmb80,000, and<br />
we believe domestic automakers led by GWM will continue to dominate the market (Figure<br />
74 and Figure 75). Except for several affluent coastal regions, pick-up demand primarily<br />
came from inland regions (Figure 76). These regions have higher GDP growth rates than<br />
the national average and are the major engine of <strong>China</strong>’s urbanization. We believe that<br />
demand for pick-ups in these regions will remain strong in the next few years and the<br />
company is expected to be the largest beneficiary.<br />
Figure 71: Pick-up market share of top producers Figure 72: Pick-up sales of top producers<br />
35%<br />
30%<br />
25%<br />
20%<br />
15%<br />
10%<br />
5%<br />
0%<br />
Great Wall<br />
Motor<br />
JAC Zhengzhou<br />
Nissan<br />
2010 2011 2012E<br />
Zhongxing Foton<br />
08 January 2013<br />
<strong>China</strong> <strong>Auto</strong> <strong>Sector</strong> 34<br />
160<br />
140<br />
120<br />
100<br />
80<br />
60<br />
40<br />
20<br />
-<br />
('000 units)<br />
Great Wall<br />
Motor<br />
JAC Zhengzhou<br />
Nissan<br />
2010 2011 2012E<br />
Source: CAAM, Credit Suisse estimates Source: CAAM, Credit Suisse estimates<br />
Figure 73: <strong>China</strong>’s CV sales by segment Figure 74: Price distribution of pick-ups<br />
('000 units)<br />
300<br />
250<br />
200<br />
150<br />
100<br />
50<br />
0<br />
-50<br />
117<br />
76<br />
-24.4% YoY<br />
16<br />
4.6% YoY<br />
13<br />
MDT and HDT Medium and<br />
large Buses<br />
182<br />
147<br />
-5.1% YoY<br />
39<br />
6.7% YoY<br />
35<br />
275<br />
1.1% YoY<br />
228<br />
Light CVs Pick-up Minibus<br />
2011 sales Jan-Oct 2012 sales<br />
100.0%<br />
90.0%<br />
80.0%<br />
70.0%<br />
60.0%<br />
50.0%<br />
40.0%<br />
30.0%<br />
20.0%<br />
10.0%<br />
Source: State Information Centre Source: Sinotrust<br />
0.0%<br />
6.6%<br />
20.4%<br />
26.3%<br />
18.1%<br />
17.4%<br />
Zhongxing Foton<br />
11.6% 13.4% 12.9%<br />
3.9%<br />
6.1%<br />
2.2%<br />
5.5%<br />
2.7%<br />
8.5%<br />
25.1% 23.2% 20.5%<br />
11.7%<br />
24.4%<br />
20.3% 19.2%<br />
2009 2010 2011<br />
Below RMB60k RMB60k-69k RMB70k-79k RMB80k-89k<br />
RMB90k-100k RMB100k-110k Above RMB110k<br />
GWM is also <strong>China</strong>’s No.1<br />
pick-up maker. We believe it<br />
will benefit from strong pickup<br />
demand in inland<br />
regions.
Figure 75: Comparison of Great Wall Wingle and its major competitors<br />
Model<br />
08 January 2013<br />
Great Wall Wingle Zhongxing Grandtiger Dongfeng Ruiqi Huanghai Dachaishen<br />
2.4MT Biz Delux 2.4MT 4G69 2.4MT Standard 2.4MT 4WD Delux<br />
Official price (’000 Rmb) 77.8 71.9 79.8 79.8<br />
Dec-12 retail price ('000 Rmb) 72.8 68.9 74.8 75.8<br />
Size (m) 5.020/1.720/1.675 5.310/1.750/1.735 4.980/1.690/1.650 5.560/1.850/1.760<br />
Wheelbase (m) 3.05 3.1 2.95 3.5<br />
Tank volume (Litre) 66 73 60 74<br />
Complete mass (kg) 1545 1620 1495 1880<br />
Engine size (L) 2.378 2.438 2.438 2.378<br />
Max power (kW/rpm) 100/5250 100/5250 102/4600-5000 105/5250<br />
Max toque (n.m/rpm) 200/2500-3000 200/2500-3000 217/2600-3200 200/2500-3000<br />
Transmission 5MT 5MT 5MT 5MT<br />
Fuel consumption (L/100km) 10.4 10.6 10 10.7<br />
Warranty 2 years or 50,000km 2 years or 50,000km 2 years or 60,000km 2 years or 50,000km<br />
Emission standard National IV National III National IV + OBD National IV<br />
Source: Xcar, Channel checks with dealers<br />
Figure 76: Distribution of pick-up sales in <strong>China</strong><br />
Annual sales (units)<br />
Source: CPCA, CAAM, Credit Suisse estimates<br />
<strong>China</strong> <strong>Auto</strong> <strong>Sector</strong> 35
Expanding capacity + new models<br />
Capacity expansion in Tianjin<br />
GWM’s Tianjin plant (production base of H6 and C50) is running over its designed<br />
capacity of 200,000 units in 2012. Tianjin plant is able to provide 240,000-250,000 units of<br />
maximum capacity by adding shifts, with priority given to H6 production. The second plant<br />
in Tianjin will start operation in 2H13E, adding about 100,000 units of capacity by the end<br />
of 2013 (Figure 77). C50 will be transferred to the second plant after its commissioning<br />
and the existing plant will be used to purely produce H6. We expect GWM to keep running<br />
at full capacity in 2013, which would help to maintain its high operational efficiency (Figure<br />
77). We believe the solid expansion of its Tianjin plant’s capacity will lay a solid foundation<br />
for GWM’s sales growth in next few years.<br />
Figure 77: Production capacity versus sales volume<br />
2011 2012E 2013 E<br />
08 January 2013<br />
Utilisation Utilisation Utilisation<br />
’000 units Capacity Sales rate (%) Capacity Sales rate (%) Capacity Sales rate (%)<br />
SUV 180 150 83 240 278 116 340 360 106<br />
Sedan 200 190 95 220 200 91 220 220 100<br />
Pick-up truck 120 120 100 140 137 98 140 150 107<br />
Total 500 460 92 600 615 103 700 730 104<br />
Source: Great Wall Motor, Credit Suisse estimates<br />
New models to improve ASP<br />
Figure 78: Launch time of Great Wall’s new models in 2013<br />
Jan Feb Mar Apr May Jun Jul Aug Sep Oct Nov Dec<br />
Updated Wingle 5 Mid-2013<br />
H2 2H13<br />
H6 sportive version 3Q13<br />
C50 sportive version 3Q13<br />
C30 sportive version 3Q13<br />
Source: Great Wall Motor<br />
Figure 79: Great Wall’s ASPs by segments<br />
('000 RMB)<br />
80<br />
75<br />
70<br />
65<br />
60<br />
55<br />
50<br />
45<br />
40<br />
68.5<br />
56.2<br />
54.3<br />
45.8<br />
73.1<br />
59.8<br />
77.2 78.0 77.2 78.0<br />
60.8<br />
63.4 63.9 64.6<br />
54.9<br />
56.6 54.9 54.4 53.9<br />
48.9 50.5<br />
48.9 48.5 48.0<br />
2009 2010 2011 2012E 2013E 2014E<br />
Source: Great Wall Motor, Credit Suisse estimates<br />
Pick-up SUV Sedan Overall<br />
Tianjin plant’s capacity<br />
expansion will laid a solid<br />
foundation for GWM’s sales<br />
growth in next few years.<br />
<strong>China</strong> <strong>Auto</strong> <strong>Sector</strong> 36
GWM plans to launch five new models in 2H13 with higher prices (Figure 78 and Figure<br />
81). This is consistent with its strategy in recent years to gradually improve its ASP by new<br />
model launches (Figure 79). In particular, the H8 will be GWM’s first SUV priced between<br />
Rmb200,000 and Rmb250,000 in the mid-to-high end segment, which may be launched in<br />
early 2014. We believe that H8 is more symbolic for GWM to improve its brand image and<br />
elevate prices for its future SUV models. We expect H8 sales to ramp up slower than<br />
existing company models, as competition in the mid- to high-end segment is intensifying<br />
following more than ten new models being launched by JVs since 4Q12 (Figure 36). We<br />
do not think H8 will become a key sales driver for GWM within next few years.<br />
Figure 80: Great Wall Motor’s vehicle models<br />
08 January 2013<br />
Segment Model Price (’000 Rmb) Launch time of new model 2012E sales (’000 units) 2013E sales (’000 units)<br />
Pick-up Deer 59.8 – 75.8 23.7 24.5<br />
Wingle 3 70.8 - 120.8<br />
Wingle 5 71.8 - 125.8<br />
113.3 115.5<br />
Updated Wingle 5 75 - 130 Mid-2013<br />
SUV H2 80 - 180 2H13 5.5<br />
H3<br />
H5<br />
92.8 - 158.8<br />
92.8 - 170.8<br />
81.8 98<br />
H6<br />
H6 sportive version<br />
100.8 - 151.8<br />
145 - 160 3Q13<br />
132.8 165<br />
M1 42.9 - 59.9<br />
M2 67.9 - 89.9<br />
63.9 72<br />
M4 63.9 - 71.9<br />
Sedan Florid 59.9 - 78.9 11.4 12<br />
Phenom 57.8 - 80.9 2.7 3<br />
C30 64.5 - 83.5<br />
135.6 145<br />
C30 sportive version 75 - 88 3Q13<br />
C20R 62.9 - 72.9 12.8 13.5<br />
C50 78 - 91.8<br />
37.5 41<br />
C50 sportive version 82 - 97 3Q13<br />
Cross-over Cowry 116.8 - 136.8 5.5 6<br />
Total 621 701<br />
Source: Great Wall Motor, Credit Suisse estimates<br />
Figure 81: Official prices of Great Wall models<br />
H8<br />
H6 sportive version<br />
H5<br />
H2<br />
Cowry<br />
H6<br />
H3<br />
Updated Wingle 5<br />
Wingle 5<br />
Wingle 3<br />
C50 sportive version<br />
C50<br />
C30 sportive version<br />
M2<br />
C30<br />
Florid<br />
Phenom<br />
M4<br />
C20R<br />
M1<br />
Source: Great Wall Motor<br />
- 50,000 100,000 150,000 200,000 250,000 300,000<br />
Existing model New model<br />
GWM’s new models have<br />
higher prices, which would<br />
improve its ASPs in the next<br />
few years<br />
<strong>China</strong> <strong>Auto</strong> <strong>Sector</strong> 37<br />
RMB
Solid exports and sedan sales<br />
Growing exports driven by SUVs and sedans<br />
GWM is the fifth-largest auto exporter in <strong>China</strong>, contributing about 8% of the country’s total<br />
auto exports for Jan-Nov 2012 and around 10% in the same period of last year (Figure<br />
82). Most of its exports comprise pick-ups, whose share has kept declining in recent years<br />
(Figure 83). GWM’s H6 has received the EU’s market entry permit in December 2012,<br />
which would boost exports to the EU and Eastern European countries starting from 2013.<br />
Although its sedan sales grew the slowest in the domestic market, sedan exports grew the<br />
fastest among all segments in 2012 (Figure 85 and Figure 86). Given the recovery in the<br />
global economy and its improving brand image in overseas markets, we believe that its<br />
exports will remain solid in coming years and contribute over 20% of its total sales in 2014<br />
(Figure 84).<br />
Figure 82: Market shares of Chinese auto exports<br />
Brilliance <strong>Auto</strong><br />
1%<br />
SH GM Wuling<br />
3%<br />
BYD<br />
4%<br />
JAC<br />
11%<br />
Honda (<strong>China</strong>)<br />
5%<br />
Great Wall<br />
10%<br />
Others<br />
10%<br />
SH GM<br />
6%<br />
Jan-Nov 2011<br />
Source: CAAM, Credit Suisse estimates<br />
Lifan<br />
9%<br />
Chery<br />
33%<br />
Geely<br />
8%<br />
Brilliance <strong>Auto</strong><br />
2%<br />
SH GM Wuling<br />
2%<br />
08 January 2013<br />
<strong>China</strong> <strong>Auto</strong> <strong>Sector</strong> 38<br />
BYD<br />
3%<br />
JAC<br />
4%<br />
Honda (<strong>China</strong>)<br />
5%<br />
Great Wall<br />
8%<br />
SH GM<br />
10%<br />
Others<br />
10%<br />
Jan-Nov 2012<br />
Figure 83: Great Wall’s exports by segment Figure 84: Great Wall exports as % of total sales<br />
100%<br />
90%<br />
80%<br />
70%<br />
60%<br />
50%<br />
40%<br />
30%<br />
20%<br />
10%<br />
0%<br />
6%<br />
9%<br />
84%<br />
16% 15%<br />
34% 39%<br />
50%<br />
21%<br />
37%<br />
46% 43%<br />
2009 2010 2011 2012E<br />
Pick-up SUV Sedan<br />
('000 units)<br />
1,500<br />
1,250<br />
1,000<br />
750<br />
500<br />
250<br />
-<br />
15%<br />
210<br />
14%<br />
363<br />
17%<br />
463<br />
32 50 79 98<br />
16%<br />
Lifan<br />
13%<br />
620<br />
19%<br />
140<br />
736<br />
182<br />
Chery<br />
28%<br />
22%<br />
2009 2010 2011 2012E 2013E 2014E<br />
827<br />
Geely<br />
15%<br />
Export Total sales Export as % of total sales<br />
Source: Great Wall Motor, Credit Suisse estimates Source: Great Wall Motor, Credit Suisse estimates<br />
We believe GWM’s export<br />
will remain solid in coming<br />
years and contribute over<br />
20% of its sales since 2014<br />
25%<br />
20%<br />
15%<br />
10%<br />
5%<br />
0%
Figure 85: Export growth by product Figure 86: Domestic sales growth by product<br />
Export y-y<br />
500%<br />
400%<br />
300%<br />
200%<br />
100%<br />
0%<br />
-100%<br />
-7%<br />
44%<br />
467%<br />
82%<br />
17% 16%<br />
300%<br />
67%<br />
50%<br />
Pick-up truck SUV Sedan<br />
2010 2011 2012E<br />
08 January 2013<br />
<strong>China</strong> <strong>Auto</strong> <strong>Sector</strong> 39<br />
140%<br />
120%<br />
100%<br />
80%<br />
60%<br />
40%<br />
20%<br />
0%<br />
-20%<br />
Domestic sales<br />
y-y<br />
51%<br />
15%<br />
12%<br />
118%<br />
-3%<br />
108%<br />
72%<br />
52%<br />
Pick-up truck SUV Sedan<br />
2010 2011 2012E<br />
Source: Great Wall Motor, Credit Suisse estimates Source: Company data, Credit Suisse estimates<br />
Solid sedan sales<br />
Sales of GWM’s two key sedan models, the C30 and C50, picked up fast after their launch<br />
in May 2010 and December 2011. Their ramp-up speed is similar to its flagship SUV<br />
model, the H6, which was launched in August 2011 (Figure 87). C30 and C50 are<br />
competitive models in the low-end segment. C30 offers attractive prices and the longest<br />
warranty among domestic brands (Figure 89). C50 offers the most powerful engine and<br />
also the longest warranty among its domestic and JV competitors (Figure 90). We believe<br />
the sportive version C30 and C50 to be launched in 2013 will enhance GWM’s sedan<br />
sales. We also expect sedans to be a stable sales engine for GWM in in the next two<br />
years, contributing about 30% of its total sales (Figure 88).<br />
Figure 87: Sales ramp-up of C30, C50 and H6 Figure 88: Great Wall’s sales by product<br />
Unit<br />
18,000<br />
100%<br />
90%<br />
2%<br />
12%<br />
3% 1% 1% 1% 1% 1%<br />
16,000<br />
14,000<br />
80%<br />
70%<br />
41%<br />
34%<br />
41%<br />
32% 30% 29%<br />
12,000<br />
60%<br />
47%<br />
10,000<br />
8,000<br />
50%<br />
40%<br />
32%<br />
38%<br />
32%<br />
45% 49% 51%<br />
6,000<br />
4,000<br />
2,000<br />
-<br />
1st 2nd 3rd 4th 5th 6th 7th 8th 9th 10th 11th 12th<br />
months after initial launch<br />
C30 C50 H6<br />
30%<br />
20%<br />
10%<br />
0%<br />
39%<br />
24% 27% 26%<br />
3%<br />
22% 20% 19%<br />
2008 2009 2010 2011 2012E 2013E 2014E<br />
Pick-up SUV Sedan Cross-over<br />
Source: Great Wall Motor Source: Great Wall Motor, Credit Suisse estimates<br />
We also expect sedans to<br />
be a stable sales engine for<br />
GWM in in the next two<br />
years, contributing about<br />
30% of its total sales
Figure 89: Comparison of Great Wall C30 and its major competitors<br />
Model<br />
08 January 2013<br />
Great Wall C30 BYD G3 Changan Yuexiang V5<br />
SH GM Wuling Baojun<br />
630<br />
1.5MT Comfort 1.5MT Standard 1.5MT Fantasy 1.5DVVT Standard<br />
Official price (’000 Rmb) 64.5 62.9 65.9 65.8<br />
Dec 12 retail price ('000 Rmb) 60.5 57.9 62.9 59.8<br />
Size (m) 4.452/1.705/1.480 4.600/1.705/1.490 4.415/1.710/1.475 4.597/1.736/1.462<br />
Wheelbase (m) 2.61 2.61 2.515 2.64<br />
Trunk volume (litre) 510 430 550 445<br />
Tank volume (litre) 40 50 45 54<br />
Complete mass (kg) 1125 1200 1120 1220<br />
Engine size (L) 1.497 1.497 1.499 1.485<br />
Max power (kW/rpm) 78/6000 80/5800 84/6000 82/5800<br />
Max toque (n.m/rpm) 138/4200 145/4800 145/4000-5000 147/3600-4000<br />
Acceleration 0-100 km/h (s) 12.7 11 11.2 12.8<br />
Transmission 5MT 5MT 5MT 5MT<br />
Fuel consumption (L/100km) 6.5 6.2 6.5 6.7<br />
Warranty 4 years or 150,000km 2 years or 60,000km 3 years or 60,000km 3 years or 60,000km<br />
Emission standard Euro IV National IV National IV National IV<br />
Source: Xcar, Channel checks with dealers<br />
Figure 90: Comparison of Great Wall C50 and its major competitors<br />
Model<br />
Great Wall C50 Geely Emgrand EC7 Nissan Sunny Hyundai Elantra<br />
1.5T MT Delux 1.5MT Standard 1.5MT XE Comfort 1.6MT Comfort<br />
Official price (’000 Rmb) 78.0 75.8 82.8 89.8<br />
Dec-12 retail price (’000<br />
Rmb)<br />
75.0 71.8 73.8 79.8<br />
Size (m) 4.650/1.775/1.455 4.635/1.789/1.470 4.426/1.696/1.518 4.545/1.725/1.425<br />
Wheelbase (m) 2.7 2.65 2.6 2.61<br />
Trunk volume (Litre) 530 680 490 368<br />
Tank volume (Litre) 50 50 41 55<br />
Complete mass (kg) 1255 1258 1021 1250<br />
Engine size (L) 1.497 1.498 1.498 1.599<br />
Max power (kW/rpm) 98/5600 80/6000 82/5600 82/6000<br />
Max toque (n.m/rpm) 188/2000-4500 135/4800 139/4000 145/4500<br />
Acceleration 0-100 km/h (s) 9.7 11.5 12.5 11.2<br />
Transmission 5MT 5MT 5MT 5MT<br />
Fuel consumption (L/100km) 6.9 6.6 6.1 7.5<br />
Warranty 5 years or 150,000km 3 years or 100,000km 3 years or 100,000km 2 years or 60,000km<br />
Emission standard National IV National IV Euro IV National IV<br />
Source: Xcar, Channel checks with dealers<br />
<strong>China</strong> <strong>Auto</strong> <strong>Sector</strong> 40
Initiate with OUTPERFORM<br />
We initiate coverage on GWM with an OUTPERFORM rating given its leading position in<br />
<strong>China</strong>’s SUV segment. Our target price for GWM is HK$30.00 based on 13x 2013E EPS.<br />
Given its higher than industry average sales growth rate, margins as well as strong<br />
product mix, we believe that it should trade at a premium towards its domestic peers,<br />
which are trading at around 10x 2013E EPS.<br />
Figure 91: Valuation comparison table<br />
H Share automaker Price Market Dividend<br />
08 January 2013<br />
cap P/E (x) P/B (x) yield (%) ROE (%)<br />
(l.c.) (US$ mn) 11 12E 13E 14E 11 12E 13E 14E 11 12E 13E 14E 11 12E 13E 14E<br />
Brilliance <strong>China</strong> <strong>Auto</strong> 1114.HK 10.58 6,089 19.7 14.8 12.1 9.9 7.6 5.7 4.3 3.3 - 0.0 0.1 0.3 27.2 29.4 28.6 26.6<br />
Dongfeng Motors 0489.HK 12.04 10,817 8.0 9.6 6.6 6.1 2.2 1.9 1.7 1.4 1.5 1.3 1.5 1.6 25.0 17.6 18.0 17.3<br />
Geely 0175.HK 4.08 3,381 16.1 12.9 11.0 9.1 2.6 2.3 1.9 1.7 0.7 0.9 1.1 1.3 18.6 17.1 17.6 17.3<br />
Great Wall Motor 2333.HK 25.35 10,105 16.3 12.7 10.9 9.5 3.8 3.0 2.5 2.1 1.4 1.9 2.1 2.4 25.6 24.9 23.3 21.6<br />
Guangzhou <strong>Auto</strong> 2238.HK 7.14 4,955 7.8 15.0 10.2 8.2 1.5 1.4 1.3 1.2 2.8 1.5 2.2 2.6 15.6 8.3 10.5 12.1<br />
Qingling Motors 1122.HK 2.05 599 11.1 11.7 10.2 9.9 0.6 0.6 0.6 0.6 7.1 6.4 6.9 7.0 4.9 4.6 5.1 5.5<br />
Sinotruk 3808.HK 6.20 1,632 11.1 29.4 13.9 10.1 0.8 0.8 0.8 0.8 1.6 1.1 1.4 1.6 5.4 2.8 3.8 5.0<br />
Weichai Power Co. Ltd 2338.HK 35.80 8,295 10.1 14.8 12.3 11.0 2.6 2.0 1.8 1.6 0.3 0.6 0.6 0.7 27.0 14.0 14.6 14.3<br />
Mkt cap–wtd avg 12.5 13.5 10.3 8.9 3.2 2.6 2.1 1.8 1.2 1.2 1.4 1.6 23.3 18.4 18.4 17.8<br />
Source: Bloomberg consensus<br />
Valuation comparison with Brilliance<br />
Both GWM and Brilliance are positioned in segments with strong sales growth potential:<br />
SUV and luxury PVs. Since 2010, GWM has traded at an average discount of 44% to<br />
Brilliance in terms of 12-month forward P/E (Figure 93). Currently, it trades at a 17%<br />
discount to Brilliance. GWM has traded at an average 12-month forward P/E of 7.4x after<br />
its capitalization issue in January 2011, compared to Brilliance's average P/E of 13.5x<br />
(Figure 92). It now trades at 11.1x 12-month forward P/E, versus Brilliance’s 13.4x.<br />
Figure 92: 12-month forward P/E band—Great Wall* vs.<br />
Brilliance<br />
22<br />
20<br />
18<br />
16<br />
14<br />
12<br />
10<br />
8<br />
6<br />
4<br />
2<br />
Jan-10 Aug-10 Mar-11 Oct-11 May-12 Jan-13<br />
Brilliance 12m forward P/E Great Wall 12m forward P/E<br />
*Adjusted for the effect of its capitalisation issue in January 2011<br />
Source: Bloomberg consensus<br />
Figure 93: Great Wall’s P/E multiple* discount to Brilliance<br />
-80%<br />
Jan-10 Aug-10 Mar-11 Oct-11 May-12 Jan-13<br />
<strong>China</strong> <strong>Auto</strong> <strong>Sector</strong> 41<br />
0%<br />
-10%<br />
-20%<br />
-30%<br />
-40%<br />
-50%<br />
-60%<br />
-70%<br />
Great Wall 12m forward P/E discount average discount<br />
* Adjusted for the effect of its capitalisation issue in January 2011<br />
Source: Bloomberg consensus<br />
Initiate coverage on GWM<br />
with an OUTPERFORM and<br />
TP based on 13x 2013E<br />
EPS<br />
Valuation comparison with<br />
Brilliance
Valuation comparison with sector index<br />
GWM’s average P/E multiple discount over the MSCI <strong>China</strong> Consumer Discretionary Index<br />
has been 56% since 2010, compared with Brilliance’s average discount of 21% (Figure 95).<br />
Since its capitalization issue in January 2011, GWM has traded at an average discount of<br />
47% over the MSCI <strong>China</strong> Consumer Discretionary Index (Figure 95). This compares with<br />
Brilliance’s average discount of 7%. GWM’s valuation has steadily improved since 2011<br />
(Figure 94 and Figure 95). We believe that GWM’s P/E multiple discount over Brilliance<br />
has great potential to narrow in the near term, given its leading position in <strong>China</strong>’s SUV<br />
segment.<br />
Figure 94: Forward P/E band for Great Wall Motor, Brilliance and MSCI <strong>China</strong> Consumer<br />
Discretionary Index<br />
22<br />
20<br />
18<br />
16<br />
14<br />
12<br />
10<br />
8<br />
6<br />
4<br />
2<br />
Jan-10 Apr-10 Aug-10 Nov-10 Mar-11 Jul-11 Oct-11 Feb-12 May-12 Sep-12 Jan-13<br />
Source: Bloomberg consensus, MSCI<br />
Brilliance 12m forward P/E<br />
Great Wall 12m forward P/E<br />
MSCI <strong>China</strong> Consumer Discretionary Index 12m forward P/E<br />
Figure 95: P/E multiple discount to MSCI <strong>China</strong> Consumer Discretionary Index<br />
20%<br />
0%<br />
-20%<br />
-40%<br />
-60%<br />
-80%<br />
-100%<br />
Jan-10 Apr-10 Aug-10 Nov-10 Mar-11 Jul-11 Oct-11 Feb-12 May-12 Sep-12 Jan-13<br />
Source: Bloomberg consensus, MSCI<br />
Great Wall 12m forward P/E discount Brilliance 12m forward P/E discount<br />
08 January 2013<br />
Valuation comparison with<br />
sector index<br />
<strong>China</strong> <strong>Auto</strong> <strong>Sector</strong> 42
Risks to our investment case<br />
Tougher-than-expected competition in SUV segment<br />
More than ten new mid- to high-end SUV models and 12 new mid-end and low-end SUV<br />
models are being launched in the Chinese market from 4Q12 (Figure 37 and Figure 38).<br />
GWM has the leading position in <strong>China</strong>’s SUV segment mainly in the price range of less<br />
than Rmb150,000. We do not think new models launched by domestic automakers below<br />
Rmb150,000 will significantly drag down its market share. However, the company may<br />
face competitive pressure from the mid- to high-end segment, especially from Japanese<br />
brands and GM. Japanese brands may offer more price cuts in 2013 to regain their market<br />
share. The retail prices of some of their SUV models, as well as their JV partners’ selfowned<br />
brands (such as Trumpche), are already below Rmb150,000 (Figure 96). The retail<br />
prices of GM’s mid-to-high end brands such as Buick’s Encore and Chevrolet’s Orlander<br />
(to be launched in early 2013) also have basic models priced below Rmb150,000. As the<br />
competition in the mid-to-high end segment intensifies, it is likely that these models may<br />
offer massive price cuts to boost sales. This is expected to exert top-down pressure on the<br />
mid-end and low-end segments, and may impact GWM’s sales.<br />
08 January 2013<br />
Figure 96: Nissan, Mitsubishi, and Trumpche SUV models selling below Rmb150,000<br />
Official Oct-2012 Price Nov 2012 Price Dec-2012 Price<br />
price retail price cut retail price cut retail price cut<br />
Brand Model (’000 Rmb) (’000 Rmb) (%) (’000 Rmb) (%) (’000Rmb) (%)<br />
Nissan Qashiqai 1.6MT XE 2012 2WD 139.8 126.8 9 127.8 9 126.8 9<br />
Qashiqai 2.0MT XL 2012 2WD 151.8 138.8 9 139.8 8 138.8 9<br />
Mitsubishi ASX 1.6MT Standard 128.8 128.8 0 88.8 31<br />
ASX 2.0MT Comfort 148.8 148.8 0 108.8 27<br />
Trumpche GS5 2.0MT Comfort 2012 123.8 115.8 6 113.8 8 115.8 6<br />
GS5 2.0MT Elite 2012 133.8 125.8 6 123.8 7 125.8 6<br />
GS5 2.0MT Elite ESP 2012 138.8 130.8 6 128.8 7 130.8 6<br />
GS5 2.0AT Elite 2012 149.8 141.8 5 139.8 7 141.8 5<br />
Buick Encore 1.4T MT Urban Advance 2013 149.9 149.9 0 149.9 0 149.9 0<br />
Source: Company data, Credit Suisse estimates<br />
Slower-than-expected ramp-up of new capacities<br />
GWM’s Tianjin plant is suffering capacity constraints due to strong demand for H6. The<br />
new plant in Tianjin should add 100,000 units of new capacity by the end of 2013.<br />
However, its effective capacity may be lower than 50,000 units, as it may start operations<br />
in 2H13E. The existing Tianjin plant’s designed capacity is 200,000 units, which is<br />
expected to be raised to 240,000-250,000 by adding shifts. Its current monthly production<br />
volume for the H6 is around 16,000 units and around 6,000 units for the C50. This is<br />
equivalent to 264,000 units p.a. and already exceeds the plant’s maximum capacity. The<br />
capacity constraint may help to keep H6’s current prices as it is short of supply. However,<br />
if the waiting list continues to grow, customers may lose their patience and turn to other<br />
SUV models launched by GWM’s competitors. Therefore, any delay in new capacity may<br />
not only affect its sales in 2013, but also affect market share given debuts of new models<br />
by its competitors.<br />
JV’s mid- to high-end<br />
models may offer massive<br />
price cuts and impact<br />
GWM’s sales<br />
Slower-than-expected rampup<br />
of GWM’s new capacity<br />
in Tianjin plant may affect its<br />
shipment and sales<br />
<strong>China</strong> <strong>Auto</strong> <strong>Sector</strong> 43
Rating NEUTRAL* [V]<br />
Price (04 Jan 13, HK$) 22.85<br />
Target price (HK$) 20.00¹<br />
Upside/downside (%) -12.5<br />
Mkt cap (HK$ mn) 56,976 (US$ 7,352)<br />
Enterprise value (Rmb mn) 61,496<br />
Number of shares (mn) 2,354.10<br />
Free float (%) 60.5<br />
52-week price range 28.4 - 12.7<br />
ADTO - 6M (US$ mn) 7.9<br />
*Stock ratings are relative to the coverage universe in each<br />
analyst's or each team's respective sector.<br />
¹Target price is for 12 months.<br />
[V] = Stock considered volatile (see Disclosure Appendix).<br />
Share price performance<br />
60<br />
40<br />
20<br />
Research Analysts<br />
Jack Yeung<br />
852 2101 6779<br />
jack.yeung@credit-suisse.com<br />
Price (LHS) Rebased Rel (RHS)<br />
0<br />
Jan-11 May-11 Sep-11 Jan-12 May-12 Sep-12<br />
The price relative chart measures performance against the<br />
MSCI CHINA F IDX which closed at 6652.07 on 04/01/13<br />
On 04/01/13 the spot exchange rate was HK$7.75/US$1<br />
120<br />
Performance over 1M 3M 12M<br />
Absolute (%) 18.8 69.8 33.9<br />
Relative (%) 11.4 53.0 11.0<br />
70<br />
20<br />
BYD Co Ltd<br />
(1211.HK / 1211 HK)<br />
Electric car yet to commercialize<br />
08 January 2013<br />
Asia Pacific / <strong>China</strong><br />
■ Initiate with NEUTRAL. We initiate coverage on BYD with a NEUTRAL<br />
rating and a target price of HK$20.00, which implies 12.5% potential<br />
downside. BYD is the third largest low-end sedan maker in <strong>China</strong> just behind<br />
Geely and Chery. It also produces electric vehicles (EV) with trial fleets in<br />
Shenzhen. Meanwhile, it is the world’s largest handset battery maker.<br />
■ Intensifying competition at the low-end segment. BYD’s conventional<br />
vehicles primarily focus on the low-end segment, where competition is<br />
intensifying. Till Nov 2012, BYD’s monthly sedan sales were about 15%<br />
lower than in 2011 and over 20% lower than in 2010. We expect its sedan<br />
sales to remain weak in 2013 mainly due to intensifying competition. The<br />
company is recalibrating its product strategy by introducing more upscale<br />
models such as the SUV S6. We believe that it will miss its 2012 S6 sales<br />
target facing strong competition from Great Wall’s H6 and Geely’s GX7. It<br />
seems that BYD currently does not have other major breakthrough products<br />
in the low-end segment to support its future sales growth.<br />
■ Negative catalyst. BYD’s profit from handset components and assembly<br />
services may fall more than over 90% YoY in 2012. Its major customers<br />
Nokia and HTC continued to suffer declines in market share, which is likely<br />
to impact its 2013 orders. We expect its solar segment to continue losses in<br />
2013 mainly due to declining solar prices caused by oversupply in the<br />
industry. <strong>China</strong>'s solar sector might experience a wave of consolidation in<br />
the years ahead, which could exert high pressure on small solar<br />
manufacturers such as BYD.<br />
■ Valuation. Our target price of HK$20.00 for BYD is based on a sum-of-theparts<br />
(SoTP). We value its auto business at HK$10.20 by using discounted<br />
cash flow (DCF). We use sector average P/E multiples for both its handset<br />
components and assembly business (valued at HK$9.10 based on 18x 2013E<br />
P/E) and battery business (valued at HK$0.70 based on 12x 2013E P/E).<br />
Financial and valuation metrics<br />
Year 12/11A 12/12E 12/13E 12/14E<br />
Revenue (Rmb mn) 46,312.3 47,825.3 58,062.5 63,172.2<br />
EBITDA (Rmb mn) 4,984.3 4,833.8 6,545.9 7,333.0<br />
EBIT (Rmb mn) 2,468.5 1,299.2 2,434.5 2,780.9<br />
Net profit (Rmb mn) 1,384.6 172.3 716.3 769.5<br />
EPS (CS adj.) (Rmb) 0.60 0.07 0.30 0.33<br />
Change from previous EPS (%) n.a.<br />
Consensus EPS (Rmb) n.a. 0.16 0.42 0.57<br />
EPS growth (%) -46.1 -87.8 315.8 7.4<br />
P/E (x) 30.7 251.0 60.4 56.2<br />
Dividend yield (%) 0 0 0 0<br />
EV/EBITDA (x) 12.1 12.7 9.5 8.5<br />
P/B (x) 2.0 2.0 2.0 1.9<br />
ROE (%) 7.0 0.8 3.3 3.4<br />
Net debt/equity (%) 61.2 64.5 64.2 63.3<br />
Source: Company data, Thomson Reuters, Credit Suisse estimates.<br />
<strong>China</strong> <strong>Auto</strong> <strong>Sector</strong> 44
Electric car yet to commercialize<br />
Weak conventional vehicle sales<br />
BYD’s conventional vehicles primarily focus on the low-end segment, where demand<br />
growth is slowing down and competition is intensifying. Up until November 2012, BYD’s<br />
monthly sedan sales volume was still about 15% lower than in 2011 and over 20% lower<br />
than in 2010. We expect its sedan sales to remain weak in 2013 mainly due to a lack of<br />
attractive models and intensifying competition. BYD is recalibrating its product strategy<br />
and introducing more upscale models, such as the SUV S6 and mid-sized sedan G6. We<br />
believe that BYD will miss its S6 sales target in 2012 mainly due to strong competition<br />
from Great Wall’s H6, whose sales and market share have grown throughout the year.<br />
BYD lost momentum in terms of conventional vehicles in recent years. Even though it has<br />
done well with some low-end models such as the S6, it does not have other major<br />
breakthrough products in this area.<br />
EV business in its infancy stage<br />
BYD has made remarkable progress in its electric vehicle (EV) segment. Its electric MPV<br />
E6 has been under trial running in Shenzhen for two years as an electric taxi. Its E-Bus K9<br />
has also received thousands of orders from both domestic and overseas markets.<br />
Compared with other EV projects operated by domestic players, BYD is a leader in initial<br />
commercialization. However, major technical efforts in the auto industry are still<br />
concentrating on improving the current combustion engine technology. Moreover, currently<br />
almost all charging infrastructures in <strong>China</strong> are built by state-owned enterprise (SOE) grid<br />
companies and lag behind schedule. We expect policy support to remain the major<br />
determining force for <strong>China</strong>’s EV industry in the next few years. We believe BYD’s EV<br />
business will still be constrained by the infrastructure issue and is unlikely to spread over<br />
to the national market shortly.<br />
Uncertainties in handset and solar<br />
BYD’s profit from handset components and assembly may fall more than 90% YoY in 2012,<br />
as its major customers, Nokia and HTC, continue to suffer declines in market share. Given<br />
the strong competition in the mobile phone and smart phone segments, we think it would<br />
be unlikely for these two companies to quickly achieve a dramatic rebound in market share.<br />
This is likely to impact BYD’s 2013 orders and margins for handset components and<br />
rechargeable batteries. Moreover, we expect its solar segment to continue losses in 2013<br />
mainly due to declining solar prices, which is caused by oversupply in the industry. <strong>China</strong>'s<br />
solar sector might experience a wave of mergers, restructurings and company failures in<br />
the years ahead, which could exert high pressure on small manufacturers such as BYD.<br />
Initiate with a NEUTRAL<br />
We initiate coverage on BYD with a NEUTRAL rating. We believe that its EV business has<br />
long-term potential earnings upside but its conventional vehicle segment as well as<br />
handset and solar segments will remain weak in the near term. We value BYD’s auto<br />
business at HK$10.20 using DCF; its handset components and assembly business at<br />
HK$9.10 based on 18x 2013E P/E; and its battery business at HK$0.70 based on 12x<br />
2013E P/E. Major risks to our target price include uncertainties in EV technology<br />
breakthroughs and policies, as well as stronger-than-expected demand in low-end<br />
segment.<br />
08 January 2013<br />
BYD’s conventional vehicles<br />
sales remained weak mainly<br />
due to intensifying<br />
competition and lack of new<br />
models.<br />
<strong>China</strong>’s EV industry is still at<br />
its infancy stage. And BYD’s<br />
EV business will be<br />
constrained by the<br />
infrastructure issue<br />
BYD should face weak<br />
handset orders and margin<br />
pressure in the solar<br />
segment<br />
Initiate NEUTRAL on BYD<br />
with TP based on SoTP<br />
<strong>China</strong> <strong>Auto</strong> <strong>Sector</strong> 45
BYD Co Ltd 1211.HK / 1211 HK<br />
Price (04 Jan 13): HK$22.85, Rating:: NEUTRAL, Target Price: HK$20.00, Analyst: Jack Yeung<br />
Target price scenario<br />
Scenario TP %Up/Dwn Assumptions<br />
Upside 21.71 (4.99) 2013E auto sales: 533,000 units<br />
Central Case 20.00 (12.47) 2013E auto sales: 493,000 units<br />
Downside 17.05 (25.38) 2013E auto sales: 453,000 units<br />
Income statement (Rmb mn) 12/11A 12/12E 12/13E 12/14E<br />
Sales revenue 46,312 47,825 58,063 63,172<br />
Cost of goods sold 39,445 41,772 49,699 53,906<br />
SG&A 3,925 4,018 4,877 5,306<br />
Other operating exp./(inc.) (2,043) (2,799) (3,060) (3,373)<br />
EBITDA 4,984 4,834 6,546 7,333<br />
Depreciation & amortisation 2,516 3,535 4,111 4,552<br />
EBIT 2,469 1,299 2,434 2,781<br />
Net interest expense/(inc.) 742 900 1,272 1,488<br />
Non-operating inc./(exp.) — — — —<br />
Associates/JV 1.2 (12.6) — —<br />
Recurring PBT 1,727 387 1,163 1,293<br />
Exceptionals/extraordinaries — — — —<br />
Taxes 132.4 59.7 139.5 194.0<br />
Profit after tax 1,595 327 1,023 1,099<br />
Other after tax income — — — —<br />
Minority interests 210.5 154.7 307.0 329.8<br />
Preferred dividends — — — —<br />
Reported net profit 1,385 172 716 770<br />
Analyst adjustments — — — —<br />
Net profit (Credit Suisse) 1,385 172 716 770<br />
Cash flow (Rmb mn) 12/11A 12/12E 12/13E 12/14E<br />
EBIT 2,469 1,299 2,434 2,781<br />
Net interest (1,001) (843) (1,197) (1,375)<br />
Tax paid (344.0) (59.7) (139.5) (194.0)<br />
Working capital 1,179 (752) 335 505<br />
Other cash & non-cash items 2,626 3,478 4,037 4,439<br />
Operating cash flow 4,929 3,122 5,470 6,157<br />
Capex (7,245) (5,260) (4,730) (5,313)<br />
Free cash flow to the firm (2,316) (2,137) 740 844<br />
Disposals of fixed assets — — — —<br />
Acquisitions — — — —<br />
Divestments 580.9 — — —<br />
Associate investments 13.1 — — —<br />
Other investment/(outflows) (2,272) 1,130 (1,320) (1,320)<br />
Investing cash flow (8,923) (4,130) (6,050) (6,633)<br />
Equity raised 1,368 — — —<br />
Dividends paid (0.33) — — —<br />
Net borrowings 4,727 1,872 3,600 3,600<br />
Other financing cash flow (302.6) — — —<br />
Financing cash flow 5,792 1,872 3,600 3,600<br />
Total cash flow 1,798 865 3,020 3,124<br />
Adjustments (39.2) — — —<br />
Net change in cash 1,759 865 3,020 3,124<br />
Balance sheet (Rmb mn) 12/11A 12/12E 12/13E 12/14E<br />
Cash & cash equivalents 3,737 4,602 7,622 10,746<br />
Current receivables 9,782 10,053 11,237 12,393<br />
Inventories 6,596 7,899 8,026 8,144<br />
Other current assets 2,665 3,321 3,659 3,989<br />
Current assets 22,780 25,875 30,544 35,272<br />
Property, plant & equip. 30,723 32,000 32,619 33,380<br />
Investments 587.2 — — —<br />
Intangibles 2,481 3,809 5,129 6,449<br />
Other non-current assets 10,310 8,887 8,887 8,887<br />
Total assets 66,881 70,572 77,179 83,988<br />
Accounts payable 17,236 18,167 19,427 20,773<br />
Short-term debt 11,342 12,176 13,141 14,296<br />
Current provisions — — — —<br />
Other current liabilities 6,050 6,617 7,340 8,105<br />
Current liabilities 34,628 36,959 39,909 43,174<br />
Long-term debt 7,079 8,117 10,752 13,197<br />
Non-current provisions — — — —<br />
Other non-current liab. 1,194 1,175 1,175 1,175<br />
Total liabilities 42,901 46,251 51,836 57,546<br />
Shareholders' equity 21,125 21,310 22,026 22,796<br />
Minority interests 2,856 3,010 3,317 3,647<br />
Total liabilities & equity 66,881 70,572 77,179 83,988<br />
08 January 2013<br />
Key earnings drivers 12/11A 12/12E 12/13E 12/14E<br />
<strong>Auto</strong>mobile sales (unit) 448,484 428,638 493,246 538,185<br />
— — — —<br />
— — — —<br />
— — — —<br />
Per share data<br />
—<br />
12/11A<br />
—<br />
12/12E<br />
—<br />
12/13E<br />
—<br />
12/14E<br />
Shares (wtd avg.) (mn) 2,315 2,354 2,354 2,354<br />
EPS (Credit Suisse)<br />
0.60 0.07 0.30 0.33<br />
(Rmb) DPS (Rmb) — — — —<br />
BVPS (Rmb) 9.0 9.1 9.4 9.7<br />
Operating CFPS (Rmb) 2.13 1.33 2.32 2.62<br />
Key ratios and valuation 12/11A 12/12E 12/13E 12/14E<br />
Growth(%)<br />
Sales revenue (0.8) 3.3 21.4 8.8<br />
EBIT (27.4) (47.4) 87.4 14.2<br />
Net profit (45) (88) 316 7<br />
EPS (46) (88) 316 7<br />
Margins (%)<br />
EBITDA 10.8 10.1 11.3 11.6<br />
EBIT 5.33 2.72 4.19 4.40<br />
Pre-tax profit 3.73 0.81 2.00 2.05<br />
Net profit 2.99 0.36 1.23 1.22<br />
Valuation metrics (x)<br />
P/E 31 251 60 56<br />
P/B 2.05 2.03 1.96 1.90<br />
Dividend yield (%) — — — —<br />
P/CF 8.6 13.8 7.9 7.0<br />
EV/sales 1.31 1.29 1.07 0.99<br />
EV/EBITDA 12.1 12.7 9.5 8.5<br />
EV/EBIT 24.5 47.3 25.5 22.5<br />
ROE analysis (%)<br />
ROE 7.00 0.81 3.31 3.43<br />
ROIC 6.34 2.79 5.25 5.57<br />
Asset turnover (x) 0.69 0.68 0.75 0.75<br />
Interest burden (x) 0.70 0.30 0.48 0.47<br />
Tax burden (x) 0.92 0.85 0.88 0.85<br />
Financial leverage (x) 2.79 2.90 3.05 3.18<br />
Credit ratios<br />
Net debt/equity (%) 61.2 64.5 64.2 63.3<br />
Net debt/EBITDA (x) 2.95 3.25 2.49 2.28<br />
Interest cover (x) 3.33 1.44 1.91 1.87<br />
Source: Company data, Thomson Reuters, Credit Suisse estimates.<br />
0<br />
2008 2009 2010 2011 2012 2013<br />
<strong>China</strong> <strong>Auto</strong> <strong>Sector</strong> 46<br />
80<br />
70<br />
60<br />
50<br />
40<br />
30<br />
20<br />
10<br />
12MF P/E multiple<br />
12MF P/B multiple<br />
10<br />
9<br />
8<br />
7<br />
6<br />
5<br />
4<br />
3<br />
2<br />
1<br />
0<br />
2008 2009 2010 2011 2012 2013<br />
Source: IBES
Weak conventional vehicle sales<br />
Sedan sales remain weak<br />
BYD’s conventional vehicles (mainly sedans) primarily focus on the low-end segment<br />
(Figure 97 and Figure 98), where demand growth is slowing and competition is<br />
intensifying. BYD’s sedan sales slipped almost every month from August 2010 to July<br />
2012, mainly due to network consolidation and weakening demand in the low-end<br />
segment. BYD launched a new low-end sedan model Surui in August 2012, which has<br />
competitive prices and better quality than the old ones. Surui achieved strong sales in<br />
September and October 2012. BYD also extended its warranty on new vehicles to four<br />
years/100,000 km to boost sales. However, up until October 2012, BYD’s monthly sedan<br />
sales volume was still about 15% lower than in 2011 and more than 20% lower than its<br />
ordinary level in 2010. We also expect its sedan sales to remain weak in 2013 due to its<br />
lack of attractive models and intensifying competition in the low-end segment.<br />
Figure 97: Official prices of BYD models Figure 98: BYD auto product portfolio<br />
(RMB/unit)<br />
400,000<br />
350,000<br />
300,000<br />
250,000<br />
200,000<br />
150,000<br />
100,000<br />
50,000<br />
0<br />
Conventional vehicle<br />
Mid-to-high end vehicles<br />
Mid end vehicles<br />
E6 F3DM M6 F3 S6 L3 G6 G3 F6 Surui F0<br />
(EV) (Hybrid)<br />
EV and hybrid<br />
vehicle<br />
0.5%<br />
Jan-Nov 2012<br />
Low-end sedan<br />
79%<br />
Source: Company data, Credit Suisse estimates Source: Company data, Credit Suisse estimates<br />
Figure 99: Sedan sales comparison of major domestic automakers<br />
Sedan sales<br />
(unit)<br />
600,000<br />
500,000<br />
400,000<br />
300,000<br />
200,000<br />
100,000<br />
0<br />
2007 2008 2009 2010 2011 2012E<br />
BYD Geely Chery Great Wall Motor<br />
Source: CAAM, Credit Suisse estimates<br />
Sedan sales<br />
200%<br />
YoY<br />
08 January 2013<br />
Mid-to-high end<br />
MPV (M6)<br />
0.3%<br />
Mid-to-low end<br />
SUV (S6)<br />
20%<br />
<strong>China</strong> <strong>Auto</strong> <strong>Sector</strong> 47<br />
150%<br />
100%<br />
50%<br />
0%<br />
-50%<br />
BYD’s sedan sales would<br />
remain weak due to<br />
intensifying competition and<br />
lack of attractive models<br />
2008 2009 2010 2011 2012E<br />
BYD (LHS) Geely (LHS)<br />
Chery 9LHS) Great Wall Motor (RHS)<br />
800%<br />
700%<br />
600%<br />
500%<br />
400%<br />
300%<br />
200%<br />
100%<br />
0%<br />
-100%<br />
-200%
Bottleneck in SUV sales<br />
BYD is recalibrating its product strategy and introducing more upscale models, such as the<br />
SUV S6 and mid-sized sedan G6. More and more Chinese consumers are now replacing<br />
their first cars, who have tended and are tending to buy cars from JVs. This is a trend that<br />
has depressed the sales of domestic brands, such as BYD, Chery and Geely, which are<br />
traditional makers of low-end compact models. By introducing more upscale vehicles, such<br />
as the S6 and the G6, BYD is trying to retain those consumers. The S6 was BYD’s first<br />
SUV model, ranked the No.6 best-selling SUV in <strong>China</strong> in 10M12 and is mainly competing<br />
with Great Wall’s H6 and Geely’s GX7 (Figure 100, Figure 101 and Figure 102). BYD is<br />
targeting to sell 100,000 S6 units in 2012. However, we expect it to miss the target by<br />
about 15,000 units given weak sales in 2H12. Monthly sales of the H6 exceeded 10,000<br />
units in the 4th month after its launch and steadily picked up above that level from the<br />
tenth month (Figure 103). However, monthly sales of the S6 exceeded 10,000 units in the<br />
eighth month after its launch and fell below that from the 13th month (Figure 103). We<br />
believe that the S6’s monthly sales volume has been capped in 2012 mainly due to strong<br />
competition from the H6, whose sales and market share kept growing throughout the year<br />
(Figure 98).<br />
Figure 100: BYD S6<br />
Source: Company data<br />
Figure 101: Great Wall Motor H6<br />
Source: Company data<br />
Figure 102: Geely GX7<br />
Source: Company data<br />
Price Rmb89,900 – 136,900<br />
Size 4.81m x 1.855m x 1.68m<br />
Wheelbase 2.72m<br />
Engine and<br />
transmission<br />
2.0L – 103kW /6000rpm,<br />
186N*m/4000-4500rpm<br />
5-speed manual<br />
2.4L – 118kW /5000-6000rpm,<br />
215N*m/3500-4500rpm<br />
4-speed automatic<br />
Price Rmb95,800 – 141,800<br />
Size 4.64m x 1.825m x 1.69m<br />
Wheelbase 2.68m<br />
Engine and<br />
transmission<br />
08 January 2013<br />
2.0L – 98kW /5500rpm,<br />
186N*m/4000rpm<br />
4-speed automatic / 5-speed manual<br />
2.0T Diesel – 110kW/4000rpm,<br />
310N*m/1800-2800rpm<br />
6-speed automatic / manual<br />
Price Rmb92,900 – 129,900<br />
Size 4.541m x 1.833m x 1.7m<br />
Wheelbase 2.661m<br />
Engine and<br />
transmission<br />
We believe BYD’s S6 will<br />
have limited growth potential<br />
due to strong competition<br />
from H6<br />
1.8L – 102kW /6200rpm, 172N*m/4200rpm<br />
5-speed manual<br />
2.0L – 104kW/6000rpm, 178N*m/4000-<br />
4500rpm<br />
6-speed automatic / manual<br />
<strong>China</strong> <strong>Auto</strong> <strong>Sector</strong> 48
Figure 103: Sales ramp-up of S6, H6, and GX7<br />
Sales (unit)<br />
18,000<br />
16,000<br />
14,000<br />
12,000<br />
10,000<br />
8,000<br />
6,000<br />
4,000<br />
2,000<br />
-<br />
month after initial launch<br />
1st 2nd 3rd 4th 5th 6th 7th 8th 9th 10th 11th 12th 13th 14th 15th<br />
BYD S6 Great Wall Hover H6 Geely GX7<br />
Source: Company data, Credit Suisse estimates<br />
Sales (unit)<br />
18,000<br />
08 January 2013<br />
-<br />
Apr-11 Jul-11 Nov-11 Mar-12 Jul-12 Nov-12<br />
<strong>China</strong> <strong>Auto</strong> <strong>Sector</strong> 49<br />
16,000<br />
14,000<br />
12,000<br />
10,000<br />
8,000<br />
6,000<br />
4,000<br />
2,000<br />
BYD S6 Great Wall Hover H6 Geely GX7<br />
Figure 104: BYD’s vehicle models<br />
Segment Model Price (’000 Rmb) Launch time of new model 2012E sales (’000 units) 2013E sales (’000 units)<br />
Sedan F3 52.8 - 169.8 122.4 93<br />
Surui 65.9 - 99.9 35.7 111<br />
F6 89.8 - 109.8 0.8 0.8<br />
F0 36.9 - 46.9 41 44.3<br />
G3 62.9 - 109.9 28 31.2<br />
L3 59.8 - 118.8 70 73<br />
G6 79.8 - 115.8 40.5 42.6<br />
SUV S6 89.9 - 136.9 86.5<br />
Updated S6 2.0T 130 - 136.9 1H13<br />
MPV M6 150.8 - 239.8 1 1.1<br />
EV E6 369 - 369.8 1.4 3<br />
F3DM 149.8 - 169.8 1.2 2<br />
Qin 200 1Q13 1<br />
E-Bus K9 2,000 1 1.5<br />
Total 429 494<br />
Source: BYD, Credit Suisse estimates<br />
Figure 105: Launch time of BYD’s new models in 2013<br />
Jan Feb Mar Apr May Jun Jul Aug Sep Oct Nov Dec<br />
Updated S6 2.0T 1H13<br />
Qin 1Q13<br />
Source: BYD<br />
90
Figure 106: Official prices of BYD models<br />
F3<br />
Surui<br />
F6<br />
F0<br />
G3<br />
L3<br />
G6<br />
S6<br />
Updated S6 2.0T<br />
Source: BYD<br />
M6<br />
E6<br />
F3DM<br />
Qin<br />
08 January 2013<br />
- 50,000 100,000 150,000 200,000 250,000 300,000 350,000 400,000<br />
Existing model New model<br />
Figure 107: Comparison of BYD Surui and its major competitors<br />
Model<br />
BYD Surui Geely GLEagle GC7 Great Wall C30 Venucia D50<br />
1.5MT Comfort 1.5MT Comfort 1.5MT Comfort 1.6MT Comfort<br />
Official price (’000 Rmb) 65.9 62.9 64.5 67.8<br />
Dec-12 retail price ('000 Rmb) 62.9 53.9 60.5 63.8<br />
Size (m) 4.680/1.765/1.490 4.547/1.734/1.470 4.452/1.705/1.480 4.480/1.695/1.535<br />
Wheelbase (m) 2.66 2.6 2.61 2.6<br />
Trunk volume (Litre) 450 480 510 467<br />
Tank volume (Litre) 50 50 40 52<br />
Complete mass (kg) 1330 1270 1125 1115<br />
Engine size (L) 1.497 1.498 1.497 1.598<br />
Max power (kW/rpm) 80/5800 80/6000 78/6000 86/6000<br />
Max toque (n.m/rpm) 145/4800 140/4200-4600 138/4200 153/4400<br />
Acceleration 0-100 km/h (s) 9.5 12 12.7 11.2<br />
Transmission 5MT 5MT 5MT 5MT<br />
Fuel consumption (L/100km) 6.5 7.5 6.5 6.4<br />
Warranty 4 years or 100,000km 4 years or 150,000km 4 years or 150,000km 3 years or 100,000km<br />
Emission standard National IV National IV Euro IV National IV<br />
Source: Xcar, Channel checks with dealers<br />
<strong>China</strong> <strong>Auto</strong> <strong>Sector</strong> 50<br />
RMB
Figure 108: Comparison of BYD G6 and its major competitors<br />
Model<br />
08 January 2013<br />
BYD G6 Nissan Sylphy VW Bora Chevrolet Cruze<br />
1.5T MT Delux 1.6MT Comfort 1.6MT Fashion 1.6 SL MT 2013<br />
Official price (’000 Rmb) 93.8 99.8 107.8 108.9<br />
Dec-12 retail price (’000 Rmb) 88.8 94.8 91.8 90.9<br />
Size (m) 4.860/1.825/1.463 4.665/1.700/1.505 4.540/1.775/1.467 4.598/1.797/1.477<br />
Wheelbase (m) 2.745 2.7 2.61 2.685<br />
Trunk volume (Litre) 465 504 450 400<br />
Tank volume (Litre) 65 52 55 60<br />
Complete mass (kg) 1450 1180 1265 1360<br />
Engine size (L) 1.5 1.598 1.598 1.598<br />
Max power (kW/rpm) 113/5200 86/6000 77/5600 86/6000<br />
Max toque (n.m/rpm) 240/1750-3500 153/4400 155/3800 150/3800<br />
Acceleration 0-100 km/h (s) 9.7 11.8 11.8 12.6<br />
Transmission 6MT 5MT 5MT 5MT<br />
Fuel consumption (L/100km) 7 6.5 6.9 6.9<br />
Warranty 4 years or 100,000km 3 years or 100,000km 2 years or 60,000km 2 years or 60,000km<br />
Emission standard National IV Euro IV National IV National IV<br />
Source: Xcar, Channel checks with dealers<br />
Figure 109: Comparison of BYD E6 and its major competitors<br />
Model<br />
BYD E6 Nissan Leaf Ford Focus EV Honda Fit EV<br />
Official price (’000 Rmb) 369.8 224-256 250-280 233-250<br />
Size (m) 4.560/1.882/1.630 4.445/1.770/1.550 4.359/2.060/1.466 3.900/1.695/1.525<br />
Wheelbase (m) 2.83 2.69 2.649 2.5<br />
Trunk volume (Litre) 385 370 385 380<br />
Complete mass (kg) 2295 1521 1674 1070<br />
Battery (kWh) 48 (LiFePO4) 24 (Lith-ion) 23 (Lith-ion) 20 (Lith-ion)<br />
Max power (kW) 90 80 107 92<br />
Max toque (n.m) 450 280 250 256<br />
Acceleration 0-100 km/h (s)
EV business in its infancy stage<br />
EV: The future for the auto industry<br />
Economies become more dependent on transportation fuel as they mature. In economies<br />
such as the US, road transportation fuel makes up the largest part of oil consumption, and<br />
if replaced with electric vehicles (EV), could significantly cut oil demand and pollution.<br />
Countries such as <strong>China</strong>, require less of an infrastructure overhaul to switch fuel types,<br />
and want to seize the opportunity to stem a growing dependence on oil. Electricity has the<br />
highest distribution efficiency of any fuel, which is more than 80%. Recent advancements<br />
by BYD in electricity storage suggest that car batteries of the somewhat far-off future could<br />
be substantially more efficient compared to current ones. Despite sluggish global auto<br />
growth, along with the gloomy outlook in <strong>China</strong>, there is new hope within the industry and<br />
that is EV. Even though EV is still at the initial stages of development, we believe that it<br />
will be the ‘King of <strong>Auto</strong> Market’ not only in <strong>China</strong>, but also in the world.<br />
EV, in our view, will be the answer to the future of the auto industry. It generates zero<br />
greenhouse gas emissions compared with conventional vehicles and has lower fuel costs,<br />
even when oil is cheap. That is because electric engines are more efficient than internalcombustion<br />
engines, and because generating energy on a large scale (in coal or nuclear<br />
plants) is less wasteful than doing it on a small scale (by burning gasoline in an internalcombustion<br />
engine). Besides the energy saving concept, there are material benefits from<br />
using electric/hybrid cars. The concept is similar to the light bulb, with an energy-saving<br />
light bulb charging five times more than usual light bulbs, but also saving on energy with<br />
the initial investment cost being fully earned back by electricity saved from such a light<br />
bulb. Moreover, EVs are very reliable and have almost free maintenance. There is no<br />
need for oil and filter changes, and tuning. In addition, EVs have less than one tenth as<br />
many parts as a conventional vehicle. For instance, they have no engine, transmission,<br />
spark plugs, valves, fuel tank, tailpipe, distributor, starter, clutch, muffler or catalytic<br />
converter.<br />
One of the critical cost issues for an EV is the efficiency of the battery. BYD is using a<br />
lithium iron phosphate (LiFePO 4) battery. The strength of this is the short charge time, high<br />
power density while it does not explode under extreme conditions normally. In a serious<br />
accident on 25 May 2012 in Shenzhen, a BYD E6 Taxi caught fire and burned out after it<br />
was hit by a sports car travelling at high speed. Three people were killed at the scene.<br />
However, a panel of experts organized to study the accident later concluded that the<br />
batteries on the taxi did not explode and the design passes all required safety standards.<br />
Some 75% of the vehicle’s battery survived the fire and the other 25% had no structural<br />
damage. Also, the cost of an Li-iron battery is low, non-toxic and has readily available iron<br />
elements. Meanwhile, most consumer electronics are extensively using lithium cobalt<br />
oxide (LiCoO2), lithium manganese oxide (LiMn 2O 4) and lithium-nickel oxide (LiNiO 2). An<br />
Li-iron battery has relatively higher stability than the above material despite it having a<br />
lower capacity/size ratio. Thus, it should be more suitable for EV, as car space is sufficient<br />
than consumer electronics (especially portable devices).<br />
Is EV cost effective? Consider a driver in Shenzhen (BYD’s cars sell mostly in Shenzhen)<br />
who drives every day and must decide whether to buy an EV or conventional vehicle. If we<br />
don’t consider the environmental protection concept, let’s examine two cases: (1) buy a<br />
gasoline sedan; and (2) buy an E6 electric car. For family users, the E6 breaks even<br />
compared with BYD’s gasoline model F6 in terms of total cost at the end of their nine<br />
years of lifetime (Figure 110). We believe this breakeven point could decrease with<br />
technological improvements. In terms of per-km fuel costs, cheap electricity and minimal<br />
maintenance for re-charging batteries should bring down the fuel cost per km of the E6 to<br />
around 25% that of the F6 (Figure 111). The more often and longer the EV drives, the<br />
more it can save, making it more appealing to fleet operators than private users. Therefore,<br />
08 January 2013<br />
EV business has bright<br />
future but is still at the initial<br />
stages of development<br />
We believe EV will be a key<br />
growth area of the auto<br />
industry in the future<br />
BYD has advanced battery<br />
technology, which is critical<br />
to EV<br />
EV is cost effective<br />
compared with conventional<br />
vehicles<br />
<strong>China</strong> <strong>Auto</strong> <strong>Sector</strong> 52
fleet operators, such as taxi companies, are likely to reach breakeven within a short period<br />
and most likely to become BYD’s major customers.<br />
Figure 110: Cost comparison between E6 and F6 (for family usage)<br />
E6 (pure electric car) F6 (gasoline car)<br />
Average mileage per day 60km (30km x 2) 60km (30km x 2)<br />
Energy price Rmb7.56 (Rmb0.13 per km) per day<br />
-- assuming Rmb0.70 for 1kWh<br />
-- assuming 18kWh for 100km<br />
Total energy cost used in nine years Rmb24,000<br />
-- assume zero time value of money<br />
Car list price Rmb180,000<br />
-- after government subsidies of Rmb120,000<br />
-- assume no residual value<br />
Rmb33.60 (Rmb0.56 per km) per day<br />
-- assuming gasoline price at Rmb8.00/litre<br />
-- assuming 7 litres/100km<br />
Rmb110,000<br />
-- assume zero time value of money<br />
Rmb109,800<br />
-- assume no residual value<br />
08 January 2013<br />
Lifetime mileage Assume 200,000km (9 years and 60Km every day). Assume 200,000km (nine years and 60km every<br />
Battery to charge 4,000 times before retirement<br />
300km per charge. Maximum mileage: 3,000 times x<br />
300km = 900,000km.<br />
day).<br />
Maintenance cost Unknown, but may get government subsidy Assume no cost<br />
Total cost Rmb204,000 Rmb219,800<br />
Source: BYD, Credit Suisse estimates<br />
Figure 111: Cost comparison between E6 taxi and gasoline taxi (for fleet operator)<br />
E6 Taxi (pure electric car) Gasoline taxi<br />
Average mileage per day 450km 450km<br />
Energy price Rmb81.90 (Rmb0.18 per km) per day<br />
-- assuming Rmb0.70 for 1kWh<br />
-- assuming 26kWh for 100km<br />
Total energy cost used in 5 years Rmb149,500<br />
-- assume zero time value of money<br />
Car list price Rmb180,000<br />
-- after government subsidies of Rmb120,000<br />
-- assume no residual value<br />
Rmb324.00 (Rmb0.72 per km) per day<br />
-- assuming gasoline price at Rmb8.00 / litre<br />
-- assuming 9 litre / 100km<br />
Rmb591,300<br />
-- assume zero time value of money<br />
Rmb100,000<br />
-- assume no residual value<br />
Lifetime mileage Assume 730,000km (5 years and everyday 400km). Assume 730,000km (5 years and everyday 400km).<br />
Battery to charge 4000 times before retirement<br />
300km per charge. Maximum mileage: 3,000 times x<br />
300km = 900,000km<br />
Maintenance cost Unknown, but may get government subsidy Assume no cost<br />
Total cost Rmb329,500 Rmb691,300<br />
Source: BYD, Credit Suisse estimates<br />
Figure 112: Cost comparison between E6 and F6<br />
RMB<br />
250,000<br />
200,000<br />
150,000<br />
100,000<br />
50,000<br />
0<br />
Family user<br />
number of years after purchase<br />
1st 2nd 3rd 4th 5th 6th 7th 8th 9th<br />
E6 F6<br />
Source: Company data, Credit Suisse estimates<br />
<strong>China</strong> <strong>Auto</strong> <strong>Sector</strong> 53<br />
RMB<br />
1,500,000<br />
1,200,000<br />
900,000<br />
600,000<br />
300,000<br />
0<br />
Fleet operator<br />
number of years after purchase<br />
1st 2nd 3rd 4th 5th 6th 7th 8th 9th<br />
E6 F6
BYD is the closest proxy to EV in Asia<br />
BYD is the only auto manufacturer in Asia (ex-Japan) to provide a one-stop solution in the<br />
EV market with commercial trials of electric taxis for more than two years in Shenzhen. If<br />
its EV dream comes true, the EV market would be kicked off globally, and BYD would be a<br />
good choice and may enjoy a scarcity premium. The reason that no other major players<br />
exist may be due to the high risk of this technology. Also, these traditional car makers<br />
usually are not equipped with battery knowledge, the learning curve is long and investment<br />
is huge for developing battery technology from scratch. Sanyo and Samsung SDI are the<br />
global leaders in lithium batteries, while Toyota and General Motors are the leaders in<br />
hybrid cars. Huge investment has been poured into hybrid car R&D, but we have yet to<br />
see any returns. However, we do not think these companies are really so investable<br />
because they are conglomerates and EV earnings would have little impact on their bottom<br />
line. Meanwhile, in Asia Pacific, BYD would be the closest proxy to the success of an<br />
electric vehicle. Although many large companies in the world are developing electric autos,<br />
BYD is the only one focusing on this area in <strong>China</strong>.<br />
Eyeing such great potential, automakers are racing to grab a share. Shanghai-based SAIC<br />
Motor Corp last week launched its first mass-produced all-electric car, the Roewe E50.<br />
BYD's joint venture with Daimler AG has launched the EV brand Denza, which is jointly<br />
designed by 80 German engineers from Daimler and 200 BYD engineers. A prototype<br />
vehicle of Denza is under road testing and the final version will be launched in the market<br />
around end-2013. BYD is planning to deliver 2,000 EVs in 2012 and 7,000 in 2013.<br />
According to foreign media reports, US electric vehicle company Tesla is also preparing to<br />
enter the Chinese market, first with a showroom planned in Beijing. However, among<br />
them, only BYD has the capability of mass-production. Currently, its Li-iron battery<br />
capacity is 1.6 GWh, which is able to support 500 K9s and over tens of thousands of E6s.<br />
It does not plan to expand its battery capacity yet. Average production costs for Li-iron<br />
battery are about Rmb2-2.5/Wh, which may be reduced to Rmb1.5-2/Wh in 2013.<br />
EV is still far from full commercialization<br />
Major technical efforts in the auto industry are still concentrating on improving the current<br />
combustion engine technology, powertrain systems, connected drives, safety systems and<br />
the development of new material solutions for vehicle weight reduction. One of the<br />
greatest challenges to commercializing EV is likely to be the development and<br />
industrialization of light, long-lasting and affordable battery systems. A market<br />
breakthrough of EVs would depend greatly on innovations in this field. We expect the<br />
corresponding development phase to last 5-10 years.<br />
The battery functions are crucial in an EV just as the combustion engine is in a<br />
conventional vehicle. The total value added of an EV is significantly higher than for<br />
conventional vehicles and is clearly dominated by the battery system. As the battery<br />
system is currently very cost intensive, the EV industry needs unified standards for its<br />
technology, components, as well as electrical interfaces, to avoid high switching costs.<br />
However, <strong>China</strong>’s EV battery industry is still highly fragmented. Sufficient and<br />
standardized electric charging infrastructure is another key challenge to commercializing<br />
EVs. Infrastructure is the foundation of a unified EV market, especially in a large country,<br />
such as <strong>China</strong>. A well-established charging network not only provides a convenient<br />
charging solution, but also helps avoid a multiplicity of standards, which would hamper the<br />
development of the EV industry. Other than dedicated high-power charging stations on<br />
public roads, charging poles have lower construction and maintenance costs, providing<br />
more convenient refueling solutions than patrol stations. Battery swap stations and power<br />
storage stations are also good complements to shorten charging times. These charging<br />
facilities are already in place in <strong>China</strong>, but with limited locations and capabilities. At the<br />
end of 2011, there were 314 charging stations built in <strong>China</strong> with 16,184 charging poles,<br />
shared by around 10,000 EVs across the country (Figure 113). This compares with over<br />
08 January 2013<br />
BYD is the automaker in<br />
Asia (ex-Japan) with the<br />
closest proxy to EV<br />
BYD is the only Chinese<br />
automaker with mass<br />
production of EVs<br />
We expect major market<br />
breakthrough of EVs in 5-10<br />
years<br />
Due to constraints in battery<br />
technology and<br />
infrastructure support, EV is<br />
far from commercialising in<br />
<strong>China</strong><br />
<strong>China</strong> <strong>Auto</strong> <strong>Sector</strong> 54
3,400 charging stations and over 20,000 charging poles in the US at the end of 2011,<br />
which were shared by fewer than 25,000 EVs.<br />
Figure 113: Expansion of EV charging facilities in <strong>China</strong><br />
2500<br />
2000<br />
1500<br />
1000<br />
500<br />
0<br />
550<br />
907<br />
08 January 2013<br />
<strong>China</strong> <strong>Auto</strong> <strong>Sector</strong> 55<br />
1,405<br />
2,108<br />
196,538<br />
314<br />
89,336<br />
160<br />
38,842<br />
16184<br />
2010<br />
6432<br />
2011 2012E 2013E 2014E 2015E<br />
Number of charging station (LHS) Number of charging pole (RHS)<br />
Source: State Grid Corporation, <strong>China</strong> Southern Power Grid, Credit Suisse estimates<br />
Policy supports for EV in <strong>China</strong><br />
450,000<br />
412,731<br />
400,000<br />
350,000<br />
300,000<br />
250,000<br />
200,000<br />
150,000<br />
100,000<br />
50,000<br />
For electric vehicles to make serious headway, they need much faster reductions in<br />
technology costs or continuing government subsidies. The latter looks unlikely to be<br />
sustainable in the long term, but is critical for the industry’s development at its infancy<br />
stage. <strong>China</strong> has 25 pilot cities for new energy vehicles, with five (Shenzhen, Shanghai,<br />
Hangzhou, Hefei and Changchun) offering purchase subsidies for new energy vehicle<br />
buyers (Figure 114 and Figure 115) .<br />
Figure 114: Pilot cities for new energy vehicles<br />
Launch<br />
Batch Time City<br />
1 st 13 cities Jan-09 Beijing, Shanghai, Chongqing, Changchun, Dalian, Hangzhou, Jinnan, Wuhan, Shenzhen, Hefei, Changsha,<br />
Kunming, Nanchang<br />
2 nd 7 cities Apr-10 Tianjin, Haikou, Zhengzhou, Xiamen, Suzhou, Tangshan, Guangzhou<br />
3 rd 5 cities Jul-10 Shenyang, Hohhot, Chengdu, Nantong, Xiangyang<br />
Source: MST, NDR, MIIT, and MOF<br />
Figure 115: Purchase subsidies granted to new energy vehicle buyers<br />
Energy type PV and light CV City buses longer than 10m<br />
Hybrid Not more than Rmb50,000 Rmb50,000-420,000<br />
Pure-electric Rmb60,000 Rmb500,000<br />
Fuel cell Rmb250,000 Rmb600,000<br />
Source: Company data<br />
Figure 116: Purchase subsidy for new energy vehicles in five pilot cities<br />
Rmb Unit Target<br />
3,000 one-time/ per unit Vehicles with engine sizes below 1.6L and fuel consumption 20% lower than the current industrial standard<br />
3,000 per kWh Hybrid electric passenger cars with total subsidy per car capped at Rmb50,000<br />
3,000 per kWh Pure electric passenger cars with total subsidy per car capped at Rmb60,000<br />
Source: Company data<br />
Other than subsidies, the Chinese government has issued several industry plans to call for<br />
more new energy vehicles. The ‘Twelfth Five-year Planning for Electric Vehicle<br />
Technology Development’ was issued by the Ministry of Science and Technology in March<br />
0<br />
Major policies supporting<br />
EVs in <strong>China</strong><br />
Industry plans for new<br />
energy vehicles in <strong>China</strong>
2012. It targets 2,000 EV charging stations (including battery swap stations) and 400,000<br />
electric charging poles in over 20 pilot cities by 2015E, which are expected to be sufficient<br />
to foster initial commercialization of EVs. Another industry plan, the ‘Energy Saving and<br />
New Energy Vehicle Development Plan’, was released in July 2012 by the State Council. It<br />
set a 2020E target for total production and sales of 5 mn pure-electric vehicles and plug-in<br />
hybrids, with annual production capacity reaching 2 mn units.<br />
Banks are also giving financial support to BYD to encourage its EV sales. <strong>China</strong><br />
Development Bank (non-listed), <strong>China</strong> Everbright Bank (non-listed) and other Chinese<br />
financial institutors launched a financial program with BYD in early November. This will<br />
provide loans with zero down payment for companies that buy BYD’s K9 E-buses and E6<br />
taxis. Currently, the E6 is selling at above Rmb300,000, while K9 sells at about Rmb2 mn.<br />
Even with subsidies from both central and local governments, the prices are still much<br />
higher than for conventional vehicles. Only fleet operators, such as taxi companies and<br />
bus companies, are willing to purchase EVs given their high daily mileage and therefore<br />
high savings benefits from low operating expenses of EVs. There are now 300 E6 taxis<br />
and 200 K9 E-buses running on the roads in Shenzhen. More than 500 E6s will be added<br />
to the fleet by the end of 2012, according to an agreement between BYD and a local taxi<br />
company.<br />
BYD also agreed with partners to produce its EVs in Tianjin and Yunnan province, and<br />
supply them for local public transport use. This is expected to help BYD gain local<br />
government support and penetrate local EV markets. The company is taking the same<br />
approach overseas, tapping public transport markets first. It has already provided electric<br />
buses to Denmark, the Netherlands, Spain and Hungry for trial use. It will attend two<br />
government-oriented auctions in Brussels (around hundreds of vehicles) and Italy (100<br />
vehicles) in 2013. Most recently, it agreed with a London cab company to supply 50 E6<br />
cars to its fleet in 2013. We expect BYD’s EV sales to heavily rely on government orders<br />
focusing on the public transportation sector in next few years and government subsidies<br />
would continue to account for a large portion of its EV revenue.<br />
08 January 2013<br />
Banks’ supports for BYD’s<br />
EV sales<br />
BYD is relying heavily on<br />
government purchases<br />
<strong>China</strong> <strong>Auto</strong> <strong>Sector</strong> 56
Uncertainties in handset and solar<br />
Weak orders from Nokia and HTC<br />
BYD’s profit from handset components and assembly may fall over 90% YoY in 2012 as<br />
its major customers Nokia and HTC have continued to suffer declines in market share<br />
(Figure 117 and Figure 118). BYD’s revenue from handset components and assembly fell<br />
11.6% YoY in 1H12, while rechargeable battery sales dropped 5.5% YoY during the same<br />
period. Its largest customer, Nokia, continued its restructuring plans and its total mobile<br />
phone shipments fell 17.8% from 303.5 mn units in 9M11 to 249.3 mn units in 9M12.<br />
HTC’s smartphone shipments dropped 30.9% YoY from 33.3 mn units in 9M11 to 23 mn in<br />
9M12. Given the strong competition in the mobile phone and smart phone segments, it<br />
would be unlikely for these two companies to quickly achieve a dramatic rebound in<br />
market share. This is likely to impact BYD’s orders for handset components and<br />
rechargeable batteries in 2H12 and in 2013.<br />
Figure 117: Market share of top mobile phone makers<br />
%<br />
50<br />
45<br />
40<br />
35<br />
30<br />
25<br />
20<br />
15<br />
10<br />
5<br />
0<br />
Source: IDC<br />
1Q10 2Q10 3Q10 4Q10 1Q11 2Q11 3Q11 4Q11 1Q12 2Q12 3Q12<br />
Samsung Nokia Apple ZTE LG Others<br />
Figure 118: Market share of top smart phone makers<br />
%<br />
45<br />
40<br />
35<br />
30<br />
25<br />
20<br />
15<br />
10<br />
5<br />
0<br />
Source: IDC<br />
1Q10 2Q10 3Q10 4Q10 1Q11 2Q11 3Q11 4Q11 1Q12 2Q12 3Q12<br />
Samsung Apple Nokia RIM HTC<br />
08 January 2013<br />
BYD’s handset segment<br />
would have weak orders as<br />
major customers face<br />
declining market share<br />
<strong>China</strong> <strong>Auto</strong> <strong>Sector</strong> 57
Solar: Oversupply remains a key challenge<br />
BYD’s solar segment recorded about Rmb600 mn of losses in 1H12, higher than the<br />
segment’s total loss of Rmb560 mn in 2011. This is mainly due to declining solar prices<br />
caused by oversupply in the industry. BYD is expecting another Rmb200 mn of losses in<br />
2H12. According to solarbuzz, global solar capacity is approximately twice that of its<br />
expected 2012 demand of 30GW. Although many foreign manufacturers have exited from<br />
solar manufacturing, Chinese capacity has continued to expand in recent years. These<br />
new facilities were added during 2011 and 2012, fuelling solar capacity increases and<br />
prolonging the oversupply and competitive pricing issues.<br />
The ASPs of solar panels are still falling. Gross margins for solar panels have fallen to less<br />
than 10% from above 30% in 2010, and Chinese companies will need to shift to a highvolume,<br />
low-margin business if they want to survive. Despite efforts by some companies to<br />
reorganize and cut costs, <strong>China</strong>'s solar sector might experience a wave of mergers,<br />
restructurings and company failures in the years ahead. Trina Solar Chief Executive Gao<br />
Jifan said the global solar industry may experience a stabilization phase in the next few<br />
years, which would be characterized by increasing consolidation and the liquidation of<br />
lower-tier manufacturers. Although attention has previously focused on the shakeout of<br />
European and US-based solar manufacturers, the next set of exits from the industry are<br />
likely to come from underperforming Chinese Tier 2 and 3 manufacturers, such as BYD.<br />
Figure 119: Chinese solar module suppliers’ revenue,<br />
gross margin and net margin<br />
3.5<br />
2.5<br />
1.5<br />
USD billion<br />
3<br />
2<br />
1<br />
1Q10 2Q10 3Q10 4Q10 1Q11 2Q11 3Q11 4Q11 1Q12 2Q12<br />
Revenue (LHS) Gross margin (RHS) Net margin (RHS)<br />
40.0%<br />
20.0%<br />
0.0%<br />
-20.0%<br />
-40.0%<br />
-60.0%<br />
-80.0%<br />
Figure 120: Global solar supply and demand<br />
08 January 2013<br />
<strong>China</strong> <strong>Auto</strong> <strong>Sector</strong> 58<br />
GW<br />
12<br />
Source: IMS Research Source: NPD Solarbuzz<br />
10<br />
8<br />
6<br />
4<br />
2<br />
0<br />
1Q11 2Q11 3Q11 4Q11 1Q12 2Q12 3Q12 4Q12 1Q13 2Q13 3Q13<br />
Production Shipments Demand<br />
Overcapacity in the solar<br />
industry will continue to put<br />
high pressure on BYD’s<br />
margins<br />
Solar industry may<br />
experience a wave of<br />
consolidation, which will<br />
seriously impact small<br />
players such BYD
Initiate with a NEUTRAL<br />
We initiate coverage on BYD with a NEUTRAL rating. We derive BYD’s target price of<br />
HK$20.00 based on SoTP. We value its auto business at HK$10.20 by using DCF; its<br />
handset components and assembly business at HK$9.10 based on 18x 2013E P/E; and its<br />
battery business at HK$0.70 based on 12x 2013E P/E.<br />
08 January 2013<br />
Figure 121: DCF—base case assumptions<br />
Base case 2012E 2013E 2014E 2015E 2016E 2017E 2018E 2019E 2020E<br />
Vehicle sales (’000 units)<br />
- Conventional 425 485 525 560 600 640 680 700 720<br />
- Hybrid 1.2 2 4 7 10 15 20 25 30<br />
- Electric car 1.3 3 6 10 15 20 25 30 35<br />
- Electric Bus 1.0 1.5 2.5 5 7 10 15 20 25<br />
Total vehicle sales 429 492 538 582 632 685 740 775 810<br />
Total vehicle salesYoY (%) -4% 15% 9% 8% 9% 8% 8% 5% 5%<br />
ASP (‘000 Rmb)<br />
- Conventional 54 55 59 58 57 56 55 54 53<br />
- Hybrid 135 135 130 130 120 110 100 90 80<br />
- Electric car 330 300 280 260 240 220 200 180 160<br />
- Electric Bus 1,530 1,530 1,530 1,400 1,400 1,300 1,200 1,100 1,000<br />
Total revenue (Rmb mn) 25,071 30,140 37,000 42,990 48,800 54,890 62,400 67,450 71,160<br />
EBITDA margin (%) 10.1% 11.3% 11.5% 11.3% 11.1% 10.9% 10.7% 10.5% 10.3%<br />
EBITDA (Rmb m) 2,534 3,398 4,269 4,858 5,417 5,983 6,677 7,082 7,329<br />
Working capital (Rmb mn) 6,518 7,836 9,620 11,177 12,688 14,271 16,224 17,537 18,502<br />
Working capital movement (Rmb mn) (522) (1,318) (1,784) (1,557) (1,511) (1,583) (1,953) (1,313) (965)<br />
Taxation (Rmb m) (391) (408) (640) (826) (1,083) (1,316) (1,669) (1,771) (1,832)<br />
Effective tax rate (%) 15% 12% 15% 17% 20% 22% 25% 25% 25%<br />
EV utilisation rate 29% 43% 60% 80% 80% 80% 80% 80% 80%<br />
EV capacity (‘000 units) 12 15 21 28 40 56 75 94 113<br />
Capex per EV (‘000 Rmb) 40 40 40 35 35 35 30 30 30<br />
Conventional vehicle utilisation rate 49% 56% 60% 63% 67% 70% 72% 73% 73%<br />
Conventional vehicle capacity (‘000 units) 860 870 880 890 900 920 940 960 980<br />
Capex per conventional vehicle (‘000 Rmb) 25 25 25 25 25 25 30 30 30<br />
Total capex (Rmb mn) (330) (370) (483) (483) (688) (1,069) (1,163) (1,163) (1,163)<br />
Free cash flow (Rmb mn) 1,291 1,302 1,362 1,991 2,135 2,015 1,893 2,836 3,370<br />
Discount factor 1.00 1.00 1.08 1.17 1.27 1.37 1.49 1.61 1.74 1.89<br />
Present value (Rmb mn) 1,291 1,204 1,164 1,573 1,559 1,360 1,181 1,636 31,485<br />
Terminal value (Rmb mn) 55,667<br />
Rmb mn<br />
Enterprise value (end-2012) 42,453<br />
- Net debt 15,500<br />
- Minority interests 155<br />
= Equity value 26,798<br />
Source: Credit Suisse estimates<br />
Initiate with NEUTRAL and<br />
TP based on SoTP<br />
<strong>China</strong> <strong>Auto</strong> <strong>Sector</strong> 59
Figure 122: WACC assumption and pricing<br />
Base case<br />
WACC assumptions<br />
Beta 1.00<br />
Risk free rate (Rf) 3.00%<br />
Risk premium (Rp) 6.50%<br />
Required market return (Rm=Rf+Rp) 9.50%<br />
Cost of equity=Rf+Beta*(Rm-Rf) 9.5%<br />
Cost of debt (2012) 6.5%<br />
Tax rate 25.0%<br />
No of shares (mn) 2,354<br />
Optimal leverage 20.0%<br />
WACC=CoE*(1-L)+CoD*(1-T)*L= 8.6%<br />
Perpetual growth 2.0%<br />
Pricing<br />
TP for <strong>Auto</strong> Project 10.2<br />
Exchange rate (HKD=RMB) 0.806<br />
Source: Company data, Credit Suisse estimates<br />
The base case of our valuation is mainly supported by the following assumptions:<br />
■ BYD could ship 2.3k EVs in 2012 to 70k EVs in 2020 (CAGR 53%).<br />
■ ASP for electric car to decline to Rmb160k in 2020 from Rmb330k in 2012.<br />
■ ASP for E-Bus to decline to Rmb1 mn in 2020 from Rmb1.5 mn in 2012.<br />
■ Favourite tax policy would terminate in 2018.<br />
■ EV’s capacity utilisation rate could rise to 80% in 2015.<br />
■ Conventional vehicles’ capacity utilisation rate could exceed 70% in 2017.<br />
■ Capex per EV would gradually decline due to technology advances. We expect capex<br />
per EV to drop to about Rmb30k in 2018, similar to capex for conventional vehicles.<br />
■ Risk premium 6.5%, cost of equity 9.5%, cost of debt 6.5%, tax rate 25%, perpetual<br />
growth 2%.<br />
Valuation comparison: Handset and battery makers<br />
08 January 2013<br />
Figure 123: Valuation comparison of major handset makers<br />
Share Market Dividend<br />
Price Cap P/E (x) P/B (x) yield (%) ROE (%)<br />
Company Ticker (local ccy) (USD m) 11 12E 13E 14E 11 12E 13E 14E 11 12E 13E 14E 11 12E 13E 14E<br />
Alcatel-Lucent ALUA.PA 1.20 3,626 2.5 (8.2) (24.4) 24.4 0.8 0.8 0.8 0.9 0.0 0.0 0.0 0.0 32.5 (9.4) (3.4) 3.7<br />
ZTE Corp 0763.HK 13.72 5,499 22.5 108.0 24.1 18.1 1.9 1.9 1.8 1.7 1.5 0.5 1.1 1.4 8.6 1.8 7.5 9.2<br />
Research in Motion RIMM.OQ 11.47 6,012 5.2 (9.7) (23.9) (26.6) 0.6 0.7 0.7 0.6 0.0 0.0 0.0 0.0 12.5 (6.8) (2.8) (2.4)<br />
Plantronics Inc PLT.N 37.32 1,593 15.0 13.9 12.9 11.5 2.8 2.6 2.3 n.a. 0.5 1.1 1.3 na 18.5 18.5 18.1 na<br />
HTC Corp 2498.TW 287.00 8,428 3.9 14.0 16.9 16.4 3.0 2.8 2.7 2.5 13.9 7.9 3.2 3.0 77.0 19.7 15.7 15.2<br />
Vtech Holdings Ltd 0303.HK 86.75 2,802 112.7 107.4 99.1 93.3 43.1 38.4 37.3 36.1 0.9 0.9 0.9 1.0 38.3 35.7 37.6 38.7<br />
Mkt cap–wtd avg 19.2 33.9 12.2 15.9 6.0 5.4 5.3 5.0 4.6 2.6 1.3 1.3 36.7 8.2 10.0 10.2<br />
Source: Bloomberg consensus<br />
Figure 124: Valuation comparison of major battery makers<br />
Share price Market cap P/E (x) P/B (x) Dividend yield (%) ROE (%)<br />
Company Ticker (local ccy) (US$ mn) 11 12E 13E 14E 11 12E 13E 14E 11 12E 13E 14E 11 12E 13E 14E<br />
Camel Croup Co Ltd 601311.SS 8.50 1,146 20.5 15.5 13.0 11.0 2.6 1.1 1.0 0.8 2.4 12.8 7.3 7.4 7.5<br />
Shenzhen Desay Battery 000049.SZ 30.20 663 34.6 28.0 21.3 15.4 13.5 9.2 6.7 4.9 0.8 39.0 33.0 31.5 31.9<br />
Eve Energy Co Ltd 300014.SZ 11.29 359 26.3 22.7 16.8 12.3 3.2 3.1 2.7 2.3 0.9 12.3 13.6 15.8 18.4<br />
Sunwoda Electronic 300207.SZ 12.20 478 33.0 31.5 20.9 14.8 2.6 2.4 2.2 2.0 0.6 7.7 7.7 10.6 13.3<br />
Zhejiang Narada 300068.SZ 13.14 627 54.8 25.5 19.8 14.9 1.5 1.4 1.4 1.3 0.8 2.7 5.6 6.8 8.4<br />
Mkt cap–wtd avg 32.4 23.1 17.5 13.3 4.7 3.2 2.6 2.1 1.3 15.4 12.9 13.6 14.6<br />
Source: Bloomberg consensus<br />
<strong>China</strong> <strong>Auto</strong> <strong>Sector</strong> 60
Risks to our investment case<br />
Technology challenges and policy risks for EVs<br />
A big problem for EVs is that they are expensive to make, and the single largest cost is the<br />
battery. Manufacturing a safe, reliable, long-lasting, and fast-charging battery for a car is a<br />
complex and costly undertaking. BYD claims to have achieved a breakthrough with its<br />
lithium iron ferrous phosphate technology, but no one can be sure whether it will work as<br />
promised. The recent accident of BYD’s E6 taxi in Shenzhen raised the public’s concerns<br />
on the safety of the EV and BYD’s batteries. Moreover, its ability to produce EVs at scale<br />
and at a low cost remains unproven. It would take the company a long time to persuade<br />
people that it is selling a reliable, durable, and quality automobile. Moreover, government<br />
purchases and fleet purchases subsidised by the government are still the two major sales<br />
drivers for BYD’s E6 and K9. We believe the EV industry is still at infancy stage, and<br />
changes in government policies would have a significant effect on EV makers such as<br />
BYD. If the government cuts its planned EV purchases or reduces subsidies to EV<br />
purchases, BYD’s EV sales will be seriously hurt.<br />
Stronger-than-expected demand in low-end segment<br />
Almost three-fourths of BYD’s conventional vehicle sales are from models priced below<br />
Rmb100,000 (Figure 125). Its current low-cost brand image seems not to be strong<br />
enough to support a mid-end model priced above Rmb150,000. For example, BYD’s only<br />
MPV model M6 is its first conventional model priced above Rmb150,000. M6 started<br />
delivery in January 2012 and is offering 5-7% of price cuts (Figure 127). However, its<br />
monthly sales never exceed 140 units (Figure 126). If low-end demand grows stronger<br />
than expectation, it is likely that BYD’s revenue and profits from the conventional auto<br />
business would also improve.<br />
Figure 125: Sales contribution of BYD’s conventional<br />
vehicles by prices<br />
RMB100,000-<br />
150,000<br />
25%<br />
2012E<br />
RMB150,000<br />
0.3%<br />
Figure 126: Sales of BYD’s M6<br />
Source: BYD, Credit Suisse estimates Source: BYD, CAAM<br />
08 January 2013<br />
<strong>China</strong> <strong>Auto</strong> <strong>Sector</strong> 61<br />
140<br />
120<br />
100<br />
80<br />
60<br />
40<br />
20<br />
-<br />
Unit<br />
Jan-12 Mar-12 May-12 Jul-12 Sep-12 Nov-12<br />
Figure 127: Retail prices of BYD M6<br />
Official price Oct 2012 retail Price Nov 2012 retail Price Dec 2012 retail Price<br />
Model (’000 Rmb) price (’000 Rmb) cut (%) price (’000 Rmb) cut (%) price (’000 Rmb) cut (%)<br />
M6 2.0L MT Delux 2011 150.8 145.8 3 140.8 7 135.8 10<br />
M6 2.0L MT Glory 2011 170.8 165.8 3 160.8 6 155.8 9<br />
M6 2.4L AT Delux 2011 178.8 173.8 3 168.8 6 163.8 8<br />
M6 2.4L AT Glory 2011 198.8 193.8 3 188.8 5 183.8 8<br />
M6 2.4L AT Flagship 2011 239.8 234.8 2 224.8 6 224.8 6<br />
Source: Channel checks with dealers<br />
Technology challenges and<br />
policy risks are major factors<br />
affecting EVs’ development<br />
Strong-than-expected lowend<br />
demand may benefit<br />
BYD given its intensive<br />
exposure to this segment
Rating UNDERPERFORM* [V]<br />
Price (04 Jan 13, HK$) 4.08<br />
Target price (HK$) 3.50¹<br />
Upside/downside (%) -14.2<br />
Mkt cap (HK$ mn) 33,700 (US$ 4,348)<br />
Enterprise value (Rmb mn) 28,247<br />
Number of shares (mn) 8,259.85<br />
Free float (%) 48.9<br />
52-week price range 4.08 - 1.79<br />
ADTO - 6M (US$ mn) 21.8<br />
*Stock ratings are relative to the coverage universe in each<br />
analyst's or each team's respective sector.<br />
¹Target price is for 12 months.<br />
[V] = Stock considered volatile (see Disclosure Appendix).<br />
Share price performance<br />
6<br />
4<br />
2<br />
Research Analysts<br />
Jack Yeung<br />
852 2101 6779<br />
jack.yeung@credit-suisse.com<br />
Price (LHS) Rebased Rel (RHS)<br />
0<br />
Jan-11 May-11 Sep-11 Jan-12 May-12 Sep-12<br />
The price relative chart measures performance against the<br />
MSCI CHINA F IDX which closed at 6652.07 on 04/01/13<br />
On 04/01/13 the spot exchange rate was HK$7.75/US$1<br />
140<br />
Performance over 1M 3M 12M<br />
Absolute (%) 10.6 32.9 134.5<br />
Relative (%) 3.2 16.1 111.6<br />
90<br />
40<br />
08 January 2013<br />
Asia Pacific / <strong>China</strong><br />
Geely <strong>Auto</strong>mobile Holdings Ltd<br />
(0175.HK / 175 HK)<br />
Struggling to climb up<br />
■ Initiate with an UNDERPERFORM. We initiate coverage on Geely with an<br />
UNDERPERFORM rating and a target price of HK$3.50, which implies<br />
14.2% potential downside. Geely is <strong>China</strong>’s largest domestic sedan maker. It<br />
is also <strong>China</strong>’s second-largest auto exporter just after Chery.<br />
■ Rebranding remains difficult. Geely is trying to move its coverage upwards<br />
to the mid-end segment from low-end under its new brands Emgrand and<br />
GLEagle. However, a proliferation of brands could confuse consumers and is<br />
likely to require significant additional marketing spending. We expect this<br />
multi-brand strategy to hardly change consumers’ perceptions of Geely. We<br />
believe Geely will continue to face direct competition from JVs’ self-owned<br />
brands, which are selling at similar prices as its Emgrand and GLEagle<br />
brands. Moreover, many JVs’ low- to mid-end sedan models have<br />
experienced massive prices cuts since 2Q12 and are selling below<br />
Rmb100,000, exerting high pressure on low-end automakers such as Geely.<br />
■ Key challenge: localisation of Volvo. With the takeover of Volvo, Geely<br />
hopes to crack <strong>China</strong>'s fast-growing luxury car market. But a made-in-<strong>China</strong><br />
Volvo might not be very popular. Geely will likely face a tough challenge in<br />
the future to convince brand-conscious Chinese consumers to buy a homegrown<br />
Volvo. Its future strategy for Volvo is to build plants for Volvo cars<br />
tailored for Chinese consumers. Volvo cars are known for high safety<br />
standards, while Geely cars are not that safe. Despite quality improvements<br />
in recent years, Geely’s reputation actually remains unchanged.<br />
■ Valuation. We believe Geely will face severe challenges in its rebranding<br />
strategy, selling a made-in-<strong>China</strong> Volvo, as well as intensified competition in<br />
<strong>China</strong>’s low-end sedan segment. We value Geely based on 10x 2013E P/E<br />
as we believe it should trade on par with the sector average given similar<br />
growth rate. Potential upside risks to our TP include improvement in its<br />
exports and better-than-expected sales of its Emgrand brand.<br />
Financial and valuation metrics<br />
Year 12/11A 12/12E 12/13E 12/14E<br />
Revenue (Rmb mn) 20,964.9 24,279.3 30,238.6 37,365.5<br />
EBITDA (Rmb mn) 3,043.7 3,538.7 4,230.9 4,935.1<br />
EBIT (Rmb mn) 2,401.8 2,757.3 3,395.1 4,060.8<br />
Net profit (Rmb mn) 1,543.4 1,743.8 2,107.0 2,535.4<br />
EPS (CS adj.) (Rmb) 0.21 0.23 0.28 0.34<br />
Change from previous EPS (%) n.a.<br />
Consensus EPS (Rmb) n.a. 0.23 0.28 0.33<br />
EPS growth (%) 11.5 12.7 20.7 20.3<br />
P/E (x) 15.8 14.1 11.6 9.7<br />
Dividend yield (%) 0.8 0.9 1.1 1.3<br />
EV/EBITDA (x) 9.5 8.0 6.5 5.2<br />
P/B (x) 2.6 2.2 1.8 1.5<br />
ROE (%) 17.5 16.7 17.0 17.2<br />
Net debt/equity (%) 18.4 9.9 1.6 Net cash<br />
Source: Company data, Thomson Reuters, Credit Suisse estimates.<br />
<strong>China</strong> <strong>Auto</strong> <strong>Sector</strong> 62
Struggling to climb up<br />
Intensifying competition in the low-end segment<br />
Geely is <strong>China</strong>’s largest domestic sedan maker with intensive exposure in the low-end<br />
segment. More than 90% of its sales are from models with official prices below<br />
Rmb100,000. Over 60% of its sales are from models classified as low-end sedans. Due to<br />
the relatively low entry barrier in the low-end sedan segment, the number of players has<br />
already increased significantly during the past few years. Slowing down of demand in this<br />
segment will intensify competition and reduce average selling prices. Moreover, many JVs<br />
have launched their self-owned brands with prices close to the low-end, which we believe<br />
will continue to compress low-end automakers’ margins.<br />
Rebranding remains difficult<br />
Geely is trying to move its coverage to the mid-end segment under its new brands,<br />
Emgrand and GLEagle. It has always been Geely’s goal to move upwards to the mid-end<br />
sedan segment. It even launched these brands with different logos with some of them<br />
priced above Rmb100,000. However, a proliferation of brands could confuse consumers<br />
and is likely to require significant additional marketing spend. This may hardly change<br />
consumers’ perceptions of Geely. Moreover, many JV automakers have introduced their<br />
self-owned brands, with similar prices to Geely’s Emgrand and GLEagle. Many JVs’ lowto-mid<br />
end models are also offering massive prices cuts since 2Q12, with some of them<br />
selling below Rmb100,000. We believe these brands and models will gain market share<br />
from domestic low-end players, such as Geely, and post high pressure on their margins.<br />
Volvo: Limited growth in <strong>China</strong><br />
Most notably, Geely’s acquisition of Volvo was probably aimed at increasing its exposure<br />
to the luxury sedan market, though also putting pressure on Geely’s capital and<br />
management. Geely’s takeover of Volvo granted it access to <strong>China</strong>'s fast-growing luxury<br />
car market. However, Volvo’s sales in <strong>China</strong> were much weaker than other large produced<br />
luxury brands such as BMW and Mercedes-Benz. Geely is also likely to face a tough<br />
challenge in the future to convince brand-conscious Chinese consumers to buy a made-in-<br />
<strong>China</strong> Volvo. Volvo cars are known for high safety standards, while Geely cars are usually<br />
deemed to be not as safe. Geely’s low-cost image may affect Volvo’s brand value and hurt<br />
its image in <strong>China</strong>’s luxury auto segment.<br />
Initiate with UNDERPERFORM<br />
We rate Geely an UNDERPERFORM with a target price of HK$3.50 based on 10x 2013E<br />
EPS (sector average) given: (1) severe challenges from JV brands moving towards the<br />
low-end; (2) challenges over its multi-brand strategy; and (3) intensified competition in the<br />
low-end segment. Potential upside risks to our target price include improvement in Geely’s<br />
export and better-than-expected sales performance of its Emgrand brand.<br />
08 January 2013<br />
We believe Geely will<br />
continue to face margin<br />
pressure due to its intensive<br />
exposure to the low-end<br />
segment<br />
We expect Geely to have a<br />
tough rebranding and high<br />
competition pressure from<br />
JVs’ low-to-mid end models<br />
Geely may have difficulty in<br />
fully localising Volvo in<br />
<strong>China</strong> in the next few years<br />
Initiate with an<br />
UNDERERFORM with a<br />
target price based on 10x<br />
2013E EPS<br />
<strong>China</strong> <strong>Auto</strong> <strong>Sector</strong> 63
Geely <strong>Auto</strong>mobile Holdings Ltd 0175.HK / 175 HK<br />
Price (04 Jan 13): HK$4.08, Rating:: NEUTRAL [V], Target Price: HK$3.50, Analyst: Jack Yeung<br />
Target price scenario<br />
Scenario TP %Up/Dwn Assumptions<br />
Upside 3.65 (10.54) 2013E sales: 575,000 units<br />
Central Case 3.50 (14.22) 2013E sales: 551,000 units<br />
Downside 3.14 (23.04) 2013E sales: 500,000 units<br />
Income statement (Rmb mn) 12/11A 12/12E 12/13E 12/14E<br />
Sales revenue 20,965 24,279 30,239 37,365<br />
Cost of goods sold 17,145 19,920 24,848 30,839<br />
SG&A 2,322 2,889 3,598 4,446<br />
Other operating exp./(inc.) (1,546) (2,068) (2,438) (2,855)<br />
EBITDA 3,044 3,539 4,231 4,935<br />
Depreciation & amortisation 641.9 781.4 835.8 874.3<br />
EBIT 2,402 2,757 3,395 4,061<br />
Net interest expense/(inc.) 211.4 271.9 271.9 302.6<br />
Non-operating inc./(exp.) — — — —<br />
Associates/JV (7.2) — — —<br />
Recurring PBT 2,183 2,485 3,123 3,758<br />
Exceptionals/extraordinaries — — — —<br />
Taxes 467.4 546.8 780.8 939.5<br />
Profit after tax 1,716 1,939 2,342 2,819<br />
Other after tax income — — — —<br />
Minority interests 172.4 194.8 235.4 283.2<br />
Preferred dividends — — — —<br />
Reported net profit 1,543 1,744 2,107 2,535<br />
Analyst adjustments — — — —<br />
Net profit (Credit Suisse) 1,543 1,744 2,107 2,535<br />
Cash flow (Rmb mn) 12/11A 12/12E 12/13E 12/14E<br />
EBIT 2,402 2,757 3,395 4,061<br />
Net interest (122.1) (235.9) (228.6) (247.0)<br />
Tax paid (280.7) (546.8) (780.8) (939.5)<br />
Working capital (1,647) (104) (717) (701)<br />
Other cash & non-cash items 689.7 709.4 749.2 763.1<br />
Operating cash flow 1,042 2,580 2,418 2,936<br />
Capex (1,420) (1,000) (1,000) (1,000)<br />
Free cash flow to the firm (379) 1,580 1,418 1,936<br />
Disposals of fixed assets — — — —<br />
Acquisitions (998.4) (215.4) — —<br />
Divestments 1,153 191 191 191<br />
Associate investments (90.9) (46.4) — —<br />
Other investment/(outflows) (1,596) (614) (457) (444)<br />
Investing cash flow (2,953) (1,685) (1,266) (1,253)<br />
Equity raised 13.9 13.6 — —<br />
Dividends paid (170.4) (192.9) (218.0) (263.4)<br />
Net borrowings 715.6 (100.0) 100.0 100.0<br />
Other financing cash flow — — — —<br />
Financing cash flow 559.0 (279.3) (118.0) (163.4)<br />
Total cash flow (1,352) 616 1,034 1,519<br />
Adjustments (10.2) — — —<br />
Net change in cash (1,363) 616 1,034 1,519<br />
Balance sheet (Rmb mn) 12/11A 12/12E 12/13E 12/14E<br />
Cash & cash equivalents 3,030 3,646 4,680 6,200<br />
Current receivables 12,215 14,168 16,983 19,962<br />
Inventories 1,358 1,583 1,974 2,450<br />
Other current assets 403.4 403.3 403.3 403.3<br />
Current assets 17,006 19,801 24,041 29,016<br />
Property, plant & equip. 6,796 6,993 7,173 7,336<br />
Investments 83.7 130.1 130.1 130.1<br />
Intangibles 2,228 2,708 3,002 3,273<br />
Other non-current assets 1,483 1,480 1,480 1,480<br />
Total assets 27,597 31,112 35,826 41,235<br />
Accounts payable 12,114 14,189 16,679 19,433<br />
Short-term debt 2,532 1,409 1,459 1,510<br />
Current provisions — — — —<br />
Other current liabilities 338.8 338.8 338.8 338.8<br />
Current liabilities 14,985 15,937 18,477 21,281<br />
Long-term debt 2,370 3,393 3,442 3,491<br />
Non-current provisions — — — —<br />
Other non-current liab. 92.2 92.2 92.2 92.2<br />
Total liabilities 17,447 19,422 22,011 24,865<br />
Shareholders' equity 9,582 11,360 13,485 16,040<br />
Minority interests 567.9 330.1 330.1 330.1<br />
Total liabilities & equity 27,597 31,112 35,826 41,235<br />
08 January 2013<br />
Key earnings drivers 12/11A 12/12E 12/13E 12/14E<br />
<strong>Auto</strong>mobile sales volume<br />
(Unit)<br />
421,385 474,789 550,960 627,920<br />
— — — —<br />
— — — —<br />
— — — —<br />
— — — —<br />
Per share data 12/11A 12/12E 12/13E 12/14E<br />
Shares (wtd avg.) (mn) 7,450 7,471 7,478 7,478<br />
EPS (Credit Suisse)<br />
0.21 0.23 0.28 0.34<br />
(Rmb) DPS (Rmb) 0.03 0.03 0.04 0.04<br />
BVPS (Rmb) 1.29 1.52 1.80 2.15<br />
Operating CFPS (Rmb) 0.14 0.35 0.32 0.39<br />
Key ratios and valuation<br />
Growth(%)<br />
12/11A 12/12E 12/13E 12/14E<br />
Sales revenue 4.3 15.8 24.5 23.6<br />
EBIT 11.6 14.8 23.1 19.6<br />
Net profit 12.8 13.0 20.8 20.3<br />
EPS<br />
Margins (%)<br />
11.5 12.7 20.7 20.3<br />
EBITDA 14.5 14.6 14.0 13.2<br />
EBIT 11.5 11.4 11.2 10.9<br />
Pre-tax profit 10.4 10.2 10.3 10.1<br />
Net profit<br />
Valuation metrics (x)<br />
7.36 7.18 6.97 6.79<br />
P/E 15.8 14.1 11.6 9.7<br />
P/B 2.55 2.16 1.82 1.53<br />
Dividend yield (%) 0.79 0.89 1.07 1.29<br />
P/CF 23.5 9.5 10.1 8.4<br />
EV/sales 1.38 1.16 0.90 0.69<br />
EV/EBITDA 9.5 8.0 6.5 5.2<br />
EV/EBIT<br />
ROE analysis (%)<br />
12.1 10.2 8.0 6.4<br />
ROE 17.5 16.7 17.0 17.2<br />
ROIC 18.1 17.3 18.9 20.9<br />
Asset turnover (x) 0.76 0.78 0.84 0.91<br />
Interest burden (x) 0.91 0.90 0.92 0.93<br />
Tax burden (x) 0.79 0.78 0.75 0.75<br />
Financial leverage (x)<br />
Credit ratios<br />
2.72 2.66 2.59 2.52<br />
Net debt/equity (%) 18.4 9.9 1.6 (7.3)<br />
Net debt/EBITDA (x) 0.61 0.33 0.05 (0.24)<br />
Interest cover (x) 11.4 10.1 12.5 13.4<br />
Source: Company data, Thomson Reuters, Credit Suisse estimates.<br />
0<br />
2008 2009 2010 2011 2012 2013<br />
<strong>China</strong> <strong>Auto</strong> <strong>Sector</strong> 64<br />
25<br />
20<br />
15<br />
10<br />
5<br />
4.5<br />
4.0<br />
3.5<br />
3.0<br />
2.5<br />
2.0<br />
1.5<br />
1.0<br />
0.5<br />
12MF P/E multiple<br />
12MF P/B multiple<br />
0.0<br />
2008 2009 2010 2011 2012 2013<br />
Source: IBES
Intensifying competition in the lowend<br />
segment<br />
Largest domestic sedan maker focusing on low-end<br />
Geely has overtaken Chery to become the largest domestic sedan maker in <strong>China</strong>, with<br />
around 4% market share in the sedan sector in the first 11 months of 2012 (Figure 128).<br />
Currently, about 15% of domestic branded sedans sold in <strong>China</strong> are made by Geely<br />
(Figure 129). However, over 90% of its sales are from models with average official prices<br />
below Rmb100,000 (Figure 130) and over 60% of its sales are from models classified as<br />
low-end sedans (Figure 131). Given its intensive exposure to the low-end sedan segment,<br />
we believe Geely will be more easily affected by the slowing demand and tough price<br />
competition in the low-end segment.<br />
08 January 2013<br />
Figure 128: Geely’s market share in <strong>China</strong>’s sedan sector Figure 129: Geely’s sedan sales as % of domestic brands’<br />
Geely <strong>Auto</strong><br />
4%<br />
Others<br />
45%<br />
Jan-Nov 2012<br />
Chang'an<br />
Ford<br />
4%<br />
SH GM<br />
12%<br />
FAW VW<br />
12%<br />
SH VW<br />
10%<br />
DF Nissan<br />
6%<br />
BJ<br />
Hyundai<br />
6%<br />
sedan sales<br />
<strong>China</strong> <strong>Auto</strong> <strong>Sector</strong> 65<br />
Lifan<br />
4%<br />
Zhonghua<br />
(Huachen)<br />
4%<br />
Others<br />
33%<br />
Jianghuai<br />
4%<br />
Jan-Nov 2012<br />
Great Wall<br />
7%<br />
Source: CAAM, Credit Suisse estimates Source: CAAM, Credit Suisse estimates<br />
Geely<br />
15%<br />
Chery<br />
13%<br />
BYD<br />
12%<br />
Chang'an<br />
8%<br />
Figure 130: Geely product portfolio (by price) Figure 131: Geely product portfolio (by product category)<br />
Average<br />
Official<br />
Prices >=<br />
RMB100k<br />
9%<br />
Jan-Nov 2012<br />
Avearge<br />
Official<br />
Prices <<br />
RMB100k<br />
91%<br />
Mid- to<br />
high-end<br />
sedan<br />
0.2%<br />
Low-end<br />
sedan<br />
61%<br />
Jan-Nov 2012<br />
Source: Geely, Credit Suisse estimates Source: Geely, Credit Suisse estimates<br />
Affected by the weakening demand of low-end sedans, Geely’s domestic sales slowed in<br />
2012. It sold 332,893 vehicles in the domestic market in the first 11 months of 2012, about<br />
2% lower than the same period last year. During the past 11 months, Geely has<br />
experienced YoY sales decline for six months. Among this, its monthly sales declined by<br />
over 5% YoY in five consecutive months, from March to July (Figure 132).<br />
Given Geely’s intensive<br />
exposure to the low-end<br />
sedan segment, we believe<br />
it will be affected by slowing<br />
demand and the tough price<br />
competition in this segment<br />
Mid-end<br />
sedan<br />
3%<br />
Low- to<br />
mid-end<br />
sedan<br />
30%<br />
Low- to<br />
mid-end<br />
SUV<br />
6%<br />
Slowdown of Geely’s<br />
domestic sales in 2012
Figure 132: Geely’s domestic sales in 2011 and 2012<br />
80,000<br />
70,000<br />
60,000<br />
50,000<br />
40,000<br />
30,000<br />
20,000<br />
10,000<br />
-<br />
Unit<br />
-26%<br />
10%<br />
-7% -6% -5%<br />
-11%<br />
Jan Feb Mar Apr May Jun Jul Aug Sep Oct Nov Dec<br />
Source: Geely, Credit Suisse estimates<br />
-8%<br />
0%<br />
08 January 2013<br />
<strong>China</strong> <strong>Auto</strong> <strong>Sector</strong> 66<br />
11%<br />
20%<br />
11%<br />
2011 Domestic Sales 2012 Domestic Sales 2012 Domestic Sales y-y<br />
Due to the relatively low entry barriers in the low-end sedan segment, the number of players<br />
has already increased significantly during the past few years. Slowing down of demand will<br />
intensify competition and reduce average selling prices. For example, dealers are offering 4-<br />
11% discount on Geely’s major low-end models over the past three months, and we expect<br />
these discounts to continue into 1Q13 (Figure 133). Moreover, without strong demand<br />
growth to boost production and enhance economies of scale, it becomes more difficult to<br />
lower the average cost. Therefore, we believe the average margin in the low-end sedan will<br />
narrow drastically. Other than that, there may be risk of overcapacity if demand for low-end<br />
sedans grows more slowly than expected. As new capacities built for low-end sedans are<br />
less likely to be fully utilized, production efficiency should decline. In the long term, rising idle<br />
resources may further erode the squeezed margins of auto producers.<br />
Figure 133: Retail prices of Geely’s major low-end models<br />
Official Oct-12 Price Nov-12 Price Dec-12 Price<br />
price retail price cut retail price cut retail price cut<br />
Model (’000 Rmb) (’000 Rmb) (%) (’000 Rmb) (%) (’000 Rmb) (%)<br />
FreeCruiser 1.3L 45.8 41.8 9 40.8 11 41.8 9<br />
FreeCruiser 1.5L MT 46.8 40.8 13 40.8 13 40.8 13<br />
FreeCruiser 1.5L AT 52.8 46.8 11 46.8 11 46.8 11<br />
Panda 1.0L Basic 37.8 34.8 8 33.8 11 33.8 11<br />
Panda 1.0L Comfort 43.8 40.8 7 39.8 9 39.8 9<br />
Panda 1.0L Luxury 47.8 44.8 6 43.8 8 43.8 8<br />
Panda 1.3L Delux 58.8 55.8 5 54.8 7 54.8 7<br />
GC7 1.8 MT Elite 2012 69.9 66.9 4 66.9 4 63.9 9<br />
GC7 1.8 AT Comfort 2012 76.9 73.9 4 73.9 4 70.9 8<br />
GC7 1.8 MT Delux 2012 76.9 73.9 4 73.9 4 70.9 8<br />
Kingkong II 1.5MT 2010 52.8 47.8 9 47.8 9 47.8 9<br />
Kingkong II VVT 1.5MT 2010 53.8 48.8 9 48.8 9 48.8 9<br />
Kingkong II 1.5MT Delux 2010 56.8 51.8 9 51.8 9 51.8 9<br />
Kingkong II VVT 1.5MT Delux 2010 57.8 52.8 9 52.8 9 52.8 9<br />
Source: Channel checks with dealers<br />
30%<br />
20%<br />
10%<br />
0%<br />
-10%<br />
-20%<br />
-30%<br />
-40%<br />
-50%<br />
We believe the low-end<br />
segment will continue to<br />
face high margin pressure
Rebranding remains difficult<br />
Sub brands didn’t change Geely’s low-end image<br />
Launching new models under different brands is part of Geely’s strategy to make its<br />
products appealing to a wider range of consumers. Currently, it is using three baby<br />
brands: GLEagle, Emgrand and Englon. GLEagle is to be used for all affordable<br />
subcompacts, Englon for tasteful and friendly cars and Emgrand for more upscale vehicles.<br />
Most of GLEagle and Englon products are priced below Rmb100,000 (Figure 136). GX7 is<br />
the first low- to mid-end SUV of Geely priced above Rmb100,000. TX4 is priced above<br />
Rmb200,000 in the mid- to high-end segment, but sold only 724 units in the first 11<br />
months of 2012. Emgrand’s brand mainly consists of low-to-mid end sedans, accounting<br />
for about 32% of Geely’s total sales. However, over 90% of Emgrand’s sales were from<br />
the EC7 and EC7-RV, which were mainly sold below Rmb100,000. Geely's multi-brand<br />
strategy can be deemed as a tall task on changing its low-end image. However, a<br />
proliferation of brands could confuse consumers and is likely to require significant<br />
additional marketing spending.<br />
08 January 2013<br />
Figure 134: Geely’s vehicle models<br />
Brand Model Price ('000 Rmb) Launch time of new model 2012E sales (‘000 units) 2013E sales (‘000 units)<br />
Emgrand EC7 69.8 - 109.8 141.5 152<br />
EC7-RV 66.8 - 105.8 0 0<br />
EC8 105.8 - 159.8 11.2<br />
Upgraded EC8 148 - 159.8 1Q13<br />
EX6 60 - 80 1H13 8<br />
EX8 130 - 180 1H13 8<br />
EV8 80 - 120 2H13 2<br />
SX7 92.8 - 129.8 Early 2013 12<br />
GLEagle Panda 37.8 - 69.8<br />
GX2 51.8 - 65.8<br />
<strong>China</strong> <strong>Auto</strong> <strong>Sector</strong> 67<br />
12.8<br />
31.3 32.7<br />
GX7 92.9 - 129.9 32 51.2<br />
GC7 61.9 - 89.9 15.6 18<br />
Vision 50.9 - 69.9 30.8 32.3<br />
Free Cruiser 33.8 - 55.8 64.2 67<br />
Englon Kingkong 52.8 - 60.8 76.6 80<br />
SC3 40.8 - 47.8 12.7 14<br />
SC5-RV 55.3 - 59.3 2.3<br />
SC5-RV 1.3T 56 - 61 2H13<br />
SC6 53.8 - 60.8 11.4 12.3<br />
SC7 53.9 - 85.9 44.7 45<br />
TX4 208 - 228 0.8 0.9<br />
Volvo XC60 330 - 600 0.1<br />
Total 475 551<br />
Source: Geely, Credit Suisse estimates<br />
Figure 135: Launching time of Geely’s new models<br />
Jan Feb Mar Apr May Jun Jul Aug Sep Oct Nov Dec<br />
SX7 Early 2013<br />
Upgraded EC8 1Q13<br />
EX6 1H13<br />
EX8 1H13<br />
EV8 2H13<br />
SC5-RV 1.3T 2H13<br />
XC60 End-2013<br />
Source: Geely<br />
Geely’s multi-brand strategy<br />
could not drastically change<br />
its low-end image<br />
2.6
Figure 136: Official prices of Geely models<br />
Volvo<br />
Source: Geely<br />
08 January 2013<br />
- 50,000 100,000 150,000 200,000 250,000 300,000 350,000 400,000<br />
EC7<br />
RMB<br />
EC7-RV<br />
EC8<br />
Upgraded EC8<br />
EX6<br />
EX8<br />
EV8<br />
SX7<br />
Panda<br />
Emgrand<br />
GX2<br />
GX7<br />
GC7<br />
Vision<br />
Free Cruiser<br />
Kingkong<br />
GLEagle<br />
SC3<br />
SC5-RV<br />
SC5-RV 1.3T<br />
SC6<br />
SC7<br />
TX4<br />
XC60<br />
Englon<br />
Existing model New model<br />
Figure 137: Comparison of Geely Emgrand EC8 and its major competitors<br />
Model<br />
Geely Emgrand EC8 Chery New Eastar BYD F6 Hyundai Sonata moInca<br />
2.0MT Advance 2.0MT Elegant 2.0CVT VIP 2.0M GL Comfort<br />
Official price (’000 Rmb) 99.8 103.8 109.8 116.8<br />
Dec-12 retail price (’000 Rmb) 89.8 88.8 89.8 91.8<br />
Size (m) 4.905/1.830/1.495 4.866/1.840/1.500 4.846/1.822/1.465 4.770/1.820/1.440<br />
Wheelbase (m) 2.805 2.768 2.74 2.7<br />
Trunk volume (Litre) 504 585 480 430<br />
Tank volume (Litre) 63 65 65 65<br />
Complete mass (kg) 1490 1480 1435 1435<br />
Engine size (L) 1.997 1.971 1.991 1.975<br />
Max power (kW/rpm) 104/6000 102/5750 103/6000 101/6000<br />
Max toque (n.m/rpm) 178/4000-4500 182/4300-4500 186/4000-4500 180/4500<br />
Acceleration 0-100 km/h (s) 9.5 15.6 11 14.2<br />
Transmission 5MT 5MT CVT 5MT<br />
Fuel consumption (L/100km) 9.8 6.7 8.3 8.1<br />
Warranty 3 years or 100,000km 3 years or 60,000km 5 years or 100,000km 2 years or 60,000km<br />
Emission standard National IV National IV National IV National IV<br />
Source: Xcar, Channel checks with dealers<br />
<strong>China</strong> <strong>Auto</strong> <strong>Sector</strong> 68
Figure 138: Comparison of Geely Englon Kingkong II and its major competitors<br />
Model<br />
Geely Englon Kingkong II Xiali Weizhi BYD F3 Lifan 620<br />
08 January 2013<br />
1.5MT Standard 1.5MT Standard 1.5MT Comfort 1.5MT ComfortA<br />
Official price (’000 Rmb) 52.8 53.8 54.9 54.9<br />
Dec-12 retail price (’000 Rmb) 47.8 50.8 48.9 49.9<br />
Size (m) 4.342/1.692/1.435 4.245/1.680/1.500 4.533/1.705/1.490 4.550/1.705/1.495<br />
Wheelbase (m) 2.502 2.425 2.6 2.605<br />
Trunk volume (Litre) 450 450 450 650<br />
Tank volume (Litre) 45 45 50 58<br />
Complete mass (kg) 1090 995 1210 1150<br />
Engine size (L) 1.498 1.498 1.499 1.498<br />
Max power (kW/rpm) 69/6000 75/6000 80/5800 69/6000<br />
Max toque (n.m/rpm) 128/3400 130/4400 145/4800 128/3500-5000<br />
Acceleration 0-100 km/h (s) 12.8 14 14.9 12<br />
Transmission 5MT 5MT 5MT 5MT<br />
Fuel consumption (L/100km) 7.3 7.5 6.5 6<br />
Warranty 3 years or 100,000km 2 years or 50,000km 4 years or 100,000km 3 years or 60,000km<br />
Emission standard National IV National IV National IV National IV<br />
Source: Xcar, Channel checks with dealers<br />
Figure 139: Comparison of Geely GLEagle FreeCruiser and its major competitors<br />
Model<br />
Geely GLEagle<br />
FreeCruiser<br />
Lifan 520 Changan Yuexiang V3 Suzuki Cultus II<br />
1.3MT Fashion II 1.3MT Navi Basic 1.3MT Basic 1.3MT Basic<br />
Official price (’000 Rmb) 40.9 40.9 43.9 41.8<br />
Dec-12 retail price (’000 Rmb) 36.9 37.9 40.9 38.8<br />
Size (m) 4.152/1.680/1.440 4.370/1.700/1.473 4.180/1.650/1.465 4.1105/1.590/1.395<br />
Wheelbase (m) 2.434 2.54 2.41 2.365<br />
Trunk volume (Litre) 300 630 580 500<br />
Tank volume (Litre) 45 51 36 40<br />
Complete mass (kg) 1052 1155 985 895<br />
Engine size (L) 1.342 1.342 1.298 1.298<br />
Max power (kW/rpm) 63/6000 65/6000 69/6000 67/6000<br />
Max toque (n.m/rpm) 110/5200 110/3500-5000 121/4000-5000 115/2500-3500<br />
Acceleration 0-100 km/h (s) 14.7 9.9 10.4 15<br />
Transmission 5MT 5MT 5MT 5MT<br />
Fuel consumption (L/100km) 7.1 5.8 5.6 5.8<br />
Warranty 2 years or 60,000km 3 years or 60,000km 2 years or 60,000km 3 years or 100,000km<br />
Emission standard National IV National IV National IV National IV<br />
Source: Xcar, Channel checks with dealers<br />
<strong>China</strong> <strong>Auto</strong> <strong>Sector</strong> 69
Low utilization rate for Geely’s mid-end capacity<br />
Geely has around 130,000 units of capacity reserved for its three mid-end and mid-to-high<br />
end models: the Jinan plant has 60,000 units of capacity for EC8, the Chengdu plant has<br />
60,000 units of capacity for GX7, and the Shanghai plant has 10,000 units for TX4. In the<br />
first 11 months of 2012, their utilization rates were only around 49.7%, 19.5%, and 7.9%,<br />
respectively. If we divide Geely’s capacity into two groups categorized by engine size, it<br />
has 530,000 units of capacity for vehicles with engine size lower than 2.0L, whose<br />
capacity utilization rate has improved by 8.3% to 84.9% in the first 11 months of 2012<br />
(Figure 140). However, the utilization rate of its capacity for vehicles with engine size<br />
larger than or equal to 2.0L dropped by 4.9% to 17.8% (Figure 140). In the absence of<br />
strong sales of mid-end and mid-to-high end models, we expect their capacity to continue<br />
to be a huge burden for Geely. Without substantial structural change in its product portfolio,<br />
we expect the company to retain its low-end image in the next few years.<br />
Figure 140: Utilisation rate of Geely’s capacity by engine size<br />
800,000<br />
700,000<br />
600,000<br />
500,000<br />
400,000<br />
300,000<br />
200,000<br />
100,000<br />
-<br />
Unit<br />
530,000<br />
76.6%<br />
405,756<br />
485,833<br />
84.9%<br />
412,380<br />
70,000<br />
15,855<br />
08 January 2013<br />
<strong>China</strong> <strong>Auto</strong> <strong>Sector</strong> 70<br />
22.7%<br />
17.8%<br />
64,167<br />
Engine size =2L<br />
11,449<br />
2011 Capacity (LHS) 2011 Sales (LHS)<br />
Jan-Nov 12 Capacity (LHS) Jan-Nov 12 Sales (:HS)<br />
2011 utilization rate (RHS) Jan-Nov 12 utilization rate (RHS)<br />
Source: Company data, Credit Suisse estimates<br />
Competition pressure from JVs and domestic peers<br />
Geely’s mid- to low-end sub brand Emgrand is mainly priced between Rmb80,000 and<br />
Rmb130,000, with its current retail prices between Rmb78,000 and Rmb124,000 (Figure<br />
141). Some of the models, such as EC8 and EC7 CVT, are priced above Rmb100,000,<br />
higher than most JVs’ self-owned brands. They are also facing price pressure from JVs’<br />
mid- to low-end sedan models, which have experienced massive prices cuts since 2Q12<br />
and are selling below Rmb100,000 (Figure 142). Given Geely’s low-end image and the<br />
relatively high selling prices of its Emgrand models, we expect more customers to choose<br />
JVs’ low-to-mid end models, which may bring down Emgrand’s prices and hurt its margins.<br />
Moreover, Geely’s other mid-to-low models—its first SUV, GX7—exhibited much weaker<br />
ramp-up of sales compared with its domestic peers: Great Wall Hover H6 and BYD S6.<br />
Although these three SUVs have similar prices and specs, GX7’s monthly sales remained<br />
below 5,000 units after it was launched, while monthly sales of both H6 and S6 exceeded<br />
10,000 units within ten months of their launch (Figure 103). The large gap between GX7<br />
and its peers suggests Geely’s weak brand image in the SUV segment, which we believe<br />
is unlikely to substantially improve in the near term.<br />
90.0%<br />
80.0%<br />
70.0%<br />
60.0%<br />
50.0%<br />
40.0%<br />
30.0%<br />
20.0%<br />
10.0%<br />
0.0%<br />
We expect Geely’s mid-end<br />
capacity to maintain low<br />
utilisation rate in next few<br />
years.<br />
We believe Geely will face<br />
intensifying competition from<br />
JVs’ low-to-mid end models<br />
and its domestic peers such<br />
as Great Wall and BYD
08 January 2013<br />
Figure 141: Retail prices of Geely’s major low-to-mid end models<br />
Official Oct-12 Price Nov-12 Price Dec-12 Price<br />
price retail price cut retail price cut retail price cut<br />
Model (’000 Rmb) (’000 Rmb) (%) (’000 Rmb) (%) (’000 Rmb) (%)<br />
EC7 1.8L Basic 79.8 76.8 4 73.8 8 70.8 11<br />
EC7 1.8L Comfort 82.8 79.8 4 76.8 7 73.8 11<br />
EC7 1.8L Delux 89.8 84.8 6 83.8 7 80.8 10<br />
EC71.8L CVT RV Delux 98.8 93.8 5 92.8 6 88.8 10<br />
EC71.8L CVT Delux 101.8 96.8 5 95.8 6 91.8 10<br />
EC8 2.0L MT Basic 105.8 100.8 5 97.8 8 99.8 6<br />
EC8 2.0L MT Comfort 109.8 104.8 5 101.8 7 101.8 7<br />
EC8 2.0L AT Basic 117.8 112.8 4 109.8 7 107.8 8<br />
EC8 2.0L AT Comfort 121.8 116.8 4 113.8 7 109.8 10<br />
EC8 2.0L AT Luxury 128.8 123.8 4 120.8 6 113.8 12<br />
Source: Channel checks with dealers<br />
Figure 142: Retail prices of JVs' major low-to-mid end models<br />
Official Oct-12 Price Nov-12 Price Dec-12 Price<br />
price retail price cut retail price cut retail price cut<br />
Brand Model (’000 Rmb) (’000 Rmb) (%) (’000 Rmb) (%) (’000 Rmb) (%)<br />
Honda City 1.5 MT Comfort 79.8 59.8 25 61.8 23 62.8 21<br />
City 1.5 AT Comfort 89.8 69.8 22 71.8 20 72.8 19<br />
City 1.5 MT 99.8 79.8 20 81.8 18 82.8 17<br />
Toyota Yaris 1.6E MT 88.8 73.8 17 73.8 17 73.8 17<br />
Yaris 1.6E AT 94.8 79.8 16 79.8 16 79.8 16<br />
Yaris 1.6GS AT 106.8 91.8 14 91.8 14 88.8 17<br />
New Yaris 1.3E AT 2011 93.0 78.0 16 78.0 16 75.0 19<br />
New Yaris 1.6E MT 2011 88.8 73.8 17 73.8 17 70.8 20<br />
New Yaris 1.6G MT 2011 94.8 79.8 16 79.8 16 76.8 19<br />
New Yaris 1.6E AT 2011 94.8 79.8 16 79.8 16 76.8 19<br />
New Yaris 1.6G AT 2011 100.8 85.8 15 85.8 15 82.8 18<br />
Corolla EX 1.6 MT Classic 97.8 77.8 20 79.8 18 82.8 15<br />
Corolla EX 1.6 MT Delux 106.8 86.8 19 88.8 17 91.8 14<br />
Corolla EX 1.6 AT Classic 105.8 85.8 19 87.8 17 90.8 14<br />
Corolla EX 1.6 AT Delux 114.8 94.8 17 96.8 16 99.8 13<br />
Mazda Mazda2 1.3L MT 81.8 70.8 13 73.8 10 66.8 18<br />
Mazda2 1.3L AT 89.8 78.8 12 81.8 9 74.8 17<br />
Mazda2 1.5L MT 88.8 77.8 12 80.8 9 73.8 17<br />
Mazda2 1.5L AT 96.8 85.8 11 88.8 8 81.8 15<br />
Mazda2 1.5L AT Delux 105.8 94.8 10 97.8 8 90.8 15<br />
Buick Excelle 1.6 LX MT2012 99.9 81.9 18 76.9 23 71.9 28<br />
Excelle 1.6 LX AT2012 104.9 86.9 17 81.9 22 76.9 27<br />
Excelle 1.6 LE MT2012 107.9 89.9 17 84.9 21 79.9 26<br />
Excelle 1.6 LE AT2012 117.9 99.9 15 94.9 20 89.9 24<br />
Chevloret Spark P-TEC 1.0MT Energy 43.3 36.3 16 36.3 16 38.3 12<br />
Spark P-TEC 1.0MT Fashion 46.8 39.8 15 39.8 15 41.8 11<br />
Spark 1.2MT Sport Excellence 42.8 34.8 19 35.8 16 37.8 12<br />
Spark 1.2MT Sport Energy 45.8 37.8 17 38.8 15 40.8 11<br />
Spark 1.2MT Sport Fashion 49.8 39.8 20 42.8 14 44.8 10<br />
Hyundai Elantra 1.6 MT 2011 version 89.8 80.8 10 78.8 12 79.8 11<br />
Elantra 1.6 AT 2011 version 98.8 89.8 9 87.8 11 88.8 10<br />
Ford Focus 1.8L MT Classic 104.8 97.8 7 89.8 14 89.8 14<br />
Focus 1.8L MT Comfort 114.8 107.8 6 99.8 13 99.8 13<br />
Source: Channel checks with dealers<br />
<strong>China</strong> <strong>Auto</strong> <strong>Sector</strong> 71
Volvo: Limited growth in <strong>China</strong><br />
Volvo remains a small player even after a decade<br />
Apart from the latest batch of new models, Geely’s US$1.8 bn acquisition of Volvo may<br />
provide it the ability to improve the quality of its cars by incorporating Volvo’s advanced<br />
technology. Moreover, the deal could provide Geely with a highly recognized brand equity<br />
and a shortcut to the global automobile market. However, it remains to be seen if Geely<br />
has sufficient financial muscle and management wisdom to make Volvo profitable quickly.<br />
It looks very hard for Geely to turn Volvo around from its poor performance within a few<br />
years. Even in <strong>China</strong>’s fast-growing luxury auto sector, Volvo’s sales in 1H12 only<br />
increased by 1.7% YoY, compared to the sector’s average of around 25%. Its Chinese<br />
market share dropped to around 3.4% in 1H12, slightly higher than its 2.9% share in 2004<br />
(Figure 143). Given the weak sales performance, we believe Volvo is unlikely to easily<br />
recover its competitiveness against other luxury brands. We expect Volvo to maintain its<br />
current market share in <strong>China</strong>’s luxury auto sector, which would still be around 3% by<br />
2015 (Figure 145).<br />
Figure 143: Volvo’s market share in <strong>China</strong><br />
350,000<br />
300,000<br />
250,000<br />
200,000<br />
150,000<br />
100,000<br />
50,000<br />
0<br />
units<br />
2003 2004 2005 2006 2007 2008 2009 2010 2011 1H12<br />
BMW Group sales (LHS) Benz sales (LHS) Audi sales (LHS)<br />
Lexus sales (LHS) Volvo sales (LHS) Volvo market share (RHS)<br />
Source: Company data, Credit Suisse estimates<br />
08 January 2013<br />
Figure 144: <strong>China</strong> market share of luxury brands (2004) Figure 145: <strong>China</strong> market share of luxury brands (2015E)<br />
Volvo Others<br />
Lexus<br />
0%<br />
3% 3%<br />
Audi<br />
68%<br />
BMW<br />
16%<br />
Mercedes-<br />
Benz<br />
10%<br />
<strong>China</strong> <strong>Auto</strong> <strong>Sector</strong> 72<br />
5.0%<br />
4.5%<br />
4.0%<br />
3.5%<br />
3.0%<br />
2.5%<br />
2.0%<br />
1.5%<br />
1.0%<br />
0.5%<br />
0.0%<br />
Mercedes-<br />
Benz<br />
24%<br />
Source: Company data, Credit Suisse estimates Source: Company data, Credit Suisse estimates<br />
Volvo<br />
3%<br />
Lexus<br />
5%<br />
Audi<br />
26%<br />
Others<br />
15%<br />
We believe it is difficult for<br />
Volvo to change its weaker<br />
position than other luxury<br />
brands in <strong>China</strong>.<br />
BMW<br />
27%
Long way to massive localization<br />
Based on Volvo’s historical sales performance, we do not think Geely can quickly turn<br />
around Volvo’s competitiveness after a decade of weak performance. In the Chinese<br />
luxury car market, localization is key to luxury brands’ success. Many luxury brands have<br />
already established JVs with Chinese partners. These JVs have their own plants and have<br />
been producing <strong>China</strong>-made or <strong>China</strong>-only models for a few years (e.g., Audi built its first<br />
product line in FAW in 1990). Localized production lowers the cost of labor, transportation<br />
and tariffs. It also cultivates a localized platform to create diversified models to satisfy endusers’<br />
requirements. Volvo also produces locally under Chang’an Ford’s plant, but it did<br />
not seem to give the brand a strong support in its sales. Since 2009, Volvo experienced<br />
the steepest decline in its localization rate compared with other major luxury brands in<br />
<strong>China</strong> (Figure 146). Sales of its <strong>China</strong>-made models also dropped by about 17% to 14,200<br />
units in 2011 (Figure 147).<br />
Figure 146: Sales of <strong>China</strong> made cars as a percentage of Chinese sales<br />
100%<br />
90%<br />
80%<br />
70%<br />
60%<br />
50%<br />
40%<br />
30%<br />
20%<br />
10%<br />
0%<br />
2006 2007 2008 2009 2010 2011 2012E<br />
Source: Company data, Credit Suisse estimates<br />
BMW Benz Audi Volvo<br />
Figure 147: Sales of <strong>China</strong>-made luxury vehicles<br />
300,000<br />
250,000<br />
200,000<br />
150,000<br />
100,000<br />
50,000<br />
-<br />
Unit<br />
93,168 98,461<br />
104,867<br />
77,192<br />
77,551<br />
69,878<br />
61,276 62,017<br />
50,101<br />
43,702<br />
30,600 35,163<br />
38,856<br />
3,052 8,661<br />
15,300<br />
22,550<br />
5,614 7,018<br />
14,355 15,921<br />
17,091 14,200<br />
3,324 5,644 5,605 15,145<br />
08 January 2013<br />
<strong>China</strong> <strong>Auto</strong> <strong>Sector</strong> 73<br />
137,790<br />
194,920<br />
2003 2004 2005 2006 2007 2008 2009 2010 2011<br />
Source: Company data, Credit Suisse estimates<br />
BMW Benz Audi Volvo<br />
252,000<br />
Given Volvo’s historical<br />
performance in <strong>China</strong>, it<br />
may difficult for Geely to<br />
fully localise this brand in a<br />
short while
Volvo plans to build two new plants from scratch in Shanghai and Daqing. It is also using<br />
Geely’s existing production facility in Chengdu to build another plant, mainly for SUVs,<br />
which may commence operations next year with initial capacity of around 50,000 units.<br />
Each of Volvo’s new plants in <strong>China</strong> has phase I designed capacity of 100,000 units. We<br />
expect its total capacity in <strong>China</strong> to reach around 315,000 units by 2015, including<br />
Chang’an Ford’s existing capacity (Figure 148). This would be equivalent to around 50%<br />
of Audi’s <strong>China</strong> capacity, during that time (Figure 148). However, Volvo only sold around<br />
325,000 units globally and about 47,000 units in <strong>China</strong> in 2011. Given its small market<br />
share in <strong>China</strong>’s luxury auto market, its 300,000 units of planned new capacity seem to be<br />
very aggressive and expensive at the moment. Moreover, Geely does not have strong and<br />
experienced technical teams like FAW, Brilliance, and Beijing <strong>Auto</strong>. So we think it may be<br />
difficult for Geely to quickly import and digest Volvo’s technology. Recalling FAW and<br />
Audi’s 20-year efforts towards localization, it looks very difficult for Geely to fully localize<br />
Volvo to directly challenge Audi, BMW, and Benz in the Chinese luxury car market.<br />
Figure 148: Capacity expansion of luxury brands in <strong>China</strong><br />
'000 units<br />
700<br />
600<br />
500<br />
400<br />
300<br />
200<br />
100<br />
0<br />
200 200<br />
300 300<br />
200<br />
105<br />
120<br />
95<br />
75<br />
40<br />
50<br />
25 15 15 15 15<br />
390<br />
360<br />
220<br />
08 January 2013<br />
<strong>China</strong> <strong>Auto</strong> <strong>Sector</strong> 74<br />
65<br />
490<br />
460<br />
320<br />
190<br />
600<br />
560<br />
2009 2010 2011 2012E 2013E 2014E 2015E<br />
Source: Company data, Credit Suisse estimates<br />
Audi BMW Mercedes-Benz Volvo*<br />
*Volvo capacity between 2009-2012 was estimated based on Changan Ford’s Volvo production volume<br />
Geely’s low-cost image may smear the Volvo brand<br />
Another major obstacle to Volvo’s growth in the Chinese market is its relatively low brand<br />
recognition, which may also be affected by Geely’s image as a low-end sedan<br />
manufacturer. In <strong>China</strong>’s luxury car market, Volvo’s models are sold at a much cheaper<br />
price than other luxury brands, especially after its recent massive price cuts by around 10-<br />
30% (Figure 149). However, its sales volume is much smaller. Even if Geely applies its<br />
low-cost strategy to Volvo, we do not think an even lower price will solve Volvo’s problem.<br />
Volvo labeled "security" as its brand DNA—similar to BMW’s “driving”, Benz’s “comfort”<br />
and Audi's “technology”. However, we do not believe that this means that luxury car<br />
buyers will think of BMW, Benz or Audi as unsafe, or even that they are any less safe than<br />
a Volvo. These competitors' brand DNAs—to enjoy “driving” a BMW, or to own “comfort” in<br />
a Benz—are prime considerations of consumers. We think Volvo’s overemphasis on its<br />
security attributes will inevitably miss the key features end-users pursue, which we think<br />
was a great drawback for Volvo’s <strong>China</strong> brand strategy prior to Geely’s acquisition of it.<br />
420<br />
315<br />
Volvo will have two new<br />
plants in <strong>China</strong> but still lag<br />
behind other luxury brands’<br />
expansion of their <strong>China</strong><br />
capacity.<br />
Geely’s low-cost image will<br />
likely hurt Volvo’s brand<br />
recognition and sales in<br />
<strong>China</strong>
Figure 149: Retail prices of major luxury brands<br />
08 January 2013<br />
Official Oct-12 Price Nov-12 Price Dec-12 Price<br />
price retail price cut retail price cut retail price cut<br />
Brand Model (’000 Rmb) (’000 Rmb) (%) (’000 Rmb) (%) (’000 Rmb) (%)<br />
Volvo S40 2.0DCT Smart 2011 268.0 223.0 17 208.0 22 208.0 22<br />
S40 2.0DCT Elegant 2011 288.0 243.0 16 228.0 21 228.0 21<br />
S40 2.0DCT Delux 2011 308.0 263.0 15 248.0 19 248.0 19<br />
C30 2.0DCTAktive 2012 299.0 274.0 8 269.0 10 279.0 7<br />
C30 2.0DCTAktive Joy 2012 225.0 200.0 11 195.0 13 205.0 9<br />
C30 2.0DCTAktive Flash 2012 233.8 208.8 11 203.8 13 213.8 9<br />
S60 2.0T DCTT5 Smart 2012 249.8 199.8 20 199.8 20 199.8 20<br />
S60 2.0T DCTT5 Comfort 2012 319.9 269.9 16 269.9 16 264.9 17<br />
S60 1.6T DCTDRIVe Smart 2012 282.8 232.8 18 222.8 21 212.8 25<br />
S60 1.6T DCTDRIVe Comfort 2012 306.8 256.8 16 246.8 20 236.8 23<br />
S60 1.6T DCTDRIVe Smart 2012 334.8 284.8 15 274.8 18 264.8 21<br />
S60 2.0T DCTT5 Comfort 2012 339.8 259.8 24 264.8 22 259.8 24<br />
S60 2.0T DCTT5 Delux 2012 369.8 289.8 22 294.8 20 289.8 22<br />
S60 3.0T ATT6 AWD Delux 2012 529.8 454.8 14 454.8 14 429.8 19<br />
Mercedes-Benz C180K Classic 308.0 233.0 24 218.0 29 158.0 49<br />
C200 CGI 348.0 258.0 26 248.0 29 193.0 45<br />
C200 CGI Fashion 388.0 283.0 27 268.0 31 233.0 40<br />
BMW 318i 2.0 AT Advance 2012 296.0 249.0 16 246.0 17 241.0 19<br />
320i 2.0 AT Morden 2012 351.0 304.0 13 301.0 14 296.0 16<br />
320i 2.0 AT Delux 2012 388.8 341.8 12 338.8 13 333.8 14<br />
325i 2.5 AT Fashion 2012 413.8 333.8 19 338.8 18 333.8 19<br />
Audi A6L 2.0 TFSI Basic 2011 389.0 359.0 8 329.0 15 319.0 18<br />
A6L 2.0 TFSI Comfort AT 2011 355.0 325.0 8 295.0 17 285.0 20<br />
A4L 2.0 TFSI(155kW) Sport 2012 369.8 329.8 11 329.8 11 309.8 16<br />
A4L 2.0 TFSI(155kW) Delux 2012 399.0 359.0 10 359.0 10 339.0 15<br />
A4L 1.8 TFSI MT Comfort 2012 272.8 232.8 15 234.8 14 217.8 20<br />
A4L 1.8 TFSI CVT Comfort 2012 291.0 251.0 14 253.0 13 236.0 19<br />
A4L 2.0 TFSI CVT Standard 2012 309.8 269.8 13 271.8 12 254.8 18<br />
A4L 2.0 TFSI CVT Comfort 2012 329.9 289.9 12 291.9 12 274.9 17<br />
A4L 2.0 TFSI CVT Tech 2012 369.8 329.8 11 331.8 10 314.8 15<br />
Lexus CT200h 1.8 CVT Elite 2012 279.0 234.0 16 239.0 14 229.0 18<br />
CT200h 1.8 CVT Advance 2012 339.0 294.0 13 289.0 15 289.0 15<br />
CT200h 1.8 CVTF Sport 2012 365.0 320.0 12 315.0 14 315.0 14<br />
Source: Channel checks with dealers<br />
Due to shortcomings of Volvo’s brand strategy in <strong>China</strong>, we think that Chinese customers’<br />
current interpretation of its brand does not reflect its true value. Geely’s image as a lowend<br />
auto manufacturer may further affect Volvo’s reputation as a premium brand. From<br />
Geely’s point of view, it always wanted to have its own luxury brands, which usually takes<br />
a long time to achieve. The acquisition of Volvo may shorten the time to achieve this, but<br />
the corresponding damage to Volvo’s brand may be unavoidable. A 26-year-old Chinese<br />
private enterprise controlling an 85-year-old European classic brand might be something<br />
that many people would not accept easily—especially luxury car buyers. Most importantly,<br />
the low-cost image of Geely may smear the outstanding attributes of Volvo in the Chinese<br />
market—namely, its quality and security. Geely intends to use a few low-cost strategies<br />
with regards to Volvo, to obtain a price advantage, which can boost product sales in the<br />
short term, but which we feel, is more likely to drag Volvo away from the Benz, BMW and<br />
Audi luxury car camp. For some things “the cheaper the better” does not apply—this<br />
includes luxury cars. The paradox is that Geely has to reduce the cost of the Volvo, which<br />
is believed to be the root cause of the latter’s failure over the past decade—a failure that<br />
could not even be handled by Ford since it took over Volvo.<br />
Volvo’s failure in brand<br />
market strategy in <strong>China</strong><br />
would not be easily handled<br />
by Geely<br />
<strong>China</strong> <strong>Auto</strong> <strong>Sector</strong> 75
Initiate with UNDERPERFORM<br />
We initiate coverage on Geely with an UNDERPERFORM rating, as we believe it will<br />
continue to feel pain from: (1) intensifying completion in the low-end segment; (2)<br />
challenges over its multi-brand strategy; and (3) top-down competition from JVs’ mid- to<br />
low-end models and self-owned brands. Our target price for Geely is HK$3.50 per share<br />
based on 10x 2013E EPS. We believe Geely should be traded on par with the sector<br />
average given similar growth rate, which is around 10x 2013E P/E (Figure 150).<br />
08 January 2013<br />
Figure 150: Valuation comparison table<br />
Company (Local (USD m) P/E (x) P/B (x) Dividend yield % ROE (%)<br />
H-share automaker<br />
currency) 11 12E 13E 14E 11 12E 13E 14E 11 12E 13E 14E 11 12E 13E 14E<br />
Brilliance <strong>China</strong> <strong>Auto</strong> 1114.HK 10.58 6,089 19.7 14.8 12.1 9.9 7.6 5.7 4.3 3.3 - 0.0 0.1 0.3 27.2 29.4 28.6 26.6<br />
Dongfeng Motors 0489.HK 12.04 10,817 8.0 9.6 6.6 6.1 2.2 1.9 1.7 1.4 1.5 1.3 1.5 1.6 25.0 17.6 18.0 17.3<br />
Geely 0175.HK 4.08 3,381 16.1 12.9 11.0 9.1 2.6 2.3 1.9 1.7 0.7 0.9 1.1 1.3 18.6 17.1 17.6 17.3<br />
Great Wall Motor 2333.HK 25.35 10,105 16.3 12.7 10.9 9.5 3.8 3.0 2.5 2.1 1.4 1.9 2.1 2.4 25.6 24.9 23.3 21.6<br />
Guangzhou <strong>Auto</strong> 2238.HK 7.14 4,955 7.8 15.0 10.2 8.2 1.5 1.4 1.3 1.2 2.8 1.5 2.2 2.6 15.6 8.3 10.5 12.1<br />
Qingling Motors 1122.HK 2.05 599 11.1 11.7 10.2 9.9 0.6 0.6 0.6 0.6 7.1 6.4 6.9 7.0 4.9 4.6 5.1 5.5<br />
Sinotruk 3808.HK 6.2 1,632 11.1 29.4 13.9 10.1 0.8 0.8 0.8 0.8 1.6 1.1 1.4 1.6 5.4 2.8 3.8 5.0<br />
Weichai Power 2338.HK 35.8 8,295 10.1 14.8 12.3 11.0 2.6 2.0 1.8 1.6 0.3 0.6 0.6 0.7 27.0 14.0 14.6 14.3<br />
Mkt cap–wtd avg 12.5 13.5 10.3 8.9 3.2 2.6 2.1 1.8 1.2 1.2 1.4 1.6 23.3 18.4 18.4 17.8<br />
A-share automaker<br />
JAC 600418.SS 6.76 1,109 11.2 13.9 9.8 8.5 1.5 1.4 1.3 1.2 2.2 1.9 2.1 2.2 9.5 10.7 11.8<br />
Foton Motor 600166.SS 6.61 2,620 10.7 6.4 7.9 7.6 1.6 1.2 1.1 1.0 1.8 1.9 1.9 1.1 13.4 15.8 11.8 10.1<br />
DFAC 600006.SS 3 980 12.0 27.7 21.8 13.1 1.0 0.9 0.9 0.9 1.7 0.3 0.7 7.8 (0.1) 3.9 4.4<br />
Faw Car 000800.SZ 7.9 1,671 48.2 50.1 53.9 40.3 1.5 1.6 1.6 1.6 - 0.1 0.1 - 2.6 (4.0) 0.5 1.5<br />
HAIMA AUTO 000572.SZ 2.93 748 14.6 59.6 49.7 14.2 0.7 0.7 0.7 - 0.7 0.7<br />
SAIC Motor 600104.SS 17.59 28,317 7.4 8.2 6.5 5.9 1.9 1.6 1.4 1.3 1.7 2.4 3.0 3.3 22.7 18.1 16.3 15.2<br />
TJ FAW Xiali 000927.SZ 4.87 1,137 64.5 41.4 34.6 24.1 2.1 2.1 2.0 0.4 0.4 0.4 3.0<br />
Mkt cap–wtd avg 11.6 12.6 10.9 8.5 1.8 1.5 1.4 1.1 1.5 2.0 2.5 2.6 18.6 15.0 13.7 12.8<br />
Source: Bloomberg consensus<br />
Valuation comparison with Dongfeng Motors<br />
Figure 151: 12-month forward P/E band—GAC vs. DFM Figure 152: Geely’s P/E multiple premium to GAC<br />
22<br />
20<br />
18<br />
16<br />
14<br />
12<br />
10<br />
8<br />
6<br />
4<br />
2<br />
Jan-10 Aug-10 Mar-11 Oct-11 May-12 Jan-13<br />
Geely 12m forward P/E Dongfeng Motor 12m forward P/E<br />
Source: Bloomberg consensus Source: Bloomberg consensus<br />
Both Geely and Dongfeng Motors are major sedan producers in <strong>China</strong>. Since 2010, Geely<br />
has traded at an average premium of 32% to Dongfeng in terms of 12-month forward P/E<br />
-100%<br />
Jan-10 Aug-10 Mar-11 Oct-11 May-12 Jan-13<br />
<strong>China</strong> <strong>Auto</strong> <strong>Sector</strong> 76<br />
200%<br />
150%<br />
100%<br />
50%<br />
0%<br />
-50%<br />
Initiate with<br />
UNDERPERFORM and TP<br />
based on 10x 2013E EPS<br />
Geely 12m forward P/E discount average premium<br />
Valuation comparison with<br />
Dongfeng Motors
(Figure 152). Currently it trades at a 38% premium to Dongfeng. Geely has traded at an<br />
average 12-month forward P/E of about 9.7x since 2011, compared to Dongfeng's<br />
average P/E of 9.2x. It now trades at 11.6x 12-month forward P/E, versus Dongfeng’s 8.4x.<br />
We expect Geely’s 12-month forward P/E to gradually drop to the industrial average of<br />
around 10x.<br />
Valuation comparison with sector index<br />
Geely’s average P/E multiple discount over the MSCI <strong>China</strong> Consumer Discretionary<br />
Index is 28% for Jan 2010-Dec 2012, compared with Dongfeng’s average discount of 42%<br />
(Figure 154). Since January 2011, Geely has traded at an average discount of 33% over<br />
the MSCI <strong>China</strong> Consumer Discretionary Index (Figure 154). This compares with<br />
Dongfeng’s average discount of 36% during the same period (Figure 154). Given all<br />
Geely’s products are passenger vehicles, we believe it has a higher correlation with the<br />
Consumer Discretionary Index than Dongfeng. Therefore, it would be reasonable that<br />
Geely trades at the auto sector’s average P/E.<br />
Figure 153: Forward P/E band (DFM, GAC, MSCI <strong>China</strong> Consumer Discretionary Index)<br />
22<br />
20<br />
18<br />
16<br />
14<br />
12<br />
10<br />
8<br />
6<br />
4<br />
2<br />
Jan-10 Apr-10 Aug-10 Nov-10 Mar-11 Jul-11 Oct-11 Feb-12 May-12 Sep-12 Jan-13<br />
Source: Bloomberg consensus, MSCI<br />
Geely 12m forward P/E<br />
Dongfeng Motor 12m forward P/E<br />
MSCI <strong>China</strong> Consumer Discretionary Index 12m forward P/E<br />
Figure 154: P/E multiple discount to MSCI <strong>China</strong> Consumer Discretionary Index<br />
10%<br />
0%<br />
-10%<br />
-20%<br />
-30%<br />
-40%<br />
-50%<br />
-60%<br />
-70%<br />
-80%<br />
Jan-10 Apr-10 Aug-10 Nov-10 Mar-11 Jun-11 Oct-11 Jan-12 May-12 Aug-12 Dec-12<br />
Source: Bloomberg consensus, MSCI<br />
Dongfeng Motor 12m forward P/E discount Geely 12m forward P/E discount<br />
08 January 2013<br />
Valuation comparison with<br />
sector index<br />
<strong>China</strong> <strong>Auto</strong> <strong>Sector</strong> 77
Risks to our investment case<br />
Stronger-than-expected exports<br />
Geely’s export volume almost doubled in 2011 and has increased 260% YoY in the first 11<br />
months of 2012. It has maintained a strong upward trend of exports since August 2011,<br />
with its monthly export volume exceeding 10,000 units in June 2012 from around 4,000<br />
units in August 2011 (Figure 156). We also observed a strong growth in the share of its<br />
exports in its total sales, which exceeded 25% during Jun-Oct 2012 from around 10% in<br />
2011 (Figure 156). Geely’s export models mainly consist of low cost economy sedans.<br />
These small economy cars are widely affordable in its major export markets such as the<br />
Middle East, Eastern Europe, Southeast Asia, and Central America. We believe its export<br />
models will remain attractive to customers in these regions due to their low prices, leaving<br />
Geely with a relatively lower risk of being affected by economic changes during the global<br />
recovery.<br />
Figure 155: Geely's auto exports<br />
Unit<br />
100,000<br />
90,000<br />
80,000<br />
70,000<br />
60,000<br />
50,000<br />
40,000<br />
30,000<br />
20,000<br />
10,000<br />
-<br />
20,100<br />
37,940<br />
19,350<br />
20,555<br />
08 January 2013<br />
<strong>China</strong> <strong>Auto</strong> <strong>Sector</strong> 78<br />
39,600<br />
90,936<br />
2007 2008 2009 2010 2011 Jan-Nov 2012<br />
Source: Company data, Credit Suisse estimates<br />
Figure 156: Geely’s monthly auto exports<br />
14,000<br />
12,000<br />
10,000<br />
8,000<br />
6,000<br />
4,000<br />
2,000<br />
-<br />
2009-01 2009-06 2009-11 2010-04 2010-09 2011-02 2011-07 2011-12 2012-05 2012-10<br />
Source: Company data, Credit Suisse estimates<br />
Geely export (Unit) Export as % of Geely's sales<br />
40%<br />
35%<br />
30%<br />
25%<br />
20%<br />
15%<br />
10%<br />
5%<br />
0%<br />
Stronger-than-expected<br />
exports of Geely would<br />
boost its total sales
Although weakness in the US economy, and steps to curb bank lending and real estate<br />
investment in <strong>China</strong> still remain, major economies are already on track for a slow recovery.<br />
Particularly, we do not see any major changes in the trend whereby expansion in<br />
emerging Asia leads the world economy. Therefore, <strong>China</strong>'s exports should continue to<br />
grow, but we expect the pace of growth to be slow as global restocking of inventory runs<br />
its course. In Geely’s case, a stronger-than-expected export growth may favor its profit<br />
growth in absolute terms.<br />
Stronger-than-expected sales of Emgrand models<br />
In 11M12, sales of Geely’s Emgrand brand grew over 40% YoY, higher than its other sub<br />
brands (Figure 157). The low-to-mid end targeted Emgrand brand, has steadily increased its<br />
monthly sales volume to more than 14,000 units since September 2012 from around 10,700<br />
units in January 2012. We believe the low-to-mid end segment would have less margin erosion<br />
than the low-end segment in the near term, given less intensive competition. We estimate the<br />
company’s production capacity for Emgrand to be around 160,000 units, implying about 92.6%<br />
of utilization rate in 11M12. If it is able to promote Emgrand more successfully, it is likely that<br />
this model will achieve better-than-expected sales and contribute more to Geely’s blended<br />
margin.<br />
Figure 157: Geely’s sales by sub-brands<br />
20,000<br />
18,000<br />
16,000<br />
14,000<br />
12,000<br />
10,000<br />
8,000<br />
6,000<br />
4,000<br />
2,000<br />
0<br />
Jan Feb Mar Apr May Jun Jul Aug Sep Oct Nov<br />
2012 2012 2012 2012 2012 2012 2012 2012 2012 2012 2012<br />
Source: Geely, Credit Suisse estimates<br />
Englon sales (unit) Emgrand sales (unit) GLEagle sales (unit)<br />
Englon sales y-y Emgrand sales y-y GLEagle sales y-y<br />
08 January 2013<br />
<strong>China</strong> <strong>Auto</strong> <strong>Sector</strong> 79<br />
160%<br />
140%<br />
120%<br />
100%<br />
80%<br />
60%<br />
40%<br />
20%<br />
0%<br />
-20%<br />
-40%<br />
-60%<br />
Recovery of major<br />
economies would benefit<br />
Geely’s exports<br />
Stronger-than-expected<br />
sales of Emgrand brand<br />
may help to improve Geely’s<br />
blended margin
Rating (from Underperform) NEUTRAL*<br />
Price (04 Jan 13, HK$) 7.14<br />
Target price (HK$) (from 5.00) 6.50¹<br />
Upside/downside (%) -9.0<br />
Mkt cap (HK$ mn) 47,679 (US$ 6,152)<br />
Enterprise value (Rmb mn) 40,527<br />
Number of shares (mn) 6,435.02<br />
Free float (%) 38.9<br />
52-week price range 9.15 - 4.79<br />
ADTO - 6M (US$ mn) 5.2<br />
*Stock ratings are relative to the coverage universe in each<br />
analyst's or each team's respective sector.<br />
¹Target price is for 12 months.<br />
Share price performance<br />
Research Analysts<br />
Jack Yeung<br />
852 2101 6779<br />
jack.yeung@credit-suisse.com<br />
12<br />
10<br />
8<br />
6<br />
4<br />
Price (LHS) Rebased Rel (RHS)<br />
Jan-11 May-11 Sep-11 Jan-12 May-12 Sep-12<br />
The price relative chart measures performance against the<br />
MSCI CHINA F IDX which closed at 6652.07 on 04/01/13<br />
On 04/01/13 the spot exchange rate was HK$7.75/US$1<br />
120<br />
100<br />
80<br />
60<br />
40<br />
Performance over 1M 3M 12M<br />
Absolute (%) 9.7 47.2 9.0<br />
Relative (%) 2.4 30.4 -13.9<br />
08 January 2013<br />
Asia Pacific / <strong>China</strong><br />
<strong>Auto</strong>mobile Manufacturers<br />
Guangzhou <strong>Auto</strong>mobile Group<br />
(2238.HK / 2238 HK)<br />
Sluggish recovery in 2013<br />
■ Upgrade to NEUTRAL. We are upgrading Guangzhou <strong>Auto</strong> (GAC) to a<br />
NEUTRAL from Underperform, given its recovering sales since the end of<br />
October 2012. Therefore, we raise our 2013 earnings estimate for GAC by<br />
5.5%. Accordingly, our target price rises to HK$6.50 from HK$5.00 based on<br />
10x 2013E P/E (from previous 8x), which implies 9% potential downside.<br />
■ Recovering GAC Honda and GAC Toyota sales. Our recent channel<br />
checks have shown that retail sales of Honda and Toyota in Dec-12 have<br />
recovered to similar levels as in Dec-11. Their inventories have also dropped<br />
to around 1.5 months from 2.2-2.5 months in Oct-12. Accordingly, GAC’s<br />
total PV shipment recovered over 70% from its October low in November<br />
2012 and around 75-85% in December 2012. We believe the recovering<br />
sales will help GAC to regain market share mainly in 2H13.<br />
■ Lack of new models in 1H13. In 1H13 , GAC is likely to continue losing<br />
market share to other mid-to-high end players mainly due to lack of new<br />
models. GAC Toyota will only launch several facelifts of Camry and Yaris in<br />
2013. GAC Honda will launch a compact sedan Concept C in Jun-13 and the<br />
new-generation Accord in Sep-13. GAC Mitsubishi is likely to reach breakeven<br />
in 3Q13, with sales supports from AXS and its new SUV model, Pajero<br />
Sport (to be launched in 1H13). GAC Fiat will launch a hatchback model and<br />
an SUV in 2H13 but may continue its losses due to high start-up costs and<br />
low production volume. Moreover, we expect GAC’s self-owned brands to<br />
maintain weak sales in 2013, given their low utilisation rates, high capex and<br />
lack of new models.<br />
■ Valuation. We believe GAC should trade at 10x 2013E P/E (from 8x<br />
previously) on par with Chinese peers that trade at around 10x 2013E EPS.<br />
Financial and valuation metrics<br />
Year 12/11A 12/12E 12/13E 12/14E<br />
Revenue (Rmb mn) 10,984.3 11,285.9 13,231.1 14,821.7<br />
EBITDA (Rmb mn) 264.9 349.6 525.7 700.8<br />
EBIT (Rmb mn) -224.8 -331.2 -231.1 -159.8<br />
Net profit (Rmb mn) 4,271.7 1,789.1 3,362.5 3,777.9<br />
EPS (CS adj.) (Rmb) 0.69 0.28 0.52 0.59<br />
Change from previous EPS (%) n.a. 0 5.5 1.8<br />
Consensus EPS (Rmb) n.a. 0.36 0.53 0.66<br />
EPS growth (%) -24.4 -59.5 85.8 12.4<br />
P/E (x) 8.3 20.4 11.0 9.8<br />
Dividend yield (%) 3.6 0 2.7 3.1<br />
EV/EBITDA (x) 150.7 115.9 79.8 61.7<br />
P/B (x) 1.2 1.2 1.1 1.0<br />
ROE (%) 15.6 5.9 10.4 10.8<br />
Net debt/equity (%) 5.3 6.8 10.2 12.7<br />
Source: Company data, Thomson Reuters, Credit Suisse estimates.<br />
<strong>China</strong> <strong>Auto</strong> <strong>Sector</strong> 80
Sluggish recovery in 2013<br />
Recovering Honda and Toyota sales<br />
Our Dec-12 channel checks have shown that both Honda and Toyota retail recovered to<br />
their similar levels as in Dec-11. Their inventories dropped to 1.3-1.6 months from 2.2-2.5<br />
months in Oct-12 and 1.8-2.0 months in Nov-12. Supported by the retail recovery of these<br />
two Japanese brands, GAC’s total PV shipments recovered around 71% from its October<br />
low (Figure 159) and to 75-85% of its ordinary level in Dec-12. However, most of GAC’s<br />
new models will be launched in 2H13. Due to lack of new models in 1H13, it is likely to<br />
continue losing market share to other mid-to-high end players such as Volkswagen, GM,<br />
and Hyundai. It also faces competition from economy models launched by luxury brands.<br />
Figure 158: GAC PV sales YoY growth (%) Figure 159: GAC PV sales MoM growth (%)<br />
150%<br />
100%<br />
50%<br />
0%<br />
-50%<br />
-100%<br />
Jan-11 Mar-11 May-11 Jul-11 Sep-11 Nov-11<br />
GAC PV sales YoY GAC Honda sales YoY<br />
GAC Toyota sales YoY<br />
Source: Guangzhou <strong>Auto</strong> Source: Guangzhou <strong>Auto</strong><br />
08 January 2013<br />
<strong>China</strong> <strong>Auto</strong> <strong>Sector</strong> 81<br />
200%<br />
150%<br />
100%<br />
50%<br />
0%<br />
-50%<br />
-100%<br />
Mitsubishi and Fiat JVs: Struggling to breakeven<br />
Jan-11 Mar-11 May-11 Jul-11 Sep-11 Nov-11<br />
GAC PV sales MoM GAC Honda sales MoM<br />
GAC Toyota sales MoM<br />
GAC Mitsubishi is likely to reach breakeven in 3Q13, with supports from AXS and its new<br />
SUV model, Pajero Sport (to be launched in 1H13). GAC Fiat will launch a hatchback<br />
model will 1.4L engine and an SUV in 2H13. It also plans to localize Jeep in 2014 with<br />
phase I capacity of around 100,000 units. Due to high start-up costs and low production<br />
volume, GAC Fiat may continue losses in 2013. These two JVs will focus on SUVs in the<br />
next 3-5 years, which we expect will help GAC boost sales and improve its product mix.<br />
Self-owned brands<br />
Sales of GAC’s self-owned brand, Trumpche, were stronger than expected in 4Q12.<br />
However, it may continue losses in 2013 given the high depreciation and amortization<br />
expense. Due to low utilization rates, GAC’s other self-owned brands such as Changfeng<br />
and Gonow would maintain their low margins and are unlikely to become major profit<br />
drivers for the company.<br />
Upgrade to NEUTRAL<br />
We are upgrading GAC to a NEUTRAL from Underperform given its recovering sales<br />
since end-October. We expect its sales to continue recovering in 2013 and therefore raise<br />
our 2013 earnings estimate by 5.5%. Our target price increased to HK$6.50 from HK$5.00<br />
based on 10x 2013E EPS (from previous 8x). We believe GAC should trade on par with its<br />
Chinese peers, which are trading at around 10x 2013E EPS.<br />
Due to recovering sales of<br />
Japanese brands, we<br />
expect GAC’s sales to<br />
recover mainly in 2H13<br />
GAC Mitsubishi may<br />
achieve breakeven and<br />
GAC Fiat will continue to<br />
have losses in 2013<br />
GAC’s self-owned brand will<br />
continue to be its burden in<br />
2013<br />
Upgrade GAC to a<br />
NEUTRAL with a target<br />
price based on 10x 2013E<br />
EPS
Guangzhou <strong>Auto</strong>mobile Group 2238.HK / 2238 HK<br />
Price (04 Jan 13): HK$7.14, Rating:: NEUTRAL, Target Price: HK$6.50, Analyst: Jack Yeung<br />
Target price scenario<br />
Scenario TP %Up/Dwn Assumptions<br />
Upside 6.91 (3.22) 2013 auto sales: 866,000 units<br />
Central Case 6.50 (8.96) 2013 auto sales:816,000 units<br />
Downside 5.71 (20.03) 2013 auto sales: 716,000 units<br />
Income statement (Rmb mn) 12/11A 12/12E 12/13E 12/14E<br />
Sales revenue 10,984 11,286 13,231 14,822<br />
Cost of goods sold 10,560 10,771 12,430 13,840<br />
SG&A 1,806 1,862 2,157 2,327<br />
Other operating exp./(inc.) (1,646) (1,697) (1,881) (2,046)<br />
EBITDA 264.9 349.6 525.7 700.8<br />
Depreciation & amortisation 489.7 680.8 756.8 860.5<br />
EBIT (224.8) (331.2) (231.1) (159.8)<br />
Net interest expense/(inc.) 356.9 420.2 404.0 433.9<br />
Non-operating inc./(exp.) — — — —<br />
Associates/JV 4,639 2,422 4,607 5,246<br />
Recurring PBT 4,057 1,670 3,972 4,653<br />
Exceptionals/extraordinaries — — — —<br />
Taxes (109.9) (41.8) (79.4) (69.8)<br />
Profit after tax 4,167 1,712 4,051 4,722<br />
Other after tax income (1.1) — — —<br />
Minority interests (104.8) (77.0) 688.7 944.5<br />
Preferred dividends — — — —<br />
Reported net profit 4,271 1,789 3,362 3,778<br />
Analyst adjustments 1.1 — — —<br />
Net profit (Credit Suisse) 4,272 1,789 3,362 3,778<br />
Cash flow (Rmb mn) 12/11A 12/12E 12/13E 12/14E<br />
EBIT (224.8) (331.2) (231.1) (159.8)<br />
Net interest (92.8) (248.2) (188.9) (218.8)<br />
Tax paid (80.8) 41.8 79.4 69.8<br />
Working capital (422.0) 158.6 495.7 486.4<br />
Other cash & non-cash items 187.1 418.0 541.7 645.4<br />
Operating cash flow (633.2) 39.0 696.8 823.1<br />
Capex (2,244) (1,808) (2,170) (2,288)<br />
Free cash flow to the firm (2,877) (1,769) (1,473) (1,464)<br />
Disposals of fixed assets — — — —<br />
Acquisitions (683.1) — — —<br />
Divestments 90.2 43.1 53.4 66.3<br />
Associate investments (55.7) (51.0) (54.6) (56.6)<br />
Other investment/(outflows) 2,625 891 1,071 1,261<br />
Investing cash flow (267) (925) (1,100) (1,017)<br />
Equity raised 279.1 287.0 — —<br />
Dividends paid — — (1,009) (1,133)<br />
Net borrowings 429.4 650.0 650.0 650.0<br />
Other financing cash flow (909.9) — — —<br />
Financing cash flow (201.4) 937.0 (358.7) (483.4)<br />
Total cash flow (1,102) 51 (762) (678)<br />
Adjustments (41.4) — — —<br />
Net change in cash (1,143) 51 (762) (678)<br />
Balance sheet (Rmb mn) 12/11A 12/12E 12/13E 12/14E<br />
Cash & cash equivalents 8,239 8,290 7,529 6,851<br />
Current receivables 2,980 3,741 4,459 5,563<br />
Inventories 1,537 1,564 1,703 1,896<br />
Other current assets 8,903 8,903 8,903 8,903<br />
Current assets 21,659 22,499 22,593 23,213<br />
Property, plant & equip. 4,309 5,343 6,625 7,884<br />
Investments 14,484 16,066 19,656 23,698<br />
Intangibles 2,273 2,022 1,800 1,602<br />
Other non-current assets 1,887 2,187 2,487 2,787<br />
Total assets 44,612 48,117 53,161 59,184<br />
Accounts payable 4,069 5,016 6,368 8,152<br />
Short-term debt 2,100 2,500 2,900 3,300<br />
Current provisions 3.5 3.5 3.5 3.5<br />
Other current liabilities 33.8 33.8 33.8 33.8<br />
Current liabilities 6,206 7,554 9,306 11,490<br />
Long-term debt 7,737 7,987 8,237 8,487<br />
Non-current provisions — — — —<br />
Other non-current liab. 482.7 391.9 391.9 391.9<br />
Total liabilities 14,426 15,933 17,935 20,369<br />
Shareholders' equity 29,210 31,285 33,638 36,283<br />
Minority interests 976 899 1,588 2,532<br />
Total liabilities & equity 44,612 48,117 53,161 59,184<br />
08 January 2013<br />
Key earnings drivers 12/11A 12/12E 12/13E 12/14E<br />
<strong>Auto</strong> Sales (Unit) 723,388 640,472 816,058 918,023<br />
— — — —<br />
— — — —<br />
— — — —<br />
Per share data<br />
—<br />
12/11A<br />
—<br />
12/12E<br />
—<br />
12/13E<br />
—<br />
12/14E<br />
Shares (wtd avg.) (mn) 6,148 6,363 6,435 6,435<br />
EPS (Credit Suisse)<br />
0.69 0.28 0.52 0.59<br />
(Rmb) DPS (Rmb) 0.21 — 0.16 0.18<br />
BVPS (Rmb) 4.75 4.86 5.23 5.64<br />
Operating CFPS (Rmb) (0.10) 0.01 0.11 0.13<br />
Key ratios and valuation 12/11A 12/12E 12/13E 12/14E<br />
Growth(%)<br />
Sales revenue 25.6 2.7 17.2 12.0<br />
EBIT (233) (47) 30 31<br />
Net profit (0.5) (58.1) 87.9 12.4<br />
EPS (24.4) (59.5) 85.8 12.4<br />
Margins (%)<br />
EBITDA 2.41 3.10 3.97 4.73<br />
EBIT (2.05) (2.93) (1.75) (1.08)<br />
Pre-tax profit 36.9 14.8 30.0 31.4<br />
Net profit 38.9 15.9 25.4 25.5<br />
Valuation metrics (x)<br />
P/E 8.3 20.4 11.0 9.8<br />
P/B 1.21 1.18 1.10 1.02<br />
Dividend yield (%) 3.65 — 2.73 3.07<br />
P/CF (56) 936 53 45<br />
EV/sales 3.64 3.59 3.17 2.92<br />
EV/EBITDA 151 116 80 62<br />
EV/EBIT (178) (122) (181) (271)<br />
ROE analysis (%)<br />
ROE 15.6 5.9 10.4 10.8<br />
ROIC (0.81) (1.03) (0.64) (0.39)<br />
Asset turnover (x) 0.25 0.23 0.25 0.25<br />
Interest burden (x) (18.0) (5.0) (17.2) (29.1)<br />
Tax burden (x) 1.03 1.03 1.02 1.02<br />
Financial leverage (x) 1.48 1.50 1.51 1.52<br />
Credit ratios<br />
Net debt/equity (%) 5.3 6.8 10.2 12.7<br />
Net debt/EBITDA (x) 6.03 6.28 6.87 7.04<br />
Interest cover (x) (0.63) (0.79) (0.57) (0.37)<br />
Source: Company data, Thomson Reuters, Credit Suisse estimates.<br />
0<br />
Sep-10 Mar-11 Sep-11 Mar-12 Sep-12<br />
<strong>China</strong> <strong>Auto</strong> <strong>Sector</strong> 82<br />
14<br />
12<br />
10<br />
8<br />
6<br />
4<br />
2<br />
3.5<br />
3.0<br />
2.5<br />
2.0<br />
1.5<br />
1.0<br />
0.5<br />
12MF P/E multiple<br />
12MF P/B multiple<br />
0.0<br />
Sep-10 Mar-11 Sep-11 Mar-12 Sep-12<br />
Source: IBES
Rating OUTPERFORM*<br />
Price (04 Jan 13, HK$) 12.04<br />
Target price (HK$) 14.00¹<br />
Upside/downside (%) 16.3<br />
Mkt cap (HK$ mn) 103,738 (US$13,386 mn)<br />
Enterprise value (Rmb mn) 60,006<br />
Number of shares (mn) 8,616.12<br />
Free float (%) 33.1<br />
52-week price range 15.68–8.64<br />
ADTO - 6M (US$ mn) 33.5<br />
*Stock ratings are relative to the coverage universe in each<br />
analyst's or each team's respective sector.<br />
¹Target price is for 12 months.<br />
Share price performance<br />
18<br />
13<br />
Research Analysts<br />
Jack Yeung<br />
852 2101 6779<br />
jack.yeung@credit-suisse.com<br />
Price (LHS) Rebased Rel (RHS)<br />
8<br />
Jan-11 May-11 Sep-11 Jan-12 May-12 Sep-12<br />
The price relative chart measures performance against the<br />
MSCI CHINA F IDX which closed at 6652.07 on 04/01/13<br />
On 04/01/13 the spot exchange rate was HK$7.75/US$1<br />
140<br />
120<br />
100<br />
80<br />
60<br />
Performance over 1M 3M 12M<br />
Absolute (%) 2.7 32.0 -9.2<br />
Relative (%) -4.6 15.2 -32.1<br />
08 January 2013<br />
Asia Pacific / <strong>China</strong><br />
<strong>Auto</strong>mobile Manufacturers<br />
Dongfeng Motors Group Co Ltd<br />
(0489.HK / 489 HK)<br />
Solid growth remains<br />
■ Maintain OUTPERFORM. We maintain an OUTPERFORM rating on<br />
Dongfeng Motors as we believe it will benefit from recovering Japanese auto<br />
sales and strong SUV demand in <strong>China</strong>. Our target price for Dongfeng<br />
remains HK$14.00, which implies 16.3% potential upside.<br />
■ Recovering DF Nissan and DF Honda sales. Dongfeng’s PV shipments<br />
recovered 29% MoM in Nov-12, while DF Nissan shipments recovered 72%<br />
MoM and DF Honda shipment recovered 119% MoM. Our channel checks<br />
have shown that inventories for both DF Nissan and DF Honda are currently<br />
lower than one month. The company’s solid sales recovery is in line with our<br />
expectation. With new model launches and continuing strong SUV demand,<br />
we believe Dongfeng will stage a strong recovery in 2013.<br />
■ New models to gain market share. We believe DF Nissan’s newgeneration<br />
Teana to be launched in Mar-13 will be the key driver of its sales.<br />
Moreover, Dongfeng’s major JVs are going to launch more economy models<br />
such as compact sedans and compact MPVs in 2013. These models have<br />
competitive prices and good brand image, which we believe will help<br />
Dongfeng to boost sales and regain market share in 2013.<br />
Figure 160: Launch time of Dongfeng Motors’ new models in 2013<br />
Models Jan Feb Mar Apr May Jun Jul Aug Sep<br />
New Teana Mar 2013<br />
New Livina Sep 2013<br />
New economy sedan under Venucia Mid-2013<br />
A compact MPV under DF Honda Sep 2013<br />
Peugeot 3008 Early 2013<br />
Compact sedan under Peugeot Early 2013<br />
Compact sedan under Citroen Early 2013<br />
Source: Dongfeng Motors<br />
■ Valuation. We value Dongfeng based on 9x 2013E P/E. We believe it<br />
should trade on par with domestic peers, which trade at 9-10x 2013E EPS.<br />
Financial and valuation metrics<br />
Year 12/11A 12/12E 12/13E 12/14E<br />
Revenue (Rmb mn) 131,441.0 122,036.0 145,191.1 161,908.5<br />
EBITDA (Rmb mn) 17,498.0 16,168.9 19,955.8 21,741.2<br />
EBIT (Rmb mn) 14,384.0 11,381.1 14,825.5 16,337.0<br />
Net profit (Rmb mn) 10,481.0 8,077.3 10,650.5 11,769.0<br />
EPS (CS adj.) (Rmb) 1.22 0.94 1.24 1.37<br />
Change from previous EPS (%) n.a. 0 0 0<br />
Consensus EPS (Rmb) n.a. 1.02 1.14 1.24<br />
EPS growth (%) -4.6 -22.9 31.9 10.5<br />
P/E (x) 8.0 10.3 7.8 7.1<br />
Dividend yield (%) 1.9 1.4 1.9 2.1<br />
EV/EBITDA (x) 3.5 3.7 2.7 2.1<br />
P/B (x) 1.9 1.6 1.4 1.2<br />
ROE (%) 25.9 16.7 18.9 17.9<br />
Net debt/equity (%) Net cash Net cash Net cash Net cash<br />
Source: Company data, Thomson Reuters, Credit Suisse estimates.<br />
<strong>China</strong> <strong>Auto</strong> <strong>Sector</strong> 83
Solid growth remains<br />
Recovery of DF Nissan and DF Honda sales<br />
Dongfeng’s PV shipment recovered 29% MoM in Nov-12 (Figure 162). Among these, DF<br />
Nissan shipments recovered 72% MoM and DF Honda shipments 119% MoM (Figure 162).<br />
Through our channel checks, inventories for both DF Nissan and Honda are currently<br />
lower than one month. The company’s solid sales recovery is in line with our expectation.<br />
With new Teana to be launched in Mar-13 and continuing strong SUV demand, we believe<br />
Dongfeng will stage a strong recovery in 2013.<br />
Figure 161: Dongfeng PV sales YoY growth (%) Figure 162: Dongfeng PV sales MoM growth (%)<br />
200%<br />
150%<br />
100%<br />
50%<br />
0%<br />
-50%<br />
-100%<br />
Jan-12 Mar-12 May-12 Jul-12 Sep-12 Nov-12<br />
Dongfeng Motors PV sales YoY DF Nissan PV sales YoY<br />
DF Honda PV sales YoY<br />
08 January 2013<br />
<strong>China</strong> <strong>Auto</strong> <strong>Sector</strong> 84<br />
140%<br />
120%<br />
100%<br />
80%<br />
60%<br />
40%<br />
20%<br />
0%<br />
-20%<br />
-40%<br />
-60%<br />
Jan-12 Mar-12 May-12 Jul-12 Sep-12 Nov-12<br />
Dongfeng Motors PV sales MoM DF Nissan PV sales MoM<br />
DF Honda PV sales MoM<br />
Source: Dongfeng Motors Source: Dongfeng Motors<br />
New models to gain market share<br />
We believe DF Nissan’s new-generation Teana, to be launched in Mar-13, will be the key<br />
driver of its sales. Moreover, Dongfeng’s major JVs are going to launch more economy<br />
models such as compact sedans and compact MPVs in 2013. These models have<br />
competitive prices and a good brand image, which we believe will help DFM to boost sales<br />
and gain market share in 2013.<br />
Figure 163: Launch time of Dongfeng Motors’ new models in 2013<br />
Models Jan Feb Mar Apr May Jun Jul Aug Sep Oct Nov Dec<br />
New Teana Mar 2013<br />
New Livina Sep 2013<br />
New economy sedan under Venucia Mid-2013<br />
A compact MPV under DF Honda Sep 2013<br />
Peugeot 3008 Early 2013<br />
Compact sedan under Peugeot Early 2013<br />
Compact sedan under Citroen Early 2013<br />
Source: Dongfeng Motors<br />
Maintain OUTPERFORM<br />
We maintain our OUTPERFORM rating on Dongfeng Motors as we believe it will benefit<br />
from recovering Japanese auto sales and strong SUV demand in <strong>China</strong>. Our target price<br />
for Dongfeng Motors remains HK$14.00 based on 9x 2013E EPS. We believe it should<br />
trade on par with its domestic peers, which are trading at 9-10x 2013E EPS.<br />
We believe Dongfeng<br />
Motors will have a strong<br />
recovery in 2013 mainly due<br />
to new models from DF<br />
Nissan and strong SUV<br />
demand.<br />
Dongfeng is planning to<br />
launch several new models<br />
throughout 2013, which we<br />
believe will help it regain<br />
market share<br />
Maintain OUTPERFORM<br />
with a TP based on 9x<br />
2013E EPS
Dongfeng Motors Group Co Ltd 0489.HK / 489 HK<br />
Price (04 Jan 13): HK$12.04, Rating:: OUTPERFORM, Target Price: HK$14.00, Analyst: Jack Yeung<br />
Target price scenario<br />
Scenario TP %Up/Dwn Assumptions<br />
Upside 14.52 20.56 2013E sales: 2.55m units<br />
Central Case 14.00 16.28 2013E sales: 2.5m units<br />
Downside 13.45 11.67 2013E sales: 2.45m units<br />
Income statement (Rmb mn) 12/11A 12/12E 12/13E 12/14E<br />
Sales revenue 131,441 122,036 145,191 161,908<br />
Cost of goods sold 105,051 98,939 117,008 130,676<br />
SG&A 9,916 9,763 11,035 12,305<br />
Other operating exp./(inc.) (1,024) (2,835) (2,807) (2,814)<br />
EBITDA 17,498 16,169 19,956 21,741<br />
Depreciation & amortisation 3,114 4,788 5,130 5,404<br />
EBIT 14,384 11,381 14,826 16,337<br />
Net interest expense/(inc.) 402.0 528.8 468.8 476.9<br />
Non-operating inc./(exp.) — — — —<br />
Associates/JV 379.0 366.1 435.6 485.7<br />
Recurring PBT 14,361 11,218 14,792 16,346<br />
Exceptionals/extraordinaries — — — —<br />
Taxes 3,401 2,805 3,698 4,086<br />
Profit after tax 10,960 8,414 11,094 12,259<br />
Other after tax income — — — —<br />
Minority interests 479.0 336.6 443.8 490.4<br />
Preferred dividends — — — —<br />
Reported net profit 10,481 8,077 10,650 11,769<br />
Analyst adjustments — — — —<br />
Net profit (Credit Suisse) 10,481 8,077 10,650 11,769<br />
Cash flow (Rmb mn) 12/11A 12/12E 12/13E 12/14E<br />
EBIT 14,384 11,381 14,826 16,337<br />
Net interest 621.0 455.7 511.8 630.0<br />
Tax paid (4,315) (2,805) (3,698) (4,086)<br />
Working capital (2,505) (3,946) (1,308) (1,493)<br />
Other cash & non-cash items 2,024 3,788 4,108 4,187<br />
Operating cash flow 10,209 8,874 14,439 15,574<br />
Capex (6,542) (6,500) (6,500) (6,500)<br />
Free cash flow to the firm 3,667 2,374 7,939 9,074<br />
Disposals of fixed assets — — — —<br />
Acquisitions (16.0) — — —<br />
Divestments 1,393 — — —<br />
Associate investments (159.0) — — —<br />
Other investment/(outflows) 3,796 — — —<br />
Investing cash flow (1,528) (6,500) (6,500) (6,500)<br />
Equity raised — — — —<br />
Dividends paid (2,644) (1,551) (1,195) (1,576)<br />
Net borrowings (701) (1,000) (1,000) (1,000)<br />
Other financing cash flow 156.0 — — —<br />
Financing cash flow (3,189) (2,551) (2,195) (2,576)<br />
Total cash flow 5,492 (177) 5,744 6,498<br />
Adjustments — — — —<br />
Net change in cash 5,492 (177) 5,744 6,498<br />
Balance sheet (Rmb mn) 12/11A 12/12E 12/13E 12/14E<br />
Cash & cash equivalents 31,381 31,204 36,948 43,447<br />
Current receivables 25,306 30,091 34,806 39,035<br />
Inventories 12,511 14,095 14,426 15,037<br />
Other current assets 14,818 14,818 14,818 14,818<br />
Current assets 84,016 90,209 100,998 112,337<br />
Property, plant & equip. 21,578 23,262 24,610 25,688<br />
Investments 4,581 4,963 5,439 6,035<br />
Intangibles 3,001 3,029 3,051 3,069<br />
Other non-current assets 4,357 4,357 4,357 4,357<br />
Total assets 117,533 125,820 138,455 151,486<br />
Accounts payable 53,145 55,569 59,305 62,653<br />
Short-term debt 5,993 5,493 4,993 4,493<br />
Current provisions — — — —<br />
Other current liabilities 5,577 5,577 5,577 5,577<br />
Current liabilities 64,715 66,639 69,875 72,723<br />
Long-term debt 2,820 2,320 1,820 1,320<br />
Non-current provisions — — — —<br />
Other non-current liab. 414.0 414.0 414.0 414.0<br />
Total liabilities 67,949 69,373 72,109 74,457<br />
Shareholders' equity 44,843 51,725 60,799 70,827<br />
Minority interests 3,190 3,527 3,970 4,461<br />
Total liabilities & equity 117,533 125,820 138,455 151,486<br />
08 January 2013<br />
Key earnings drivers 12/11A 12/12E 12/13E 12/14E<br />
Sales volume (unit) 2,162,92 2,078,49 2,501,97 2,814,60<br />
— 4 — 7 — 9 — 3<br />
— — — —<br />
— — — —<br />
Per share data<br />
—<br />
12/11A<br />
—<br />
12/12E<br />
—<br />
12/13E<br />
—<br />
12/14E<br />
Shares (wtd avg.) (mn) 8,616 8,616 8,616 8,616<br />
EPS (Credit Suisse)<br />
1.22 0.94 1.24 1.37<br />
(Rmb) DPS (Rmb) 0.18 0.14 0.18 0.20<br />
BVPS (Rmb) 5.20 6.00 7.06 8.22<br />
Operating CFPS (Rmb) 1.18 1.03 1.68 1.81<br />
Key ratios and valuation<br />
Growth(%)<br />
12/11A 12/12E 12/13E 12/14E<br />
Sales revenue 7.4 (7.2) 19.0 11.5<br />
EBIT (0.9) (20.9) 30.3 10.2<br />
Net profit (4.6) (22.9) 31.9 10.5<br />
EPS<br />
Margins (%)<br />
(4.6) (22.9) 31.9 10.5<br />
EBITDA 13.3 13.2 13.7 13.4<br />
EBIT 10.9 9.3 10.2 10.1<br />
Pre-tax profit 10.9 9.2 10.2 10.1<br />
Net profit<br />
Valuation metrics (x)<br />
7.97 6.62 7.34 7.27<br />
P/E 8.0 10.3 7.8 7.1<br />
P/B 1.86 1.61 1.37 1.18<br />
Dividend yield (%) 1.86 1.43 1.89 2.09<br />
P/CF 8.2 9.4 5.8 5.4<br />
EV/sales 0.46 0.49 0.37 0.28<br />
EV/EBITDA 3.48 3.71 2.67 2.10<br />
EV/EBIT<br />
ROE analysis (%)<br />
4.23 5.27 3.59 2.80<br />
ROE 25.9 16.7 18.9 17.9<br />
ROIC 42.2 28.4 32.1 32.4<br />
Asset turnover (x) 1.12 0.97 1.05 1.07<br />
Interest burden (x) 1.00 0.99 1.00 1.00<br />
Tax burden (x) 0.76 0.75 0.75 0.75<br />
Financial leverage (x)<br />
Credit ratios<br />
2.37 2.23 2.09 1.97<br />
Net debt/equity (%) (45.5) (41.4) (45.4) (48.9)<br />
Net debt/EBITDA (x) (1.29) (1.45) (1.51) (1.73)<br />
Interest cover (x) 35.8 21.5 31.6 34.3<br />
Source: Company data, Thomson Reuters, Credit Suisse estimates.<br />
12MF P/E multiple<br />
20<br />
18<br />
16<br />
14<br />
12<br />
10<br />
8<br />
6<br />
4<br />
2<br />
0<br />
2008 2009 2010 2011 2012 2013<br />
0.0<br />
2008 2009 2010 2011 2012 2013<br />
<strong>China</strong> <strong>Auto</strong> <strong>Sector</strong> 85<br />
3.5<br />
3.0<br />
2.5<br />
2.0<br />
1.5<br />
1.0<br />
0.5<br />
Source: IBES<br />
12MF P/B multiple
Rating OUTPERFORM* [V]<br />
Price (04 Jan 13, HK$) 10.58<br />
Target price (HK$) (from 11.00) 12.00¹<br />
Upside/downside (%) 13.4<br />
Mkt cap (HK$ mn) 53,173 (US$ 6,860)<br />
Enterprise value (Rmb mn) 43,668<br />
Number of shares (mn) 5,025.77<br />
Free float (%) 27.3<br />
52-week price range 10.58 - 6.29<br />
ADTO - 6M (US$ mn) 17.6<br />
*Stock ratings are relative to the coverage universe in each<br />
analyst's or each team's respective sector.<br />
¹Target price is for 12 months.<br />
[V] = Stock considered volatile (see Disclosure Appendix).<br />
Share price performance<br />
Research Analysts<br />
Jack Yeung<br />
852 2101 6779<br />
jack.yeung@credit-suisse.com<br />
12<br />
10<br />
8<br />
6<br />
4<br />
Price (LHS) Rebased Rel (RHS)<br />
Jan-11 May-11 Sep-11 Jan-12 May-12 Sep-12<br />
The price relative chart measures performance against the<br />
MSCI CHINA F IDX which closed at 6647.58 on 07/01/13<br />
On 07/01/13 the spot exchange rate was HK$7.75/US$1<br />
400<br />
300<br />
200<br />
100<br />
0<br />
Performance over 1M 3M 12M<br />
Absolute (%) 15.0 19.8 26.6<br />
Relative (%) 7.8 3.1 3.7<br />
08 January 2013<br />
Asia Pacific / <strong>China</strong><br />
<strong>Auto</strong>mobile Manufacturers<br />
Brilliance <strong>China</strong> <strong>Auto</strong>motive<br />
Holding (1114.HK / 1114 HK)<br />
Growing brilliantly!<br />
■ MAINTAIN OUTPERFORM. We maintain our OUTPERFORM rating on<br />
Brilliance given BMW’s strong position in <strong>China</strong>’s luxury segment and<br />
growing demand for luxury autos. Therefore, we raise our 2013 earnings<br />
estimate for Brilliance by 1%. Our target price increases to HK$12.00 from<br />
HK$11.00, implying 13.4% potential upside.<br />
■ Rising wealth to enhance luxury auto sales. The number of millionaires in<br />
<strong>China</strong> is growing significantly: the figure more than tripled during 2005-12. In<br />
this scenario, we estimate the luxury auto segment will grow 15-25% YoY,<br />
compared to around 10% YoY growth for the overall passenger vehicle<br />
sector. <strong>China</strong> has already become BMW’s largest market. We believe strong<br />
income growth in <strong>China</strong> will drive luxury auto sales, and BMW Brilliance will<br />
be a major beneficiary.<br />
■ New models to boost BMW sales. BMW Brilliance launched X1 last March<br />
and the new 3 series last July. It also plans to launch a new-energy model<br />
under its self-owned brand in Apr-2013 and probably a simplified BMW new<br />
3 series below Rmb300,000 in 2013. The new 3 series LWB version is<br />
expected to ramp up quickly, similar as the new 5 series LWB version when<br />
it was launched in Aug-2010. We believe the new 3 series will boost<br />
Brilliance’s 2013 sales and enhance its strong position in <strong>China</strong>’s luxury auto<br />
sector. BMW currently has 24% share in <strong>China</strong>’s luxury market, ranked No.2<br />
just after Audi. We expect its market share to rise to 27% in 2015 and<br />
overtake Audi to become the largest luxury brand in <strong>China</strong> by 2015.<br />
■ Valuation. Our TP for Brilliance is based on 14x 2013E P/E (from previous<br />
13x). We believe it should trade on par with Chinese luxury goods, which are<br />
trading at around 14-15x 2013E EPS.<br />
Financial and valuation metrics<br />
Year 12/11A 12/12E 12/13E 12/14E<br />
Revenue (Rmb mn) 6,442.9 5,787.5 6,317.3 6,835.9<br />
EBITDA (Rmb mn) 292.5 267.8 286.9 306.0<br />
EBIT (Rmb mn) 154.9 134.6 140.6 145.3<br />
Net profit (Rmb mn) 1,812.3 2,537.2 3,442.7 4,441.9<br />
EPS (CS adj.) (Rmb) 0.36 0.51 0.69 0.88<br />
Change from previous EPS (%) n.a. 0.1 0.7 4.2<br />
Consensus EPS (Rmb) n.a. 0.48 0.62 0.76<br />
EPS growth (%) 42.5 39.4 35.6 29.0<br />
P/E (x) 23.4 16.8 12.4 9.6<br />
Dividend yield (%) 0 0 0 0<br />
EV/EBITDA (x) 148.5 163.1 153.7 145.7<br />
P/B (x) 6.1 4.5 3.3 2.5<br />
ROE (%) 27.2 30.7 30.6 29.2<br />
Net debt/equity (%) 11.4 10.6 11.0 10.9<br />
Source: Company data, Thomson Reuters, Credit Suisse estimates.<br />
<strong>China</strong> <strong>Auto</strong> <strong>Sector</strong> 86
Growing brilliantly!<br />
Expanding market share of BMW<br />
Brilliance is the only Chinese automaker having a JV with BMW and its JV is the second<br />
largest among luxury automakers in <strong>China</strong> after FAW Audi. BMW currently has around<br />
24% share in <strong>China</strong>’s luxury market, ranked No.2 just after Audi. We expect its market<br />
share to increase to 27% in 2015 and overtake Audi to become the largest luxury brand in<br />
<strong>China</strong> by 2015. BMW Brilliance launched X1 last March and new 3 series last July. Its<br />
monthly sales have generally maintained over 50% YoY growth throughout the year<br />
(Figure 164). The new 3 series LWB version is likely to ramp up quickly, similar to the new<br />
5 series LWB version launched in Aug-2010 (Figure 165). We believe this will boost<br />
Brilliance’s sales and enhance its leading position in <strong>China</strong>’s luxury auto sector.<br />
08 January 2013<br />
Figure 164: BMW Brilliance’s sales YoY growth Figure 165: Sales ramp-up of new 3 series LWB version<br />
150%<br />
100%<br />
50%<br />
0%<br />
Jan-12 Mar-12 May-12 Jul-12 Sep-12 Nov-12<br />
-50%<br />
-100%<br />
-150%<br />
Brilliance BMW sales YoY<br />
Brilliance made 3 series and new 3 series sales YoY<br />
Brilliance made 5 series sales YoY<br />
vs. new 5 series LWB version<br />
<strong>China</strong> <strong>Auto</strong> <strong>Sector</strong> 87<br />
Unit<br />
7,000<br />
Source: Brilliance Source: Brilliance<br />
Rising wealth to enhance auto sales<br />
The number of millionaires in <strong>China</strong> is growing significantly: the number more than tripled<br />
during 2005-12. In this scenario, we estimate the luxury auto segment will grow 15-25%<br />
YoY, compared to around 10% YoY growth for the overall passenger vehicle sector. <strong>China</strong><br />
has already become BMW’s largest market. We believe strong income growth in <strong>China</strong> will<br />
drive luxury auto sales, and BMW Brilliance will be a major beneficiary.<br />
6,000<br />
5,000<br />
4,000<br />
3,000<br />
2,000<br />
1,000<br />
<strong>China</strong> auto sector: Top-down competition<br />
Many luxury brands have launched their economy models with prices close to those for<br />
mid- to high-end vehicles. We believe the top-down movement of <strong>China</strong>’s passenger<br />
vehicle segment will continue in the next few years and help BMW Brilliance to gain<br />
market share from mid-to-high end JV brands.<br />
Maintain OUTPERFORM<br />
We maintain our OUTPERFORM rating on Brilliance, given its strong position in <strong>China</strong>’s<br />
luxury segment and growing demand for luxury autos. We raise our 2013 earnings<br />
estimate for Brilliance by 1% as we believe BMW’s marketing share wil continue to grow in<br />
2013. Our TP increases to HK$12.00 from HK$11.00, based on 14x 2013E EPS (from<br />
previous 13x). We believe the stock should trade on par with Chinese luxury goods, which<br />
are trading at around 14-15x 2013E EPS.<br />
-<br />
We believe Brilliance will<br />
continue to benefit from<br />
strong luxury auto demand<br />
and BMW’s rising market<br />
share<br />
No. of months after launch<br />
1st 2nd 3rd 4th 5th 6th<br />
BMW new 3 series LWB version BMW new 5 series LWB version<br />
Strong income growth in<br />
<strong>China</strong> will drive luxury auto<br />
sales, and BMW Brilliance<br />
will be a major beneficiary<br />
Luxury auto brands’<br />
economy brands will help<br />
them to expand market<br />
share<br />
Maintain an OUTPERFORM<br />
with target price based on<br />
14x 2013E EPS
Brilliance <strong>China</strong> <strong>Auto</strong>motive Holding 1114.HK / 1114 HK<br />
Price (04 Jan 13): HK$10.58, Rating: OUTPERFORM [V], Target Price: HK$12.00, Analyst: Jack Yeung<br />
Target price scenario<br />
Scenario TP %Up/Dwn Assumptions<br />
Upside 13.91 31.47 BMW sales reach 292,000 units in 2013<br />
Central Case 12.00 13.42 BMW sales reach 252,000 units in 2013<br />
Downside 10.12 (4.35) BMW sales reach 212,000 units in 2013<br />
Income statement (Rmb mn) 12/11A 12/12E 12/13E 12/14E<br />
Sales revenue 6,443 5,787 6,317 6,836<br />
Cost of goods sold 5,587 5,024 5,490 5,947<br />
SG&A 748.7 672.5 734.1 794.3<br />
Other operating exp./(inc.) (185.6) (176.3) (193.4) (211.7)<br />
EBITDA 292.5 267.8 286.9 306.0<br />
Depreciation & amortisation 137.6 133.2 146.3 160.7<br />
EBIT 154.9 134.6 140.6 145.3<br />
Net interest expense/(inc.) 117.4 118.5 141.1 176.9<br />
Non-operating inc./(exp.) — — — —<br />
Associates/JV 1,912 2,831 4,083 5,300<br />
Recurring PBT 1,949 2,847 4,083 5,268<br />
Exceptionals/extraordinaries — — — —<br />
Taxes 58.0 199.3 490.0 632.2<br />
Profit after tax 1,891 2,648 3,593 4,636<br />
Other after tax income — — — —<br />
Minority interests 79.1 110.8 150.3 193.9<br />
Preferred dividends — — — —<br />
Reported net profit 1,812 2,537 3,443 4,442<br />
Analyst adjustments — — — —<br />
Net profit (Credit Suisse) 1,812 2,537 3,443 4,442<br />
Cash flow (Rmb mn) 12/11A 12/12E 12/13E 12/14E<br />
EBIT 154.9 134.6 140.6 145.3<br />
Net interest (135.4) (118.5) (141.1) (176.9)<br />
Tax paid (11.6) (199.3) (490.0) (632.2)<br />
Working capital (946.6) 120.9 269.0 429.4<br />
Other cash & non-cash items 131.9 133.2 146.3 160.7<br />
Operating cash flow (806.7) 70.8 (75.2) (73.7)<br />
Capex (306.3) (301.1) (354.1) (419.3)<br />
Free cash flow to the firm (1,113) (230) (429) (493)<br />
Disposals of fixed assets — — — —<br />
Acquisitions (300.0) — — —<br />
Divestments (0.73) — — —<br />
Associate investments — — — —<br />
Other investment/(outflows) 670.6 — — —<br />
Investing cash flow 63.5 (301.1) (354.1) (419.3)<br />
Equity raised 9.4 — — —<br />
Dividends paid — — — —<br />
Net borrowings 687.9 600.0 600.0 600.0<br />
Other financing cash flow 203.7 — — —<br />
Financing cash flow 901.1 600.0 600.0 600.0<br />
Total cash flow 157.9 369.8 170.6 107.0<br />
Adjustments — — — —<br />
Net change in cash 157.9 369.8 170.6 107.0<br />
Balance sheet (Rmb mn) 12/11A 12/12E 12/13E 12/14E<br />
Cash & cash equivalents 586 955 1,126 1,233<br />
Current receivables 2,423 1,416 1,320 1,337<br />
Inventories 737.3 654.1 576.1 548.3<br />
Other current assets 2,285 2,268 2,282 2,295<br />
Current assets 6,032 5,294 5,304 5,414<br />
Property, plant & equip. 1,393 1,494 1,618 1,770<br />
Investments 4,171 7,002 11,085 16,385<br />
Intangibles 197.5 197.5 197.5 197.5<br />
Other non-current assets 1,018 1,085 1,169 1,275<br />
Total assets 12,811 15,073 19,373 25,042<br />
Accounts payable 4,256 3,401 3,495 3,870<br />
Short-term debt 1,297 1,897 2,497 3,097<br />
Current provisions — — — —<br />
Other current liabilities 1,019 888 902 960<br />
Current liabilities 6,572 6,186 6,894 7,926<br />
Long-term debt — — — —<br />
Non-current provisions — — — —<br />
Other non-current liab. 1.6 1.6 1.6 1.6<br />
Total liabilities 6,573 6,187 6,895 7,928<br />
Shareholders' equity 6,989 9,527 12,969 17,411<br />
Minority interests (752.1) (641.4) (491.1) (297.1)<br />
Total liabilities & equity 12,811 15,073 19,373 25,042<br />
08 January 2013<br />
Key earnings drivers 12/11A 12/12E 12/13E 12/14E<br />
BMW sales (Unit) 108,189 170,000 252,000 337,000<br />
Minibus sales (Unit) 82,491 78,000 86,000 94,000<br />
— — — —<br />
— — — —<br />
Per share data<br />
—<br />
12/11A<br />
—<br />
12/12E<br />
—<br />
12/13E<br />
—<br />
12/14E<br />
Shares (wtd avg.) (mn) 4,998 5,021 5,026 5,026<br />
EPS (Credit Suisse)<br />
0.36 0.51 0.69 0.88<br />
(Rmb) DPS (Rmb) — — — —<br />
BVPS (Rmb) 1.39 1.90 2.58 3.46<br />
Operating CFPS (Rmb) (0.16) 0.01 (0.01) (0.01)<br />
Key ratios and valuation 12/11A 12/12E 12/13E 12/14E<br />
Growth(%)<br />
Sales revenue (28.0) (10.2) 9.2 8.2<br />
EBIT (68.4) (13.1) 4.5 3.3<br />
Net profit 42.6 40.0 35.7 29.0<br />
EPS 42.5 39.4 35.6 29.0<br />
Margins (%)<br />
EBITDA 4.54 4.63 4.54 4.48<br />
EBIT 2.40 2.33 2.23 2.13<br />
Pre-tax profit 30.3 49.2 64.6 77.1<br />
Net profit 28.1 43.8 54.5 65.0<br />
Valuation metrics (x)<br />
P/E 23.4 16.8 12.4 9.6<br />
P/B 6.09 4.49 3.29 2.45<br />
Dividend yield (%) — — — —<br />
P/CF (53) 603 (568) (580)<br />
EV/sales 6.74 7.55 6.98 6.52<br />
EV/EBITDA 149 163 154 146<br />
EV/EBIT 280 324 314 307<br />
ROE analysis (%)<br />
ROE 27.2 30.7 30.6 29.2<br />
ROIC 2.52 1.49 1.05 0.78<br />
Asset turnover (x) 0.50 0.38 0.33 0.27<br />
Interest burden (x) 12.6 21.2 29.0 36.3<br />
Tax burden (x) 0.97 0.93 0.88 0.88<br />
Financial leverage (x) 2.05 1.70 1.55 1.46<br />
Credit ratios<br />
Net debt/equity (%) 11.4 10.6 11.0 10.9<br />
Net debt/EBITDA (x) 2.43 3.51 4.78 6.09<br />
Interest cover (x) 1.32 1.14 1.00 0.82<br />
Source: Company data, Thomson Reuters, Credit Suisse estimates.<br />
0<br />
2008 2009 2010 2011 2012 2013<br />
<strong>China</strong> <strong>Auto</strong> <strong>Sector</strong> 88<br />
6<br />
5<br />
4<br />
3<br />
2<br />
1<br />
Source: IBES<br />
12MF P/B multiple
Companies Mentioned (Price as of 04-Jan-2013)<br />
Alcatel-Lucent (ALUA.PA, €1.21)<br />
Audi (NSUG.DE^B12, €595.0)<br />
Brilliance <strong>China</strong> <strong>Auto</strong>motive Holding (1114.HK, HK$10.58, OUTPERFORM[V], TP HK$12.0)<br />
BMW (BMWG.DE, €75.8)<br />
BYD Co Ltd (1211.HK, HK$22.85, NEUTRAL[V], TP HK$20.0)<br />
Camel Group (601311.SS, Rmb8.5)<br />
Changan <strong>Auto</strong> (000625.SZ, Rmb6.5)<br />
Daimler (DAIGn.DE, €42.63)<br />
Desay Battery (000049.SZ, Rmb30.2)<br />
DFAC (600006.SS, Rmb3.0)<br />
Dongfeng Motors Group Co Ltd (0489.HK, HK$12.04, OUTPERFORM, TP HK$14.0)<br />
EVE (300014.SZ, Rmb11.29)<br />
Faw Car (000800.SZ, Rmb7.9)<br />
Faw Xiali (000927.SZ, Rmb4.87)<br />
Fiat (FIA.MI, €4.01)<br />
Ford Motor Co. (F.N, $13.57)<br />
Foton Motor (600166.SS, Rmb6.61)<br />
Geely <strong>Auto</strong>mobile Holdings Ltd (0175.HK, HK$4.08, UNDERPERFORM[V], TP HK$3.5)<br />
General Motors Corp. (GM.N, $29.86)<br />
Great Wall Motor (2333.HK, HK$25.35, OUTPERFORM[V], TP HK$30.0)<br />
Guangzhou <strong>Auto</strong>mobile Group (2238.HK, HK$7.14, NEUTRAL, TP HK$6.5)<br />
HAIMA AUTO (000572.SZ, Rmb2.93)<br />
Honda Motor (7267.T, ¥3,270)<br />
HTC Corp (2498.TW, NT$287.0)<br />
Hyundai Motor (005380.KS, W206,000, OUTPERFORM, TP W287,000)<br />
JAC (600418.SS, Rmb6.76)<br />
Jiangling Moto (200550.SZ, HK$18.54)<br />
Kia Motors (000270.KS, W53,600, NEUTRAL, TP W70,000)<br />
Lifan (601777.SS, Rmb6.33)<br />
Mazda Motor (7261.T, ¥185)<br />
Mitsubishi Corp (8058.T, ¥1,710)<br />
Mitsubishi Motors (7211.T, ¥94)<br />
Nissan Motor (7201.T, ¥854)<br />
Nokia (NOK1V.HE, €3.22)<br />
Peugeot (PEUP.F, €6.188)<br />
Plantronics (PLT.N, $37.57)<br />
Porsche <strong>Auto</strong> (PSHG_p.DE, €62.89)<br />
Qingling Motors (1122.HK, HK$2.05)<br />
Renault (RENA.PA, €40.77)<br />
Research In Motion Limited (RIMM.OQ, $11.95)<br />
SAIC Motor (600104.SS, Rmb17.59)<br />
Samsung Engineering Co Ltd (028050.KS, W172,500, OUTPERFORM, TP W210,000)<br />
Sinotruk (Hong Kong) Limited (3808.HK, HK$6.2)<br />
Ssangyong Motor (003620.KS, W5,370)<br />
Toyota Motor (7203.T, ¥4,260)<br />
VTech Holdings (0303.HK, HK$86.75)<br />
Weichai Power Co. Ltd (2338.HK, HK$35.8)<br />
ZTE Corporation (0763.HK, HK$13.72)<br />
Volkswagen (VOWG_p.F, €178.55)<br />
Volvo (VOLVa.ST, Skr94.3)<br />
Volvo (VOLVb.ST, Skr94.45)<br />
Important Global Disclosures<br />
Disclosure Appendix<br />
08 January 2013<br />
I, Jack Yeung, certify that (1) the views expressed in this report accurately reflect my personal views about all of the subject companies and<br />
securities and (2) no part of my compensation was, is or will be directly or indirectly related to the specific recommendations or views expressed in<br />
this report.<br />
<strong>China</strong> <strong>Auto</strong> <strong>Sector</strong> 89
Price and Rating History for Kia Motors (000270.KS)<br />
000270.KS Closing Price Target Price<br />
Date (W) (W) Rating<br />
01-Feb-10 20,650 18,000 N<br />
26-Apr-10 26,350 24,000<br />
02-Aug-10 32,300 27,000<br />
01-Nov-10 49,500 39,000<br />
31-Jan-11 54,700 51,000<br />
01-Aug-11 80,900 78,000<br />
28-Oct-11 72,600 75,700<br />
27-Jan-12 67,100 68,000<br />
27-Apr-12 80,700 70,000<br />
* Asterisk signifies initiation or assumption of coverage.<br />
Price and Rating History for Hyundai Motor (005380.KS)<br />
005380.KS Closing Price Target Price<br />
Date (W) (W) Rating<br />
29-Jan-10 113,000 84,000 U<br />
23-Apr-10 130,000 88,000<br />
30-Jul-10 149,000 110,000<br />
22-Oct-10 168,000 125,000<br />
28-Jan-11 188,000 206,000 N<br />
29-Jul-11 235,000 266,300<br />
24-Aug-11 180,500 239,500 O<br />
27-Oct-11 223,500 262,000<br />
28-Mar-12 232,500 289,500<br />
26-Apr-12 262,000 332,500<br />
31-Jul-12 237,000 R<br />
01-Aug-12 237,500 332,500 O<br />
26-Oct-12 226,500 287,000<br />
* Asterisk signifies initiation or assumption of coverage.<br />
N EU T RA L<br />
U N D ERPERFO RM<br />
N EU T RA L<br />
O U T PERFO RM<br />
REST RI C T ED<br />
Price and Rating History for Geely <strong>Auto</strong>mobile Holdings Ltd (0175.HK)<br />
0175.HK Closing Price Target Price<br />
Date (HK$) (HK$) Rating<br />
26-Jan-10 3.51 4.50 O<br />
13-Apr-10 3.82 3.70 N<br />
26-May-10 2.65 1.92 U<br />
18-Jan-11 3.62 2.60<br />
24-Mar-11 2.89 2.30<br />
23-Aug-11 2.22 2.40 N<br />
04-Dec-11 1.90 2.50 O<br />
13-Feb-12 2.92 2.50 N<br />
18-Jun-12 2.81 NR<br />
* Asterisk signifies initiation or assumption of coverage.<br />
O U T PERFO RM<br />
N EU T RA L<br />
U N D ERPERFO RM<br />
N O T RA T ED<br />
08 January 2013<br />
<strong>China</strong> <strong>Auto</strong> <strong>Sector</strong> 90
Price and Rating History for Dongfeng Motors Group Co Ltd (0489.HK)<br />
0489.HK Closing Price Target Price<br />
Date (HK$) (HK$) Rating<br />
26-Jan-10 9.78 13.50 O<br />
15-Apr-10 12.32 12.50 N<br />
26-May-10 8.86 8.10<br />
31-Aug-10 12.08 14.30 O<br />
07-Dec-10 14.80 14.30 N<br />
18-Jan-11 13.96 14.70<br />
11-May-11 12.44 12.25<br />
29-Aug-11 12.02 16.50 O<br />
04-Dec-11 12.14 17.00<br />
19-Jun-12 13.26 NR<br />
23-Nov-12 10.56 14.00 O *<br />
* Asterisk signifies initiation or assumption of coverage.<br />
O U T PERFO RM<br />
N EU T RA L<br />
N O T RA T ED<br />
Price and Rating History for Brilliance <strong>China</strong> <strong>Auto</strong>motive Holding (1114.HK)<br />
1114.HK Closing Price Target Price<br />
Date (HK$) (HK$) Rating<br />
17-Jan-11 5.51 3.70 U<br />
29-Mar-11 7.13 5.60<br />
04-Dec-11 9.38 7.00<br />
22-Feb-12 9.49 6.70<br />
19-Jun-12 7.65 NR<br />
24-Oct-12 9.56 11.00 O *<br />
* Asterisk signifies initiation or assumption of coverage.<br />
Price and Rating History for BYD Co Ltd (1211.HK)<br />
1211.HK Closing Price Target Price<br />
Date (HK$) (HK$) Rating<br />
16-Mar-10 74.55 85.00 O<br />
27-Apr-10 72.20 85.80<br />
26-May-10 57.20 44.00 U<br />
24-Aug-10 44.65 40.00<br />
14-Oct-10 55.05 39.00<br />
27-Oct-10 46.50 37.00<br />
17-Jan-11 42.70 34.00<br />
17-Feb-11 33.90 29.00<br />
15-Mar-11 32.30 27.00<br />
08-Apr-11 29.80 23.00<br />
25-May-11 25.60 22.00<br />
21-Jun-11 21.70 17.70<br />
30-Jun-11 25.15 15.50<br />
07-Jul-11 26.10 15.10<br />
14-Jul-11 23.00 10.10<br />
16-Aug-11 21.70 9.80<br />
05-Dec-11 18.86 9.00<br />
18-Jun-12 15.16 NR<br />
* Asterisk signifies initiation or assumption of coverage.<br />
U N D ERPERFO RM<br />
N O T RA T ED<br />
O U T PERFO RM<br />
O U T PERFO RM<br />
U N D ERPERFO RM<br />
N O T RA T ED<br />
08 January 2013<br />
<strong>China</strong> <strong>Auto</strong> <strong>Sector</strong> 91
Price and Rating History for Guangzhou <strong>Auto</strong>mobile Group (2238.HK)<br />
2238.HK Closing Price Target Price<br />
Date (HK$) (HK$) Rating<br />
05-Dec-11 7.29 8.20 N<br />
18-Jun-12 6.85 NR<br />
24-Oct-12 5.45 4.50 U *<br />
31-Oct-12 5.31 3.50<br />
06-Dec-12 6.42 5.00<br />
* Asterisk signifies initiation or assumption of coverage.<br />
Price and Rating History for Great Wall Motor (2333.HK)<br />
2333.HK Closing Price Target Price<br />
Date (HK$) (HK$) Rating<br />
04-Dec-11 11.40 11.50 N<br />
19-Jun-12 16.50 NR<br />
* Asterisk signifies initiation or assumption of coverage.<br />
N EU T RA L<br />
N O T RA T ED<br />
U N D ERPERFO RM<br />
N EU T RA L<br />
N O T RA T ED<br />
08 January 2013<br />
The analyst(s) responsible for preparing this research report received Compensation that is based upon various factors including Credit Suisse's<br />
total revenues, a portion of which are generated by Credit Suisse's investment banking activities<br />
As of December 10, 2012 Analysts’ stock rating are defined as follows:<br />
Outperform (O) : The stock’s total return is expected to outperform the relevant benchmark*over the next 12 months.<br />
Neutral (N) : The stock’s total return is expected to be in line with the relevant benchmark* over the next 12 months.<br />
Underperform (U) : The stock’s total return is expected to underperform the relevant benchmark* over the next 12 months.<br />
*Relevant benchmark by region: As of 10th December 2012, Japanese ratings are based on a stock’s total return relative to the analyst's coverage universe which<br />
consists of all companies covered by the analyst within the relevant sector, with Outperforms representing the most attractiv e, Neutrals the less attractive, and<br />
Underperforms the least attractive investment opportunities. As of 2nd October 2012, U.S. and Canadian as well as European ra tings are based on a stock’s total<br />
return relative to the analyst's coverage universe which consists of all companies covered by the analyst within the relevant sector, with Outperforms representing the<br />
most attractive, Neutrals the less attractive, and Underperforms the least attractive investment opportunities. For Latin Ame rican and non-Japan Asia stocks, ratings<br />
are based on a stock’s total return relative to the average total return of the relevant country or regional benchmark; Austr alia, New Zealand are, and prior to 2nd<br />
October 2012 U.S. and Canadian ratings were based on (1) a stock’s absolute tota l return potential to its current share price and (2) the relative attractiveness of a<br />
stock’s total return potential within an analyst’s coverage universe. For Australian and New Zealand stocks, 12 -month rolling yield is incorporated in the absolute total<br />
return calculation and a 15% and a 7.5% threshold replace the 10-15% level in the Outperform and Underperform stock rating definitions, respectively. The 15% and<br />
7.5% thresholds replace the +10-15% and -10-15% levels in the Neutral stock rating definition, respectively. Prior to 10th December 2012, Japanese ratings were<br />
based on a stock’s total return relative to the average total return of the relevant country or regional benchmark.<br />
Restricted (R) : In certain circumstances, Credit Suisse policy and/or applicable law and regulations preclude certain types of communications,<br />
including an investment recommendation, during the course of Credit Suisse's engagement in an investment banking transaction and in certain other<br />
circumstances.<br />
Volatility Indicator [V] : A stock is defined as volatile if the stock price has moved up or down by 20% or more in a month in at least 8 of the past 24<br />
months or the analyst expects significant volatility going forward.<br />
Analysts’ sector weightings are distinct from analysts’ stock ratings and are based on the analyst’s expectations for the fundamentals and/or<br />
valuation of the sector* relative to the group’s historic fundamentals and/or valuation:<br />
Overweight : The analyst’s expectation for the sector’s fundamentals and/or valuation is favorable over the next 12 months.<br />
<strong>China</strong> <strong>Auto</strong> <strong>Sector</strong> 92
Market Weight : The analyst’s expectation for the sector’s fundamentals and/or valuation is neutral over the next 12 months.<br />
Underweight : The analyst’s expectation for the sector’s fundamentals and/or valuation is cautious over the next 12 months.<br />
*An analyst’s coverage sector consists of all companies covered by the analyst within the relevant sector. An analyst may cov er multiple sectors.<br />
Credit Suisse's distribution of stock ratings (and banking clients) is:<br />
Global Ratings Distribution<br />
08 January 2013<br />
Rating Versus universe (%) Of which banking clients (%)<br />
Outperform/Buy* 42% (53% banking clients)<br />
Neutral/Hold* 39% (47% banking clients)<br />
Underperform/Sell* 15% (43% banking clients)<br />
Restricted 3%<br />
*For purposes of the NYSE and NASD ratings distribution disclosure requirements, our stock ratings of Outperform, Neutral, and Underperform most closely<br />
correspond to Buy, Hold, and Sell, respectively; however, the meanings are not the same, as our stock ratings are determined on a relative basis. (Please refer to<br />
definitions above.) An investor's decision to buy or sell a security should be based on investment objectives, current holdin gs, and other individual factors.<br />
Credit Suisse’s policy is to update research reports as it deems appropriate, based on developments with the subject company, the sector or the<br />
market that may have a material impact on the research views or opinions stated herein.<br />
Credit Suisse's policy is only to publish investment research that is impartial, independent, clear, fair and not misleading. For more detail please refer<br />
to Credit Suisse's Policies for Managing Conflicts of Interest in connection with Investment Research: http://www.csfb.com/research and<br />
analytics/disclaimer/managing_conflicts_disclaimer.html<br />
Credit Suisse does not provide any tax advice. Any statement herein regarding any US federal tax is not intended or written to be used, and cannot<br />
be used, by any taxpayer for the purposes of avoiding any penalties.<br />
Price Target: (12 months) for Geely <strong>Auto</strong>mobile Holdings Ltd (0175.HK)<br />
Method: Our 12-month target price of HK$3.50 for Geely is based on 10x 2013E P/E. We believe it should trade on par with its Chiense peers,<br />
which are trading at around 10x 2013E EPS.<br />
Risk: Risks to our target price of HK$3.50 for Geely are: (1) stronger-than-expected exports; and (2) stronger-than-expected Emgrand sales.<br />
Price Target: (12 months) for Dongfeng Motors Group Co Ltd (0489.HK)<br />
Method: Our 12-month target price of HK$14.00 for Dongfeng Motors is based on 9x 2013E P/E. Given its strong position in <strong>China</strong>'s auto sector,<br />
we believe it should trade on par with its Chinese peers, which are trading around 10x 2013E EPS.<br />
Risk: Risks to our target price of HK$14.00 for Dongfeng Motors include: (1) continuing anti-Japanese sentiment in <strong>China</strong>; (2) massive price cut<br />
across Japanese brands to recover sales; and (3) introduction of more economy models from other JV players.<br />
Price Target: (12 months) for Guangzhou <strong>Auto</strong>mobile Group (2238.HK)<br />
Method: Our 12-month target price of HK$6.50 for Guangzhou <strong>Auto</strong> is based on 10x 2013E P/E, as we believe it should be traded on par with its<br />
Chinese peers, which are trading around 10x 2013E EPS.<br />
Risk: Risks to our target price of HK$6.50 for Guangzhou <strong>Auto</strong> include: (1) potential introduction of new high-end models; and (2) faster-thanexpected<br />
recovery of the macro economy.<br />
Price Target: (12 months) for Kia Motors (000270.KS)<br />
Method: Our target price of W70,000 for Kia Motors is based on SOTP valuation as applying target EBITDA multiple of 5.5x against 2011E<br />
EBITDA for the consolidated entity.<br />
Risk: Key risks to our W70,000 target price for Kia Motors include any sudden sharp fluctuations in currency movements, which could adversely<br />
impact its profitability. In the short term, the W/US$ and W/Eu exchange rates are both depreciating against the Korean Won, contracting<br />
the company's Won-denominated ASP.<br />
Price Target: (12 months) for Brilliance <strong>China</strong> <strong>Auto</strong>motive Holding (1114.HK)<br />
Method: Our 12-month target price of HK$12.00 for Brilliance <strong>China</strong> <strong>Auto</strong> is based on 14x 2013E EPS.<br />
Risk: Risks to our 12-month target price of HK$12.00 for Brilliance <strong>China</strong> <strong>Auto</strong> include further capital requirement for capacity expansion,<br />
parent's motivation to transfer cash surplus, and strong competition from Audi.<br />
<strong>China</strong> <strong>Auto</strong> <strong>Sector</strong> 93
Price Target: (12 months) for BYD Co Ltd (1211.HK)<br />
08 January 2013<br />
Method: Our 12-month target price of HK$20.00 for BYD is based on SoTP. We value its auto segment at HK$10.20 by using DCF. We apply 12x<br />
2013E P/E to its battery segment and get its value at HK$0.70. We apply 18x 2013E P/E to its handset components and assembly<br />
segment to get its value at HK$9.10.<br />
Risk: Risks to our 12-month target price of HK$20.0 for BYD include: (1) unfavourable government polices regarding EVs; (2) unsuccessful new<br />
model launches in its conventional automobile business; (3) weaknesses in the global economy, causing demand for the company's<br />
products to decline severely.<br />
Price Target: (12 months) for Great Wall Motor (2333.HK)<br />
Method: Our 12-month target price of HK$30.00 for Great Wall Motor is based on 13x 2013E P/E. Given <strong>China</strong>'s SUV sales growth is as fast as<br />
luxury auto sales growth, we believe Great Wall—the No.1 SUV maker in <strong>China</strong>—should trade at a premium to its peers, which are<br />
currently trading at around 10x 2013E EPS.<br />
Risk: Risks to our target price of HK$30.00 for Great Wall Motor are: (1) tougher-than-expected competition in SUV segment; (2) slower-thanexpected<br />
ramp up of its new capacities.<br />
Price Target: (12 months) for Hyundai Motor (005380.KS)<br />
Method: Our W287,000 target price on Hyundai Motor is derived with residual income analysis. Based on using a COE (cost of equity) of 8.9%<br />
utilising a risk-free rate assumption of 3.01% and beta of 1.16, our residual income analysis over a 20-year business cycle suggests a<br />
target 2013E P/B (price-to-book) multiple of 1.2x, within historical valuation range, given expected ROE (return on equity) of 15.6% in<br />
2013.<br />
Risk: Risks to Hyundai Motor achieving our W287,000 target price include the following: For the next 12-18 months demand volatility in the<br />
global auto industry resulting from the completion of demand stimulus programmes in key demand centres may result in lower-thanexpected<br />
demand. Adverse market liquidity can cause the stock price to either overshoot or undershoot our TP under volatile market<br />
conditions.<br />
Please refer to the firm's disclosure website at www.credit-suisse.com/researchdisclosures for the definitions of abbreviations typically used in the<br />
target price method and risk sections.<br />
See the Companies Mentioned section for full company names<br />
The subject company (2238.HK, 000270.KS, 1114.HK, 005380.KS, 0763.HK, 2498.TW, 3808.HK, 7267.T, 7203.T, ALUA.PA, DAIGn.DE, F.N,<br />
FIA.MI, GM.N, NOK1V.HE, RENA.PA, RIMM.OQ, VOLVb.ST, VOWG_p.F) currently is, or was during the 12-month period preceding the date of<br />
distribution of this report, a client of Credit Suisse.<br />
Credit Suisse provided investment banking services to the subject company (2238.HK, 1114.HK, 3808.HK, 7267.T, 7203.T, F.N, FIA.MI, NOK1V.HE,<br />
VOWG_p.F) within the past 12 months.<br />
Credit Suisse provided non-investment banking services to the subject company (000270.KS, 005380.KS, 0763.HK, 7267.T, 7203.T, DAIGn.DE, F.N,<br />
FIA.MI, GM.N, NOK1V.HE, RENA.PA, VOLVb.ST, VOWG_p.F) within the past 12 months<br />
Credit Suisse has managed or co-managed a public offering of securities for the subject company (7267.T, 7203.T, F.N, FIA.MI, NOK1V.HE,<br />
VOWG_p.F) within the past 12 months.<br />
Credit Suisse has received investment banking related compensation from the subject company (2238.HK, 1114.HK, 3808.HK, 7267.T, 7203.T, F.N,<br />
FIA.MI, NOK1V.HE, VOWG_p.F) within the past 12 months<br />
Credit Suisse expects to receive or intends to seek investment banking related compensation from the subject company (0489.HK, 2238.HK,<br />
000270.KS, 1114.HK, 1211.HK, 2498.TW, 3808.HK, 7261.T, 7201.T, 7211.T, 7267.T, 7203.T, ALUA.PA, F.N, FIA.MI, NOK1V.HE, RIMM.OQ,<br />
VOWG_p.F) within the next 3 months.<br />
Credit Suisse has received compensation for products and services other than investment banking services from the subject company (000270.KS,<br />
005380.KS, 0763.HK, 7267.T, 7203.T, DAIGn.DE, F.N, FIA.MI, GM.N, NOK1V.HE, RENA.PA, VOLVb.ST, VOWG_p.F) within the past 12 months<br />
As of the date of this report, Credit Suisse makes a market in the following subject companies (7201.T, 7267.T, 7203.T, F.N, GM.N, RIMM.OQ).<br />
As of the end of the preceding month, Credit Suisse beneficially own 1% or more of a class of common equity securities of (0489.HK, 0763.HK,<br />
2498.TW, DAIGn.DE, FIA.MI, NOK1V.HE).<br />
Important Regional Disclosures<br />
Singapore recipients should contact Credit Suisse AG, Singapore Branch for any matters arising from this research report.<br />
The analyst(s) involved in the preparation of this report have not visited the material operations of the subject company (0175.HK, 0489.HK,<br />
2238.HK, 000270.KS, 1114.HK, 1211.HK, 2333.HK, 005380.KS, 0303.HK, 0763.HK, 2498.TW, 3808.HK, 7261.T, 7201.T, 7211.T, 7267.T, 7203.T,<br />
ALUA.PA, DAIGn.DE, F.N, FIA.MI, GM.N, NOK1V.HE, RENA.PA, RIMM.OQ, VOWG_p.F) within the past 12 months<br />
<strong>China</strong> <strong>Auto</strong> <strong>Sector</strong> 94
08 January 2013<br />
Restrictions on certain Canadian securities are indicated by the following abbreviations: NVS--Non-Voting shares; RVS--Restricted Voting Shares;<br />
SVS--Subordinate Voting Shares.<br />
Individuals receiving this report from a Canadian investment dealer that is not affiliated with Credit Suisse should be advised that this report may not<br />
contain regulatory disclosures the non-affiliated Canadian investment dealer would be required to make if this were its own report.<br />
For Credit Suisse Securities (Canada), Inc.'s policies and procedures regarding the dissemination of equity research, please visit<br />
http://www.csfb.com/legal_terms/canada_research_policy.shtml.<br />
The following disclosed European company/ies have estimates that comply with IFRS: (7201.T, ALUA.PA, DAIGn.DE, F.N, FIA.MI, NOK1V.HE,<br />
RENA.PA, VOLVa.ST, VOLVb.ST, VOWG_p.F).<br />
Credit Suisse has sent extracts of this research report to the subject company (0175.HK, 0489.HK, 2238.HK, 1114.HK, 1211.HK, 2333.HK) prior to<br />
publication for the purpose of verifying factual accuracy. Based on information provided by the subject company, factual changes have been made<br />
as a result.<br />
As of the date of this report, Credit Suisse acts as a market maker or liquidity provider in the equities securities that are the subject of this report.<br />
Principal is not guaranteed in the case of equities because equity prices are variable.<br />
Commission is the commission rate or the amount agreed with a customer when setting up an account or at any time after that.<br />
To the extent this is a report authored in whole or in part by a non-U.S. analyst and is made available in the U.S., the following are important<br />
disclosures regarding any non-U.S. analyst contributors: The non-U.S. research analysts listed below (if any) are not registered/qualified as research<br />
analysts with FINRA. The non-U.S. research analysts listed below may not be associated persons of CSSU and therefore may not be subject to the<br />
NASD Rule 2711 and NYSE Rule 472 restrictions on communications with a subject company, public appearances and trading securities held by a<br />
research analyst account.<br />
Credit Suisse (Hong Kong) Limited ........................................................................................................................................................ Jack Yeung<br />
Important MSCI Disclosures<br />
The MSCI sourced information is the exclusive property of Morgan Stanley Capital International Inc. (MSCI). Without prior written permission of<br />
MSCI, this information and any other MSCI intellectual property may not be reproduced, re-disseminated or used to create and financial products,<br />
including any indices. This information is provided on an "as is" basis. The user assumes the entire risk of any use made of this information. MSCI,<br />
its affiliates and any third party involved in, or related to, computing or compiling the information hereby expressly disclaim all warranties of originality,<br />
accuracy, completeness, merchantability or fitness for a particular purpose with respect to any of this information. Without limiting any of the<br />
foregoing, in no event shall MSCI, any of its affiliates or any third party involved in, or related to, computing or compiling the information have any<br />
liability for any damages of any kind. MSCI, Morgan Stanley Capital International and the MSCI indexes are services marks of MSCI and its affiliates.<br />
The Global Industry Classification Standard (GICS) was developed by and is the exclusive property of Morgan Stanley Capital International Inc. and<br />
Standard & Poor’s. GICS is a service mark of MSCI and S&P and has been licensed for use by Credit Suisse.<br />
For Credit Suisse disclosure information on other companies mentioned in this report, please visit the website at www.creditsuisse.com/researchdisclosures<br />
or call +1 (877) 291-2683.<br />
<strong>China</strong> <strong>Auto</strong> <strong>Sector</strong> 95
08 January 2013<br />
References in this report to Credit Suisse include all of the subsidiaries and affiliates of Credit Suisse operating under its investment banking division. For more information on our structure, please use the<br />
following link: https://www.credit-suisse.com/who_we_are/en/.This report may contain material that is not directed to, or intended for distribution to or use by, any person or entity who is a citizen or resident of<br />
or located in any locality, state, country or other jurisdiction where such distribution, publication, availability or use would be contrary to law or regulation or which would subject Credit Suisse AG or its affiliates<br />
("CS") to any registration or licensing requirement within such jurisdiction. All material presented in this report, unless specifically indicated otherwise, is under copyright to CS. None of the material, nor its<br />
content, nor any copy of it, may be altered in any way, transmitted to, copied or distributed to any other party, without the prior express written permission of CS. All trademarks, service marks and logos used<br />
in this report are trademarks or service marks or registered trademarks or service marks of CS or its affiliates. The information, tools and material presented in this report are provided to you for information<br />
purposes only and are not to be used or considered as an offer or the solicitation of an offer to sell or to buy or subscribe for securities or other financial instruments. CS may not have taken any steps to<br />
ensure that the securities referred to in this report are suitable for any particular investor. CS will not treat recipients of this report as its customers by virtue of their receiving this report. The investments and<br />
services contained or referred to in this report may not be suitable for you and it is recommended that you consult an independent investment advisor if you are in doubt about such investments or investment<br />
services. Nothing in this report constitutes investment, legal, accounting or tax advice, or a representation that any investment or strategy is suitable or appropriate to your individual circumstances, or<br />
otherwise constitutes a personal recommendation to you. CS does not advise on the tax consequences of investments and you are advised to contact an independent tax adviser. Please note in particular<br />
that the bases and levels of taxation may change. Information and opinions presented in this report have been obtained or derived from sources believed by CS to be reliable, but CS makes no representation<br />
as to their accuracy or completeness. CS accepts no liability for loss arising from the use of the material presented in this report, except that this exclusion of liability does not apply to the extent that such<br />
liability arises under specific statutes or regulations applicable to CS. This report is not to be relied upon in substitution for the exercise of independent judgment. CS may have issued, and may in the future<br />
issue, other communications that are inconsistent with, and reach different conclusions from, the information presented in this report. Those communications reflect the different assumptions, views and<br />
analytical methods of the analysts who prepared them and CS is under no obligation to ensure that such other communications are brought to the attention of any recipient of this report. CS may, to the extent<br />
permitted by law, participate or invest in financing transactions with the issuer(s) of the securities referred to in this report, perform services for or solicit business from such issuers, and/or have a position or<br />
holding, or other material interest, or effect transactions, in such securities or options thereon, or other investments related thereto. In addition, it may make markets in the securities mentioned in the material<br />
presented in this report. CS may have, within the last three years, served as manager or co-manager of a public offering of securities for, or currently may make a primary market in issues of, any or all of the<br />
entities mentioned in this report or may be providing, or have provided within the previous 12 months, significant advice or investment services in relation to the investment concerned or a related investment.<br />
Additional information is, subject to duties of confidentiality, available on request. Some investments referred to in this report will be offered solely by a single entity and in the case of some investments solely<br />
by CS, or an associate of CS or CS may be the only market maker in such investments. Past performance should not be taken as an indication or guarantee of future performance, and no representation or<br />
warranty, express or implied, is made regarding future performance. Information, opinions and estimates contained in this report reflect a judgment at its original date of publication by CS and are subject to<br />
change without notice. The price, value of and income from any of the securities or financial instruments mentioned in this report can fall as well as rise. The value of securities and financial instruments is<br />
subject to exchange rate fluctuation that may have a positive or adverse effect on the price or income of such securities or financial instruments. Investors in securities such as ADR's, the values of which are<br />
influenced by currency volatility, effectively assume this risk. Structured securities are complex instruments, typically involve a high degree of risk and are intended for sale only to sophisticated investors who<br />
are capable of understanding and assuming the risks involved. The market value of any structured security may be affected by changes in economic, financial and political factors (including, but not limited to,<br />
spot and forward interest and exchange rates), time to maturity, market conditions and volatility, and the credit quality of any issuer or reference issuer. Any investor interested in purchasing a structured<br />
product should conduct their own investigation and analysis of the product and consult with their own professional advisers as to the risks involved in making such a purchase. Some investments discussed in<br />
this report may have a high level of volatility. High volatility investments may experience sudden and large falls in their value causing losses when that investment is realised. Those losses may equal your<br />
original investment. Indeed, in the case of some investments the potential losses may exceed the amount of initial investment and, in such circumstances, you may be required to pay more money to support<br />
those losses. Income yields from investments may fluctuate and, in consequence, initial capital paid to make the investment may be used as part of that income yield. Some investments may not be readily<br />
realisable and it may be difficult to sell or realise those investments, similarly it may prove difficult for you to obtain reliable information about the value, or risks, to which such an investment is exposed. This<br />
report may provide the addresses of, or contain hyperlinks to, websites. Except to the extent to which the report refers to website material of CS, CS has not reviewed any such site and takes no responsibility<br />
for the content contained therein. Such address or hyperlink (including addresses or hyperlinks to CS's own website material) is provided solely for your convenience and information and the content of any<br />
such website does not in any way form part of this document. Accessing such website or following such link through this report or CS's website shall be at your own risk. This report is issued and distributed in<br />
Europe (except Switzerland) by Credit Suisse Securities (Europe) Limited, One Cabot Square, London E14 4QJ, England, which is regulated in the United Kingdom by The Financial Services Authority<br />
("FSA"). This report is being distributed in Germany by Credit Suisse Securities (Europe) This report is being distributed in the United States and Canada by Credit Suisse Securities (USA) LLC; in Switzerland<br />
by Credit Suisse AG; in Brazil by Banco de Investimentos Credit Suisse (Brasil) S.A or its affiliates; in Mexico by Banco Credit Suisse (México), S.A. (transactions related to the securities mentioned in this<br />
report will only be effected in compliance with applicable regulation); in Japan by Credit Suisse Securities (Japan) Limited, Financial Instruments Firm, Director-General of Kanto Local Finance Bureau<br />
(Kinsho) No. 66, a member of Japan Securities Dealers Association, The Financial Futures Association of Japan, Japan Investment Advisers Association, Type II Financial Instruments Firms Association;<br />
elsewhere in Asia/ Pacific by whichever of the following is the appropriately authorised entity in the relevant jurisdiction: Credit Suisse (Hong Kong) Limited, Credit Suisse Equities (Australia) Limited, Credit<br />
Suisse Securities (Thailand) Limited, Credit Suisse Securities (Malaysia) Sdn Bhd, Credit Suisse AG, Singapore Branch, Credit Suisse Securities (India) Private Limited regulated by the Securities and<br />
Exchange Board of India (registration Nos. INB230970637; INF230970637; INB010970631; INF010970631), having registered address at 9th Floor, Ceejay House, Dr.A.B. Road, Worli, Mumbai - 18, India,<br />
T- +91-22 6777 3777, Credit Suisse Securities (Europe) Limited, Seoul Branch, Credit Suisse AG, Taipei Securities Branch, PT Credit Suisse Securities Indonesia, Credit Suisse Securities (Philippines ) Inc.,<br />
and elsewhere in the world by the relevant authorised affiliate of the above. Research on Taiwanese securities produced by Credit Suisse AG, Taipei Securities Branch has been prepared by a registered<br />
Senior Business Person. Research provided to residents of Malaysia is authorised by the Head of Research for Credit Suisse Securities (Malaysia) Sdn Bhd, to whom they should direct any queries on +603<br />
2723 2020. This research may not conform to Canadian disclosure requirements. In jurisdictions where CS is not already registered or licensed to trade in securities, transactions will only be effected in<br />
accordance with applicable securities legislation, which will vary from jurisdiction to jurisdiction and may require that the trade be made in accordance with applicable exemptions from registration or licensing<br />
requirements. Non-U.S. customers wishing to effect a transaction should contact a CS entity in their local jurisdiction unless governing law permits otherwise. U.S. customers wishing to effect a transaction<br />
should do so only by contacting a representative at Credit Suisse Securities (USA) LLC in the U.S. Please note that this research was originally prepared and issued by CS for distribution to their market<br />
professional and institutional investor customers. Recipients who are not market professional or institutional investor customers of CS should seek the advice of their independent financial advisor prior to<br />
taking any investment decision based on this report or for any necessary explanation of its contents. This research may relate to investments or services of a person outside of the UK or to other matters which<br />
are not regulated by the FSA or in respect of which the protections of the FSA for private customers and/or the UK compensation scheme may not be available, and further details as to where this may be the<br />
case are available upon request in respect of this report. CS may provide various services to US municipal entities or obligated persons ("municipalities"), including suggesting individual transactions or trades<br />
and entering into such transactions. Any services CS provides to municipalities are not viewed as "advice" within the meaning of Section 975 of the Dodd-Frank Wall Street Reform and Consumer Protection<br />
Act. CS is providing any such services and related information solely on an arm's length basis and not as an advisor or fiduciary to the municipality. In connection with the provision of the any such services,<br />
there is no agreement, direct or indirect, between any municipality (including the officials, management, employees or agents thereof) and CS for CS to provide advice to the municipality. Municipalities should<br />
consult with their financial, accounting and legal advisors regarding any such services provided by CS. In addition, CS is not acting for direct or indirect compensation to solicit the municipality on behalf of an<br />
unaffiliated broker, dealer, municipal securities dealer, municipal advisor, or investment adviser for the purpose of obtaining or retaining an engagement by the municipality for or in connection with Municipal<br />
Financial Products, the issuance of municipal securities, or of an investment adviser to provide investment advisory services to or on behalf of the municipality. If this report is being distributed by a financial<br />
institution other than Credit Suisse AG, or its affiliates, that financial institution is solely responsible for distribution. Clients of that institution should contact that institution to effect a transaction in the securities<br />
mentioned in this report or require further information. This report does not constitute investment advice by Credit Suisse to the clients of the distributing financial institution, and neither Credit Suisse AG, its<br />
affiliates, and their respective officers, directors and employees accept any liability whatsoever for any direct or consequential loss arising from their use of this report or its content. Principal is not guaranteed.<br />
Commission is the commission rate or the amount agreed with a customer when setting up an account or at any time after that.<br />
Copyright © 2013 CREDIT SUISSE AG and/or its affiliates. All rights reserved.<br />
Investment principal on bonds can be eroded depending on sale price or market price. In addition, there are bonds on which investment principal can<br />
be eroded due to changes in redemption amounts. Care is required when investing in such instruments.<br />
When you purchase non-listed Japanese fixed income securities (Japanese government bonds, Japanese municipal bonds, Japanese government guaranteed bonds, Japanese corporate bonds) from CS<br />
as a seller, you will be requested to pay the purchase price only.<br />
<strong>China</strong> <strong>Auto</strong> <strong>Sector</strong> AU0275.doc