

Children with Disabilities
Children with Disabilities
Children with Disabilities

Create successful ePaper yourself
Turn your PDF publications into a flip-book with our unique Google optimized e-Paper software.
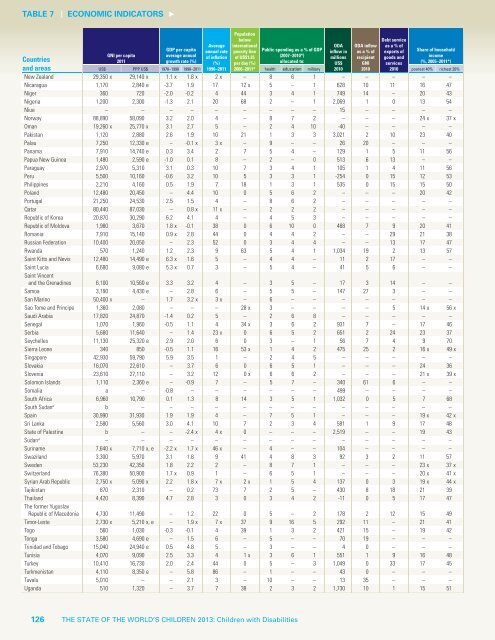
TABLE 7 ECONOmIC INdICATORS<br />
Countries<br />
and areas<br />
New Zealand 29,350 x 29,140 x 1.1 x 1.8 x 2 x – 8 6 1 – – – – –<br />
Nicaragua 1,170 2,840 e -3.7 1.9 17 12 x 5 – 1 628 10 11 16 47<br />
Niger 360 720 -2.0 -0.2 4 44 3 4 1 749 14 – 20 43<br />
Nigeria 1,200 2,300 -1.3 2.1 20 68 2 – 1 2,069 1 0 13 54<br />
Niue – – – – – – – – – 15 – – – –<br />
Norway 88,890 58,090 3.2 2.0 4 – 8 7 2 – – – 24 x 37 x<br />
Oman 19,260 x 25,770 x 3.1 2.7 5 – 2 4 10 -40 – – – –<br />
Pakistan 1,120 2,880 2.6 1.9 10 21 1 3 3 3,021 2 10 23 40<br />
Palau 7,250 12,330 e – -0.1 x 3 x – 9 – – 26 20 – – –<br />
Panama 7,910 14,740 e 0.3 3.4 2 7 5 4 – 129 1 5 11 56<br />
Papua New Guinea 1,480 2,590 e -1.0 0.1 8 – 2 – 0 513 6 13 – –<br />
Paraguay 2,970 5,310 3.1 0.3 10 7 3 4 1 105 1 4 11 56<br />
Peru 5,500 10,160 -0.6 3.2 10 5 3 3 1 -254 0 15 12 53<br />
Philippines 2,210 4,160 0.5 1.9 7 18 1 3 1 535 0 15 15 50<br />
Poland 12,480 20,450 – 4.4 10 0 5 6 2 – – – 20 42<br />
Portugal 21,250 24,530 2.5 1.5 4 – 8 6 2 – – – – –<br />
Qatar 80,440 87,030 – 0.8 x 11 x – 2 2 2 – – – – –<br />
Republic of Korea 20,870 30,290 6.2 4.1 4 – 4 5 3 – – – – –<br />
Republic of Moldova 1,980 3,670 1.8 x -0.1 38 0 6 10 0 468 7 9 20 41<br />
Romania 7,910 15,140 0.9 x 2.8 44 0 4 4 2 – – 29 21 38<br />
Russian Federation 10,400 20,050 – 2.3 52 0 3 4 4 – – 13 17 47<br />
Rwanda 570 1,240 1.2 2.3 9 63 5 4 1 1,034 19 2 13 57<br />
Saint Kitts and Nevis 12,480 14,490 e 6.3 x 1.6 5 – 4 4 – 11 2 17 – –<br />
Saint Lucia<br />
Saint Vincent<br />
6,680 9,080 e 5.3 x 0.7 3 – 5 4 – 41 5 6 – –<br />
and the Grenadines 6,100 10,560 e 3.3 3.2 4 – 3 5 – 17 3 14 – –<br />
Samoa 3,190 4,430 e – 2.8 6 – 5 5 – 147 27 3 – –<br />
San Marino 50,400 x – 1.7 3.2 x 3 x – 6 – – – – – – –<br />
Sao Tome and Principe 1,360 2,080 – – – 28 x 3 – – – – 5 14 x 56 x<br />
Saudi Arabia 17,820 24,870 -1.4 0.2 5 – 2 6 8 – – – – –<br />
Senegal 1,070 1,960 -0.5 1.1 4 34 x 3 6 2 931 7 – 17 46<br />
Serbia 5,680 11,640 – 1.4 23 x 0 6 5 2 651 2 24 23 37<br />
Seychelles 11,130 25,320 e 2.9 2.0 6 0 3 – 1 56 7 4 9 70<br />
Sierra Leone 340 850 -0.5 1.1 16 53 x 1 4 2 475 25 2 16 x 49 x<br />
Singapore 42,930 59,790 5.9 3.5 1 – 2 4 5 – – – – –<br />
Slovakia 16,070 22,610 – 3.7 6 0 6 5 1 – – – 24 36<br />
Slovenia 23,610 27,110 – 3.2 12 0 x 6 6 2 – – – 21 x 39 x<br />
Solomon Islands 1,110 2,360 e – -0.9 7 – 5 7 – 340 61 6 – –<br />
Somalia a – -0.8 – – – – – – 499 – – – –<br />
South Africa 6,960 10,790 0.1 1.3 8 14 3 5 1 1,032 0 5 7 68<br />
South Sudans b – – – – – – – – – – – – –<br />
Spain 30,990 31,930 1.9 1.9 4 – 7 5 1 – – – 19 x 42 x<br />
Sri Lanka 2,580 5,560 3.0 4.1 10 7 2 3 4 581 1 9 17 48<br />
State of Palestine b – – -2.4 x 4 x 0 – – – 2,519 – – 19 43<br />
Sudans US$ PPP US$ 1970–1990 1990–2011 1990–2011 2006–2011* health education military 2010 2010 2010 poorest 40% richest 20%<br />
– – – – – – – – – – – – – –<br />
Suriname 7,640 x 7,710 x, e -2.2 x 1.7 x 46 x – 4 – – 104 – – – –<br />
Swaziland 3,300 5,970 3.1 1.8 9 41 4 8 3 92 3 2 11 57<br />
Sweden 53,230 42,350 1.8 2.2 2 – 8 7 1 – – – 23 x 37 x<br />
Switzerland 76,380 50,900 1.7 x 0.9 1 – 6 5 1 – – – 20 x 41 x<br />
Syrian Arab Republic 2,750 x 5,090 x 2.2 1.8 x 7 x 2 x 1 5 4 137 0 3 19 x 44 x<br />
Tajikistan 870 2,310 – 0.2 73 7 2 5 – 430 8 18 21 39<br />
Thailand<br />
The former Yugoslav<br />
4,420 8,390 4.7 2.8 3 0 3 4 2 -11 0 5 17 47<br />
Republic of Macedonia 4,730 11,490 – 1.2 22 0 5 – 2 178 2 12 15 49<br />
Timor-Leste 2,730 x 5,210 x, e – 1.9 x 7 x 37 9 16 5 292 11 – 21 41<br />
Togo 560 1,030 -0.3 -0.1 4 39 1 3 2 421 15 – 19 42<br />
Tonga 3,580 4,690 e – 1.5 6 – 5 – – 70 19 – – –<br />
Trinidad and Tobago 15,040 24,940 e 0.5 4.8 5 – 3 – – 4 0 – – –<br />
Tunisia 4,070 9,090 2.5 3.3 4 1 x 3 6 1 551 1 9 16 48<br />
Turkey 10,410 16,730 2.0 2.4 44 0 5 – 3 1,049 0 33 17 45<br />
Turkmenistan 4,110 8,350 e – 5.8 86 – 1 – – 43 0 – – –<br />
Tuvalu 5,010 – – 2.1 3 – 10 – – 13 35 – – –<br />
Uganda 510 1,320 – 3.7 7 38 2 3 2 1,730 10 1 15 51<br />
126<br />
GNI per capita<br />
2011<br />
GDP per capita<br />
average annual<br />
growth rate (%)<br />
Average<br />
annual rate<br />
of inflation<br />
THE STATE OF THE WORLD’S CHILDREN 2013: <strong>Children</strong> <strong>with</strong> <strong>Disabilities</strong><br />
(%)<br />
Population<br />
below<br />
international<br />
poverty line<br />
of US$1.25<br />
per day (%)<br />
Public spending as a % of GDP<br />
(2007–2010*)<br />
allocated to:<br />
ODA<br />
inflow in<br />
millions<br />
US$<br />
ODA inflow<br />
as a % of<br />
recipient<br />
GNI<br />
Debt service<br />
as a % of<br />
exports of<br />
goods and<br />
services<br />
Share of household<br />
income<br />
(%, 2005–2011*)