final%20report%20online%20upd
final%20report%20online%20upd
final%20report%20online%20upd
Create successful ePaper yourself
Turn your PDF publications into a flip-book with our unique Google optimized e-Paper software.
Note: It has to be stressed that equation 13 is valid under the assumption that u0 is constant<br />
and RSU is proportional to the GM concentration c. This assumption should be checked using<br />
in-house validation or verification data.<br />
It can occur that u0 is so small that it can be neglected.<br />
Regulations (EC) No 1829/2003 [2] and (EC) No 1830/2003 [21] set a labelling threshold for<br />
the total authorised GMO presence on an ingredient basis. As such, the GMO contents for<br />
various events of one ingredient must be added together and the uncertainties associated with<br />
each individual GMO measurement combined. The MU of various methods can be combined<br />
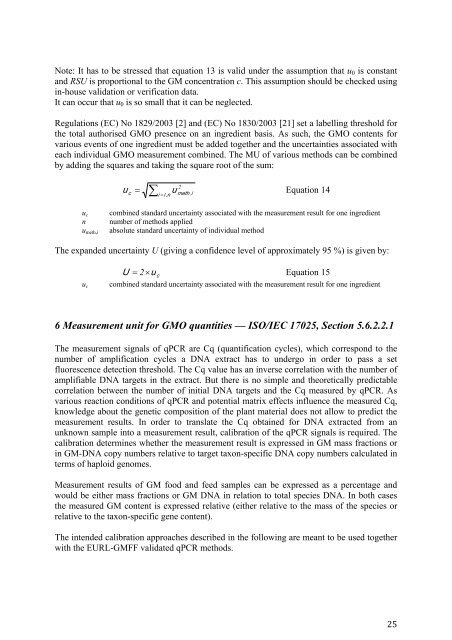
by adding the squares and taking the square root of the sum:<br />
u c = ∑ i = 1,<br />
n<br />
u<br />
2<br />
meth i<br />
, Equation 14<br />
uc combined standard uncertainty associated with the measurement result for one ingredient<br />
n number of methods applied<br />
umeth,i absolute standard uncertainty of individual method<br />
The expanded uncertainty U (giving a confidence level of approximately 95 %) is given by:<br />
U = 2 × u<br />
Equation 15<br />
c<br />
uc combined standard uncertainty associated with the measurement result for one ingredient<br />
6 Measurement unit for GMO quantities — ISO/IEC 17025, Section 5.6.2.2.1<br />
The measurement signals of qPCR are Cq (quantification cycles), which correspond to the<br />
number of amplification cycles a DNA extract has to undergo in order to pass a set<br />
fluorescence detection threshold. The Cq value has an inverse correlation with the number of<br />
amplifiable DNA targets in the extract. But there is no simple and theoretically predictable<br />
correlation between the number of initial DNA targets and the Cq measured by qPCR. As<br />
various reaction conditions of qPCR and potential matrix effects influence the measured Cq,<br />
knowledge about the genetic composition of the plant material does not allow to predict the<br />
measurement results. In order to translate the Cq obtained for DNA extracted from an<br />
unknown sample into a measurement result, calibration of the qPCR signals is required. The<br />
calibration determines whether the measurement result is expressed in GM mass fractions or<br />
in GM-DNA copy numbers relative to target taxon-specific DNA copy numbers calculated in<br />
terms of haploid genomes.<br />
Measurement results of GM food and feed samples can be expressed as a percentage and<br />
would be either mass fractions or GM DNA in relation to total species DNA. In both cases<br />
the measured GM content is expressed relative (either relative to the mass of the species or<br />
relative to the taxon-specific gene content).<br />
The intended calibration approaches described in the following are meant to be used together<br />
with the EURL-GMFF validated qPCR methods.<br />
25


