IMC 0609, App F, Att 7 - NRC
IMC 0609, App F, Att 7 - NRC
IMC 0609, App F, Att 7 - NRC

You also want an ePaper? Increase the reach of your titles
YUMPU automatically turns print PDFs into web optimized ePapers that Google loves.
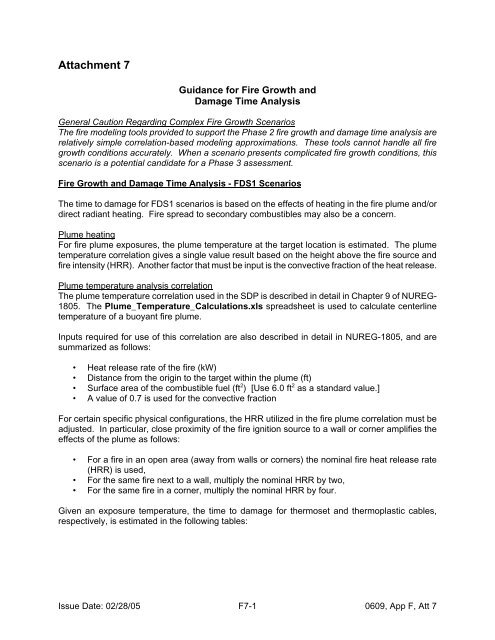
<strong>Att</strong>achment 7<br />
Guidance for Fire Growth and<br />
Damage Time Analysis<br />
General Caution Regarding Complex Fire Growth Scenarios<br />
The fire modeling tools provided to support the Phase 2 fire growth and damage time analysis are<br />
relatively simple correlation-based modeling approximations. These tools cannot handle all fire<br />
growth conditions accurately. When a scenario presents complicated fire growth conditions, this<br />
scenario is a potential candidate for a Phase 3 assessment.<br />
Fire Growth and Damage Time Analysis - FDS1 Scenarios<br />
The time to damage for FDS1 scenarios is based on the effects of heating in the fire plume and/or<br />
direct radiant heating. Fire spread to secondary combustibles may also be a concern.<br />
Plume heating<br />
For fire plume exposures, the plume temperature at the target location is estimated. The plume<br />
temperature correlation gives a single value result based on the height above the fire source and<br />
fire intensity (HRR). Another factor that must be input is the convective fraction of the heat release.<br />
Plume temperature analysis correlation<br />
The plume temperature correlation used in the SDP is described in detail in Chapter 9 of NUREG-<br />
1805. The Plume_Temperature_Calculations.xls spreadsheet is used to calculate centerline<br />
temperature of a buoyant fire plume.<br />
Inputs required for use of this correlation are also described in detail in NUREG-1805, and are<br />
summarized as follows:<br />
• Heat release rate of the fire (kW)<br />
• Distance from the origin to the target within the plume (ft)<br />
• Surface area of the combustible fuel (ft 2 ) [Use 6.0 ft 2 as a standard value.]<br />
• A value of 0.7 is used for the convective fraction<br />
For certain specific physical configurations, the HRR utilized in the fire plume correlation must be<br />
adjusted. In particular, close proximity of the fire ignition source to a wall or corner amplifies the<br />
effects of the plume as follows:<br />
• For a fire in an open area (away from walls or corners) the nominal fire heat release rate<br />
(HRR) is used,<br />
• For the same fire next to a wall, multiply the nominal HRR by two,<br />
• For the same fire in a corner, multiply the nominal HRR by four.<br />
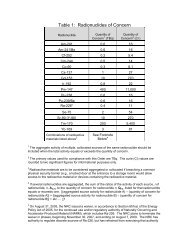
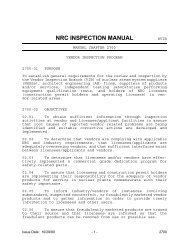
Given an exposure temperature, the time to damage for thermoset and thermoplastic cables,<br />
respectively, is estimated in the following tables:<br />
Issue Date: 02/28/05 F7-1<br />
<strong>0609</strong>, <strong>App</strong> F, <strong>Att</strong> 7
Table A7.1 - Failure Time-Temperature Relationship for Thermoset Cables<br />
Exposure Temperature Time to Failure<br />
°C °F<br />
(minutes)<br />
330 # T < 335 625 # T < 634 28<br />
335 # T < 340 634 # T < 642 24<br />
340 # T < 345 642 # T < 651 20<br />
345 # T < 350 651 # T < 660 16<br />
350 # T < 360 660 # T < 680 13<br />
360 # T < 370 680 # T < 700 10<br />
370 # T < 380 700 # T < 716 9<br />
380 # T < 390 716 # T < 735 8<br />
390 # T < 400 735 # T < 752 7<br />
400 # T < 410 752 # T < 770 6<br />
410 # T < 430 770 # T < 805 5<br />
430 # T < 450 805 # T < 840 4<br />
450 # T < 470 840 # T < 880 3<br />
470 # T < 490 880 # T < 915 2<br />
T $ 490 T $ 915 1<br />
Table A7.2 - Failure Time-Temperature Relationship for Thermoplastic Cables<br />
Exposure Temperature Time to Failure<br />
°C °F<br />
(minutes)<br />
205 # T < 220 400 # T < 425 30<br />
220 # T < 230 425 # T < 450 25<br />
240 # T < 245 450 # T < 475 20<br />
245 # T < 260 475 # T < 500 15<br />
260 # T < 275 500 # T < 525 10<br />
275 # T < 290 525 # T < 550 8<br />
290 # T < 300 550 # T < 575 7<br />
300 # T < 315 575 # T < 600 6<br />
315 # T < 330 600 # T < 625 5<br />
330 # T < 345 625 # T < 650 4<br />
345 # T < 355 650 # T < 675 3<br />
355 # T < 370 675 # T < 700 2<br />
<strong>0609</strong>, <strong>App</strong> F, <strong>Att</strong> 7 F7-2<br />
Issue Date: 02/28/05
T $ 370 T $ 700 1<br />
Radiant heating<br />
The approach for radiant heating is similar to that for plume heating. An exposure heat flux is<br />
calculated using the appropriate fire modeling correlation from NUREG-1805 fire modeling tool set,<br />
and the damage time is assessed base on the intensity of the exposure. The inspector must<br />
establish the line of sight distance from the fire to the target. A second factor required is the fraction<br />
of the total fire heat output that is released as thermal radiation.<br />
• For evaluating damage due to radiant heat, assume 30% of heat released by fire is radiant<br />
energy (radiant fraction = 0.3).<br />
Radiant heating correlation<br />
The correlation for estimating fire radiant heating effects is described in detail in Chapter 5 of<br />
NUREG-1805. Only the Wind Free Condition correlation is applied in the Phase 2 SDP process.<br />
The following spreadsheet from NUREG-1805 applies:<br />
• Wind Free Condition (i.e., indoor fires): Heat_Flux_Calculations_Wind_Free.xls (Click<br />
on Point Source) or Heat_Flux_Calculations_Wind_Free_Given_HRR.xls<br />
Inputs required for use of this correlation are also described in detail in Section 5.6 of NUREG-<br />
1805, and are summarized as follows:<br />
• Fuel type (material)<br />
• Fuel spill area or dike area (ft 2 )<br />
• Distance between fire and target (ft)<br />
• Vertical distance of target from ground level (ft) [For Solid Flame 2 calculation]<br />
Once the exposure heat flux has been estimated, the time to damage due to exposure heat flux for<br />
thermoset and thermoplastic cables, respectively, is estimated in the following tables:<br />
Table A7.3 - Estimated Damage Time for Radiant Heating<br />
Exposures - Thermoset Cables<br />
Exposure Heat Flux<br />
BTU/ft<br />
Damage Time (minutes)<br />
2 s kW/m 2<br />
Table A7.4 - Estimated Damage Time for Radiant Heating<br />
Exposures - Thermoplastic Cables<br />
Exposure Heat Flux<br />
BTU/ft<br />
Damage Time (minutes)<br />
2 s kW/m 2<br />
HGL Exposure With Fire Spread:<br />
In some scenarios, fire damage will occur to exposed (unprotected) cables due to a HGL exposure,<br />
but only after the fire spreads beyond the fire ignition source. The fire ignition source itself may not<br />
be of sufficient intensity to create a damaging HGL, but if the fire spreads to secondary<br />
combustible, then a damaging HGL could be created.<br />
In such situations the secondary combustible is likely to be cables. Common examples include a<br />
hot work fire that ignites a cable tray, a self-ignited cable tray fire, a transient fire that ignites one<br />
or more cable trays, or an electrical equipment fire that ignites one or more cable trays.<br />
The Fire Dynamics Tool Hot Gas Layer correlation is applied.<br />
• Increase (or decrease) the fire HRR in increments of 50 kW until the HGL temperature<br />
predicted at 10 minutes is above the appropriate cable damage threshold (i.e.,<br />
thermoplastic or thermoset). Use the Time to HGL From Fire Spread_Locked.xls cable<br />
fire spread - hot gas layer spreadsheet to determine the time to achieve a HGL from fire<br />
spread, or perform the following calculation:<br />
" Subtract from the resulting fire intensity, the fire intensity of the postulated fire ignition<br />
source.<br />
" The remainder of the fire frequency must be accounted for by fire spread, presumably<br />
into overhead cable trays (the “fire spread HRR”):<br />
- Assume a that a cable tray will burn at an intensity of 400 kW/m 2<br />
- Divide the fire spread HRR (in kW) by 400 to determine the square meters of cable<br />
tray required to create a fire of this intensity. (1m 2 = 10.76ft 2 )<br />
- Determine if there are sufficient cable trays available to support a fire of this size.<br />
If the available cable trays are not sufficient to support the required fire intensity<br />
(there are not enough exposed trays), then this FDS2 HGL fire scenario is<br />
determined to be implausible, and should be discarded. Consider possible FDS2<br />
scenarios that involve direct spread of fire to the necessary target set (see<br />
discussion below).<br />
- If the trays present are sufficient, apply the fire spread rules for cable tray fires and<br />
estimate the time required for the fire to spread to this size (e.g., following the rules<br />
for horizontal and vertical fire spread, and for spread to adjacent cable stacks).<br />
• This time is taken as the FDS2 HGL scenario fire damage time.<br />
Fire spreads to the location of an exposed fire damage target<br />
In some scenarios, the mechanism for fire damage may be the spread of fire from a fire ignition<br />
source to the location of a critical target. In this case, it is likely that fire spread through one or more<br />
cable trays will be the concern. A typical case might involve a fire ignition source that ignites cables<br />
directly overhead, and the subsequent spreads of fire through the tray(s) to the location of a cable<br />
“pinch point” where the routing of a target cables converge with the fire spread path.<br />
In such cases, the fire damage time is determined by the time required to spread fire to the target<br />
cable location. Once fire spreads to the target, no additional failure time delay is assumed (due to<br />
pre-heating of the cable during the period of fire spread).<br />
The rules for the analysis of cable tray fires to estimate the required fire spread time are provided<br />
in <strong>Att</strong>achment 3.<br />
Fire causes failure of protected cables<br />
Issue Date: 02/28/05 F7-5<br />
<strong>0609</strong>, <strong>App</strong> F, <strong>Att</strong> 7
In this scenario, a prolonged fire is postulated to cause the failure of one or more protected cables<br />
or components (e.g., cables encased in a localized fire barrier that is not highly degraded). Due<br />
to the low likelihood of fires lasting two hours or greater, fire scenarios should not be postulated as<br />
leading to the failure of cables protected by a fire barrier wrap with an effective fire barrier<br />
endurance rating of two hours or more. The barrier would typically be a one-hour barrier (one, two,<br />
and three hour barriers are the most common). Recall that FDS2 scenario can involve either of the<br />
following two cases:<br />
• A moderately degraded fire barrier that is given some credit for fire protection: For a<br />
moderately degraded barrier, the fire endurance rating is reduced to reflect the degradation.<br />
The fire barrier system would typically be protecting required or associated circuit cables<br />
where the <strong>App</strong>endix R Section III.G.2 protection strategy involved a three-hour fire barrier<br />
wrap, or a one-hour wrap plus detection and suppression.<br />
• A non-degraded raceway fire barrier system protecting important safe shutdown system<br />
with a rating of less than two hours: In this case, the barrier may be associated with an<br />
exemption or exception to the separation requirements of <strong>App</strong>endix R Section III.G.2, or that<br />
analysis may involve a finding against other aspects of the III.G.2 requirements (e.g., the<br />
fire detection and/or suppression systems).<br />
For scenarios involving failure of protected cables, three specific sub-cases will be considered:<br />
• Protected cables located directly above the fire (in the fire plume) and within the zone of<br />
influence for the fire source.<br />
• Protected cables located outside the zone of influence for the fire source where the fire<br />
ignition source itself is sufficient to create a damaging HGL exposure (no fire spread is<br />
needed).<br />
• Protected cables located outside the zone of influence for the fire source where fire spread<br />
must occur in order to create a damaging HGL exposure.<br />
Each of the specific sub-cases require calculation of the fire endurance rating of the fire barrier after<br />
any penalties for degradation have been applied. Recall:<br />
• A non-degraded fire barrier is credited for its full nominal fire endurance rating.<br />
• Moderate A degradation reduces the fire barrier endurance to 65% of the nominal rating.<br />
• Moderate B degradation reduces the fire barrier endurance to 35% of the nominal rating.<br />
Fire Plume Zone of Influence Exposures:<br />
If the protected cables are located directly above the fire source and within the zone of influence<br />
for the fire source, the damage time is based on the sum of two time values; namely, the fire<br />
endurance time of the fire barrier system (after applying any degradation penalties) plus one-half<br />
the time to damage normally associated with the fire exposure temperature at the location of the<br />
protected raceway. To calculate damage time:<br />
• Establish the fire endurance rating of the raceway (including degradation).<br />
• Use the FDT fire plume spreadsheet to calculate the plume temperature at the location of<br />
the protected raceway given the only the heat release rate of the original fire source (i.e.,<br />
no fire spread is assumed).<br />
<strong>0609</strong>, <strong>App</strong> F, <strong>Att</strong> 7 F7-6<br />
Issue Date: 02/28/05
" If the calculated plume temperature is less than the cable damage threshold, use one<br />
of the damage time analysis approaches that assume the cable is outside the fire<br />
source’s zone of influence.<br />
" If the calculated plume temperature equals or exceeds the damage threshold, record<br />
the calculated exposure temperature and continue with this analysis.<br />
• Using the cable damage time table (either A7.1 or A7.2) get the nominal damage time at the<br />
calculated exposure temperature. Divide this value by two.<br />
• Add the fire endurance rating plus one-half the damage time at the calculated exposure<br />
temperature.<br />
One cautionary statement is added for this case: If the predicted plume exposure temperature is<br />
very high (e.g., $1500°F), this may indicate that the protected raceway is engulfed in flames from<br />
the ignition source. In such cases, some additional consideration of barrier performance may be<br />
needed. The standard time-temperature exposure test used to certify such fire barriers does not<br />
consider direct flame impingement. Direct flame impingement may erode a fire barriers<br />
performance substantially. In such cases, it is recommended that additional guidance be sought<br />
from the fire protection staff at <strong>NRC</strong> headquarters.<br />
HGL Exposure Without Fire Spread:<br />
If the fire ignition source itself is sufficient to create a damaging HGL, the damage time is taken as<br />
the sum of three values; namely, the time required to create/reach a damaging HGL, the fire<br />
endurance time of the fire barrier system (after applying any degradation penalties) and the time<br />
to damage associated with the calculated temperature of the HGL. For this case, it is assumed that<br />
the minimum time required to create a damaging HGL is 10 minutes. To calculate damage time:<br />
• Establish the fire endurance rating of the fire barrier (including degradation).<br />
• Using the FDT HGL spreadsheet, check HGL temperature at 10 minutes.<br />
• If the temperature at 10 minutes equals or exceeds the damage threshold:<br />
" Record the calculated HGL temperature at 10 minutes,<br />
" Use the cable temperature - damage time lookup table (A7.1 or A7.2) to get damage<br />
time at the calculated HGL temperature (full value is used),<br />
" Total damage time is 10 minutes plus fire barrier endurance rating time plus time from<br />
cable damage time lookup table<br />
• If HGL temperature reaches damage threshold in greater than 10 minutes:<br />
" Determine the time required to achieve the damaging HGL using the FDT spreadsheet,<br />
• Total damage time is time to reach damage threshold plus barrier fire endurance time plus<br />
damage time from lookup table at the threshold temperature (i.e., either 28 or 30 minutes<br />
depending on cable type).<br />
HGL Exposure With Fire Spread:<br />
For this subcase, the fire ignition source alone is not sufficient to create a damaging hot gas layer.<br />
This case considers the potential (and timing) for fire spread to create a damaging hot gas layer.<br />
For this case, the damage time is taken as the sum of three time values; namely, the time required<br />
to create/reach a damaging HGL, the fire endurance time of the fire barrier system (after applying<br />
any degradation penalties) and the time to damage associated with the calculated temperature of<br />
the HGL. To calculate damage time:<br />
• Establish the fire endurance rating of the raceway (including degradation).<br />
Issue Date: 02/28/05 F7-7<br />
<strong>0609</strong>, <strong>App</strong> F, <strong>Att</strong> 7
• Use the FDT HGL tool to determine the HRR needed to get a damaging HGL in the room<br />
of interest (the required HRR):<br />
" Using FDT, input room parameters (dimensions, ventilation)<br />
" Adjust the fire HRR assumed in the spreadsheet until the HGL temperature at 10<br />
minutes equals the cable damage threshold temperature (i.e., 625°F or 400°F<br />
depending on cable type).<br />
" Record the required HRR value (refine value to no better than 50kW resolution).<br />
• Estimate the time to ignition of the first cable tray above the fire ignition source (i.e., in the<br />
same manner cable damage/ignition is calculated for FDS1 scenarios).<br />
• Use the cable fire spread - hot gas layer spreadsheet to calculate and record the time<br />
required for fire spread to create a fire of the required HRR.<br />
" Inputs are the required HRR, the HRR of the fire ignition source itself, the time to ignition<br />
of the first tray, number of trays in the vertical stack, and average or typical cable tray<br />
(or cable bundle) width.<br />
• Total fire damage time is: fire spread time to reach required heat release rate plus the fire<br />
endurance rating of the fire wrap plus one-half the damage time at a threshold exposure<br />
condition (i.e, one-half of either 28 or 30 minutes depending on cable type).<br />
Examples:<br />
Example 1: A particular cable tray containing thermoplastic cables is wrapped with a fire barrier<br />
system that has a nominal 1 hour fire endurance rating. The barrier system is degraded, and<br />
the degradation rating was “Moderate B.” Given the degradation, the 1 hour fire barrier fire<br />
endurance rating is reduced to 21 minutes (35% of the nominal performance rating). It was<br />
determined that the fire plume for a given fire ignition source creates a potentially damaging fire<br />
exposure condition with an exposure temperature of 245EC (475EF). The damage time at this<br />
exposure temperature taken from the Failure Time-Temperature Relationship for Thermoplastic<br />
Cables Table above is 15 minutes. Hence the net damage time for the protected cables is<br />
(21+15/2) = 28 minutes. (Note: The time to damage is rounded down to the nearest minute.)<br />
Example 2: A particular cable tray containing thermoplastic cables is wrapped with a fire barrier<br />
system that has a 20 minute fire endurance rating. The barrier system is not degraded, but<br />
failure of the protected cables could impact post-fire safe shutdown. It was determined that the<br />
fire plume for a given fire ignition source creates a potentially damaging fire exposure condition<br />
with an exposure temperature of 245EC (475EF). The damage time at this exposure<br />
temperature taken from the Failure Time-Temperature Relationship for Thermoplastic Cables<br />
Table above is 15 minutes. Hence the net damage time for the protected cables is<br />
(20+15/2) = 27 minutes. (Note: The time to damage is rounded down to the nearest minute.)<br />
Example 3: The licensee separation compliance strategy utilized a one-hour fire barrier wrap<br />
plus automatic detection and suppression. The fire suppression system was found to be highly<br />
degraded, and will not be credited in the analysis. The fire barrier is not degraded and will be<br />
given full credit in the analysis. One identified FDS2 scenario involves failure of the cables<br />
within the wrapped raceway. It was determined that a fire involving a particular fire ignition<br />
source can create a damaging plume exposure condition. The minimum time to fire damage<br />
for this FDS2 scenario is one hour. The damage time may be longer depending on the<br />
calculated hot gas layer temperature. If, for example, the hot gas layer calculated at ten<br />
minutes equaled 245EC (475EF), and the cables are thermoplastic, then the total damage time<br />
would be 10 minutes + 60 minutes + 15 minutes = 85 minutes.<br />
<strong>0609</strong>, <strong>App</strong> F, <strong>Att</strong> 7 F7-8<br />
Issue Date: 02/28/05
Fire Growth and Damage Time Analysis - FDS3 Scenarios<br />
Given the screening criteria used in Tasks 1.3.2 and 2.2.2, FDS3 fire scenarios will only be<br />
analyzed under very specific and limited conditions. FDS3 scenarios are relevant under one of the<br />
following three cases:<br />
• Any high degradation fire confinement finding,<br />
• A moderate degradation fire confinement finding that did not meet the finding screening<br />
criteria of Task 1.3.2, or<br />
• A finding other than fire confinement that did not meet the FDS3 screening criteria of Task<br />
2.2.2.<br />
These three cases are each treated somewhat uniquely.<br />
High Degradation Fire Confinement Finding<br />
For a high degradation fire confinement finding, a fire barrier separating two fire areas is assumed<br />
to provide no fire protection benefit. In this case, the only FDS fire scenario(s) being considered<br />
will be the FDS3 scenario(s).<br />
In this case, treat the two fire areas normally separated by the degraded fire barrier as a single<br />
expanded fire area.<br />
Define a set of FDS3 fire scenarios using the rules normally applied in to define FDS2 fire scenarios<br />
(see Step 2.5). Fire ignition sources in both fire areas are counted and considered to estimate fire<br />
frequency and in developing fire scenarios. All defined scenarios must involve damage to targets<br />
located in both fire areas.<br />
The newly defined FDS3 scenarios are evaluated using the same tools applied to FDS2 fire<br />
scenarios (see FDS2 scenario analysis guidance). All fire ignition sources existing in both fire<br />
areas are included in the fire analysis.<br />
Include credit for any fixed fire detection or suppression systems installed in either fire area using<br />
the general guidance already provided. For any given fire scenario credit no more than one fixed<br />
fire suppression system (i.e., credit only that fire suppression system that provides protection for<br />
the postulated fire ignition source).<br />
Moderate Degradation Fire Confinement Finding<br />
For a moderate degradation fire confinement finding the degraded fire barrier is given some credit<br />
for confining fires to the room of fire origin. In this case, the only fire scenario(s) being considered<br />
will be the FDS3 fire scenario(s).<br />
The fire endurance rating of the inter-compartment fire barrier is reduced to reflect the degradation<br />
(to either 65% or 35% of the nominal fire endurance rating for Moderate A and Moderate B<br />
respectively).<br />
Based on the screening rules used in Task 1.3.2, the fire areas being analyzed will also display the<br />
following characteristics (or else the finding would have screened to green in Phase 1):<br />
Issue Date: 02/28/05 F7-9<br />
<strong>0609</strong>, <strong>App</strong> F, <strong>Att</strong> 7
• The fire endurance rating of the degraded fire barrier is limited and implies further<br />
conditions:<br />
" At most, the fire endurance rating is less than 2 hours.<br />
" If the fire endurance rating of the degraded barrier is 20 minutes or more, then there<br />
are in-situ fire ignition sources or fire spread paths that can lead to direct flame<br />
impingement onto the degraded barrier. In this case, focus on these fire sources<br />
and fire growth scenarios.<br />
" If the fire endurance rating is less than 20 minutes, there are still potentially<br />
damaging fire ignition source present or the finding would have screened out in Step<br />
2.4 (no challenging fire scenarios).<br />
• Fixed fire suppression capability in the exposing fire area is limited, non-existent, or nonfunctional<br />
so fixed fire suppression in the exposing fire area will not credited:<br />
" A limited coverage system that does not cover all in situ combustible may exist. In<br />
this case, consider only the fire ignition sources not provided with suppression<br />
coverage and do not credit fixed suppression.<br />
" The fire area may have no fixed fire suppression capability, or<br />
" The installed fixed fire suppression system is highly degraded.<br />
• The exposed fire area does contain fire damage targets that are unique from those in the<br />
exposing fire area and:<br />
" Damage targets are exposed (un-protected), or<br />
" Damage targets are protected by passive fire barriers with an effective fire<br />
endurance rating of less than 20 minutes (this also covers the credit given a<br />
moderately degraded raceway fire barrier).<br />
Select/define no more than two fire ignition source / fire growth scenarios to represent all fires for<br />
the FDS3 fire scenario. If possible:<br />
• One scenario is chosen that will create a damaging HGL, and/or<br />
• One scenario is chosen that will lead to fire spread up to, and direct flame impingement on,<br />
the degraded fire barrier.<br />
If no fire scenario can be developed that satisfies one or both of these conditions, the FDS3 fire<br />
scenarios are deemed to be incredible, and the finding screens to green.<br />
Fire growth and damage times are estimated using the FDS2 analysis tools and rules. Determine<br />
the time required to:<br />
• Create a damaging HGL in the exposing fire area, and/or<br />
• To spread fire to the point where flames will directly impinge on the fire barrier (e.g., fire<br />
spread along a cable tray).<br />
Choose the one fire scenario that conservatively bounds these two cases in terms of the fire growth<br />
and damage times. The corresponding time is taken as the fire growth time.<br />
Assume the fire barrier will successfully confine any fire to the exposing fire area for a period equal<br />
to the degraded fire endurance rating. Add the effective fire endurance rating of the degraded fire<br />
barrier to the fire growth time.<br />
<strong>0609</strong>, <strong>App</strong> F, <strong>Att</strong> 7 F7-10<br />
Issue Date: 02/28/05
Add to this time the fire endurance rating for any raceway fire barriers protecting the targets in the<br />
exposed fire area.<br />
The result is the total fire damage time:<br />
(fire damage time) = (fire growth time)+(effective fire endurance rating for the inter-compartment<br />
fire barrier)+(effective fire endurance rating for raceway fire barriers in the<br />
exposed area if available).<br />
Continue to step 2.7 using the following assumptions:<br />
• Use the “All Events” manual suppression curve estimate fire non-suppression probability<br />
regardless of the fire ignition source.<br />
• Fixed fire suppression capability may be available in the exposed fire area and may be<br />
credited as follows:<br />
" If a non-degraded water-based automatic fire suppression system installed in the<br />
exposed fire area, and the system provides coverage in the area immediately<br />
adjacent to the degraded fire barrier, it will be credited for fire suppression prior to<br />
damage using the nominal reliability of 98% (0.02 failure probability) without explicit<br />
consideration of actuation timing.<br />
" If a moderately degraded water-based automatic fire suppression system is installed<br />
in the exposed fire area, and the system provides coverage in the area immediately<br />
adjacent to the degraded fire barrier, it will be credited for fire suppression prior to<br />
damage at a reduced reliability of 90% (0.1 failure probability) without explicit<br />
consideration of actuation timing.<br />
" No other fixed fire suppression capability in the exposed fire area will be credited.<br />
Findings Other than Fire Confinement<br />
For a finding other than fire confinement, the FDS3 fire scenario(s) will not be the only fire scenarios<br />
being analyzed. One or more FDS1 and FDS2 fire scenarios should already have been developed.<br />
FDS3 scenarios do not need to be considered for this case if the analysis:<br />
• Was unable to identify any credible FDS2 damage scenarios, and<br />
• Did not identify any FDS1 scenarios the could lead to direct flame impingement on the<br />
degraded fire barrier.<br />
If these conditions are met, proceed to Step 2.7. The FDS3 fire scenarios will not be considered<br />
credible and need not be further analyzed.<br />
Based on the screening rules used in Task 2.2.2, the exposing and exposed fire areas will also<br />
display the following characteristics (or else the finding would have screened to green in<br />
Phase 1):<br />
• The fire endurance rating of the inter-area fire barrier will be less than two hours, but the<br />
barrier should note be degraded and will be given full credit for containing fires to the<br />
exposing fire area for a time equal to the fire endurance rating.<br />
• There will be no non-degraded fixed fire suppression capability in either the exposing or the<br />
exposed fire area. Fixed fire suppression systems will not be analyzed.<br />
" No credit is given to a highly degraded water based system given.<br />
" A degraded gaseous system either (moderate or high) may be present but will not<br />
be credited in the FDS3 scenarios. Fixed fire suppression capability may be<br />
available in the exposed fire area.<br />
Issue Date: 02/28/05 F7-11<br />
<strong>0609</strong>, <strong>App</strong> F, <strong>Att</strong> 7
• The exposed fire area does contain exposed (un-protected) fire damage targets that are<br />
unique from those in the exposing fire area.<br />
One fire scenario will be selected to represent the FDS3 fire scenarios. The representative<br />
scenario will be chosen from the following cases:<br />
• Any FDS2 fire scenario associated development of a HGL.<br />
• Any FDS1 or FDS2 fire scenario that could result in direct flame impingement on the<br />
degraded fire barrier. If necessary, extend the fire spread time analysis to encompass fire<br />
spread up to the fire barrier (e.g., along a cable tray) if this was not already done for the<br />
selected scenario already.<br />
From the available scenarios meeting these criteria, select the scenario with the shortest FDS fire<br />
growth and damage time. This will be used as the representative fire growth time for the FDS3<br />
scenarios.<br />
Assume the inter-compartment fire barrier will successfully confine any fire to the exposing fire area<br />
for a period equal to the degraded fire endurance rating. Add the effective fire endurance rating<br />
of the inter-compartment fire barrier to the fire growth time.<br />
Add to this time the fire endurance rating for any raceway fire barriers protecting the targets in the<br />
exposed fire area.<br />
The result is the total fire damage time:<br />
(fire damage time) = (fire growth time)+(effective fire endurance rating for the inter-compartment<br />
fire barrier)+(effective fire endurance rating for raceway fire barriers in the<br />
exposed area if available).<br />
Continue to step 2.7. For FDS3 scenarios, use the manual suppression curve for the “All Events”<br />
category to estimate fire non-suppression probability regardless of the fire ignition source.<br />
<strong>0609</strong>, <strong>App</strong> F, <strong>Att</strong> 7 F7-12<br />
Issue Date: 02/28/05