People, Land & Water - USGS
People, Land & Water - USGS
People, Land & Water - USGS

Create successful ePaper yourself
Turn your PDF publications into a flip-book with our unique Google optimized e-Paper software.
THE U.S. DEPARTMENT OF THE INTERIOR<br />
<strong>People</strong>, <strong>Land</strong> & <strong>Water</strong><br />
April 2006 • Vol. 12 No. 13<br />
■ The Great 1906 Earthquake — A<br />
Moment of Magnitude for America<br />
and for Science<br />
■ Facing the Great Disaster — How<br />
the Men and Women of the U.S.<br />
Geological Survey Responded to<br />
the 1906 Earthquake<br />
■ Taking Seismic Science into<br />
the Third Dimension<br />
■ Did You Feel It? — Citizen<br />
Science Goes Seismic<br />
This Dynamic Planet — Special Poster Pullout
Message from Acting Secretary Lynn Scarlett<br />
One hundred years ago, a devastating earthquake changed the way the<br />
San Francisco Bay Area, Calif., and the United States think about the power<br />
and unpredictability of the planet on which we live. Although much of what<br />
we now know about earthquakes was learned after April 18, 1906, the U.S.<br />
Geological Survey was pondering seismic issues for over 25 years before the<br />
great quake.<br />
In fact, since its creation in 1879, the <strong>USGS</strong> has grown to become the nation’s<br />
largest water, earth, biological science and civilian mapping agency.<br />
The <strong>USGS</strong> collects, monitors, analyzes and provides scientifi c understanding<br />
about natural resource conditions, issues and problems.<br />
As part of these duties, the <strong>USGS</strong> plays a vital role in researching natural<br />
hazards and minimizing loss of life and property from the disasters they can<br />
lead to — from earthquakes to volcanic eruptions; from landslides and other<br />
forms of ground failure to geomagnetic storms; from fl oods, droughts, and<br />
coastal storms to wildfi res; from fi sh and wildlife diseases to invasive species.<br />
<strong>USGS</strong> science assesses where natural hazards may occur and what the risks<br />
are to those who live near these hazards.<br />
The <strong>USGS</strong> also works cooperatively with federal, state, tribal and local<br />
2 PEOPLE, LAND & WATER ★ April 2006<br />
Letter from P. Patrick Leahy<br />
Message from P. Patrick Leahy<br />
This special edition of <strong>People</strong>, <strong>Land</strong><br />
& <strong>Water</strong> commemorates the 100 th<br />
anniversary of the April 18, 1906,<br />
Great San Francisco Earthquake,<br />
which is deemed by many as the birth<br />
of earthquake science. Throughout<br />
the edition, you can enjoy stories<br />
about the history of seismology, survivor<br />
accounts, state-of-the-art developments<br />
in earthquake science, and<br />
profi les of <strong>USGS</strong> past and current<br />
premier earthquake scientists.<br />
The 1906 earthquake and subsequent<br />
fi re caused the loss of hundreds<br />
of lives, destroyed property and left<br />
approximately 225,000 people homeless.<br />
From that moment, scientists and the public realized a compelling need<br />
to better understand the dynamic — and potentially hazardous — nature<br />
of Earth’s seismic processes. Research began immediately, with scientists<br />
tackling what they saw before them — displacement of the ground along<br />
the San Andreas Fault.<br />
From those seminal efforts, science has evolved from studying the effects<br />
of earthquakes to discovering the dynamics of plate tectonics, developing<br />
probabilistic earthquake hazard assessments, and installing sophisticated<br />
Letter from Lynn Scarlett<br />
agencies to assist in emergency<br />
response efforts when catastrophes<br />
strike. <strong>USGS</strong> science provides<br />
information needed by<br />
the public to understand the<br />
hazards that may exist in their<br />
communities and to help mitigate<br />
losses and damages when<br />
they occur.<br />
<strong>USGS</strong> is now a world leader<br />
in the natural sciences thanks<br />
to its scientifi c excellence and<br />
responsiveness to society’s<br />
needs. Throughout this publication,<br />
you will see how one<br />
remarkable and terrible event<br />
in U.S. history did so much to bring the <strong>USGS</strong> to the forefront of earth science<br />
exploration and to bring natural hazard concerns to the forefront of the<br />
American consciousness.<br />
Lynn Scarlett<br />
Acting Secretary<br />
instrumentation deep into the San Andreas Fault itself. Earthquake monitoring<br />
has grown from days of analyzing reports of earthquake activity using<br />
calculations on globes with tape measures and compasses to a 24/7, global<br />
seismic network of seismographs, satellites and computers that capture and<br />
report earthquake events anywhere in the world almost instantaneously.<br />
Scientifi c research, monitoring and assessment have provided the framework<br />
for improving building codes to construct earthquake-resilient buildings<br />
and infrastructure. ShakeMaps, which graphically show the differing<br />
degrees of shaking from an earthquake, can be available online within minutes<br />
for use by emergency-response teams in deploying resources to areas<br />
hardest hit.<br />
We have built strong partnerships with government and non-government<br />
scientists, academia and other organizations throughout the world to delve<br />
deeper into the causes of earthquakes. The public, too, has contributed by<br />
answering the question posed on our Web site, www.usgs.gov, “Did You Feel<br />
It?” — a citizen-based approach to defi ning the magnitude of shaking in<br />
areas that lack dense instrumentation.<br />
Now, 100 years after the 1906 Earthquake, science and technology mark<br />
a milepost on a journey that has brought us far and will take us still further.<br />
Seismology is an example of science in the public service, relevant<br />
and keyed to making our lives safer. We are proud to provide you with this<br />
publication that shows where we’ve been and where we hope to go. We<br />
hope you enjoy it.<br />
P. Patrick Leahy<br />
U.S. Geological Survey
The 1906 Earthquake —<br />
The Birth of Earthquake Science<br />
4 A Moment of Magnitude for<br />
America and for Science<br />
7 <strong>USGS</strong> Responds to the 1906<br />
Earthquake<br />
7-10 A Letter Home and a Look Back<br />
in Time: Firsthand accounts from<br />
survivors<br />
7-11 America’s Shaky Past: The Top<br />
18 Earthquakes Since 1700<br />
11 Seismic Technology Evolves into<br />
the 21st Century: From dragonheads<br />
and toads to geophones<br />
and electronic amplifiers, seismic<br />
science has come a long way.<br />
12 History of the <strong>USGS</strong> Earthquake<br />
Hazards Program<br />
The <strong>People</strong> Who Make<br />
Earthquake Science Interesting<br />
13 “Mr. Earthquake” Takes a Bow:<br />
Waverly Person retires after 51<br />
years of service.<br />
15 Thinking Globally: Mary Lou<br />
Zoback guides the 1906<br />
Earthquake commemoration.<br />
28 Working for a Safer Southern<br />
California: Lucy Jones<br />
21 What it’s like to be an Earthquake<br />
Scientist: Ross Stein<br />
22-30 A Nationwide Notion of Pride:<br />
<strong>USGS</strong> earthquake scientists share<br />
their proudest, most exciting or<br />
most noteworthy career moments.<br />
17-20 Special Pullout: This Dynamic<br />
Planet Map — World Map of Volcanoes,<br />
Earthquakes, Impact Craters<br />
and Plate Tectonics<br />
The Present and Future<br />
of Earthquake Science<br />
14 NEIC: The world’s source for<br />
earthquake information<br />
11<br />
21<br />
22 The Advanced National Seismic<br />
System: A Sure Bet for a Shaky<br />
Nation<br />
This special edition of <strong>People</strong>, <strong>Land</strong> & <strong>Water</strong> commemorates the 1906 Earthquake, documents<br />
the birth and growth of earthquake science in the United States and demonstrates how this<br />
science is used to help safeguard communities.<br />
For more information about the U.S. Geological Survey, please visit http://www.usgs.gov.<br />
To go straight to our earthquake science page, visit http://earthquake.usgs.gov/.<br />
<strong>USGS</strong> stenographer Adelena M. Fontaine. Photo: George R. Davis family.<br />
32<br />
<strong>People</strong>, <strong>Land</strong>, & <strong>Water</strong> Special Issue<br />
This publication is the employee news magazine of the U.S. Department of the Interior. Its<br />
news content is developed by Interior bureaus and offices and coordinated by the Office of<br />
Communications (Office of the Secretary). The magazine is distributed through the U.S. Postal<br />
Service. For subscriptions, editorial contributions, Letters to the Editor, and other information:<br />
1849 C St. NW, ms6013-MIB, Washington, DC, 20240; (ph) 202-208-7291; (fax) 202-208-7854;<br />
e-mail: PLW@ios.doi.gov<br />
Clarice Nassif Ransom, Editor-in-Chief<br />
Tania Larson, Managing Editor<br />
Doug Spencer, Creative Direction<br />
Beth Stettner, Creative Direction and<br />
Editorial Assistant<br />
Cher Cunningham, Copy Editor<br />
Table of Contents<br />
The Interior Department manages 1 out of every 5 acres of land in the nation; provides resources<br />
for a third of U.S. domestic energy; works with 562 Indian tribes; provides water to 31 million<br />
residents through 824 dams and reservoirs; receives 450 million annual visits to 390 National<br />
Park System units, 544 wildlife refuges and vast areas of multiple use lands; provides opportunities<br />
for hunters and anglers; and works to improve habitat on public and private lands.<br />
Brian Waidmann, Publisher<br />
7<br />
P.K. Cascio, Front and Back Cover Design<br />
Will Stettner, This Dynamic Planet<br />
David Hebert and Susan Wells,<br />
Editorial Contributors<br />
Electronic Ink, Production & Graphics<br />
A special thank you to the following individuals for supporting this publication:<br />
Frank Quimby, Joan Moody, Teresa Rusnak and Donna Margelos of the U.S. Department<br />
of the Interior; and Barbara Wainman, Scott Harris, David Applegate and the Earthquake<br />
Hazards Program of the U.S. Geological Survey.<br />
26 Building Safer<br />
30 Not Just A California Thing: The<br />
eastern and central United States<br />
may be more vulnerable to earthquake<br />
damage than the West.<br />
31 Taking Seismic Science into<br />
the Third Dimension<br />
32 A Guidebook of San Andreas<br />
Fault Fieldtrips: <strong>USGS</strong> geologist<br />
Philip W. Stoffer beat the odds<br />
against cancer while writing a<br />
guidebook.<br />
33 Did You Feel It? Citizen Science<br />
Goes Seismic: Help the <strong>USGS</strong> and<br />
its partners save lives by logging<br />
in and reporting your earthquake<br />
experience.<br />
35 A Profusion of Products:<br />
Experience a virtual tour of the<br />
1906 Earthquake. Meet the<br />
Hayward Fault face to face. View<br />
the ground shaking of the 1906<br />
Earthquake. The <strong>USGS</strong> has a<br />
number of exciting events and<br />
products that commemorate the<br />
100 th anniversary of the 1906<br />
Earthquake.<br />
Other Stories<br />
16 Earthquakes that Trigger other<br />
Natural Hazards<br />
20 Earthquake Basics<br />
24 How the Trans-Alaska Pipeline<br />
Survived a Big One<br />
25 Measuring Magnitude<br />
29 Top 10 Tips to Earthquake<br />
Preparedness<br />
30 Aftershock Forecast<br />
26<br />
34 “Putting Down Roots in Earthquake<br />
Country”<br />
The historical photos on the cover of<br />
this special edition are courtesy of the<br />
California Historical Society. The newspaper<br />
photo is courtesy of the Library<br />
of Congress.<br />
April 2006 ★ PEOPLE, LAND & WATER 3
At 5:12 in the<br />
morning on<br />
April 18, 1906,<br />
the Bay Area<br />
was literally<br />
thrown from<br />
bed by what<br />
was dubbed<br />
“The Great<br />
San Francisco<br />
Earthquake”<br />
and has<br />
become the<br />
most famous<br />
earthquake in<br />
U.S. history.<br />
4 PEOPLE, LAND & WATER ★ April 2006
The Great San Francisco Earthquake<br />
A Moment of Magnitude for<br />
America and for Science<br />
By David Hebert<br />
In December 1904, a University of California<br />
at Berkeley geology professor named Andrew<br />
Lawson wrote the following in the university’s<br />
newspaper: “History and records show that<br />
earthquakes in this locality have never been of<br />
a violent nature, as so far as I can judge from the nature<br />
of recent disturbances and from accounts of past<br />
occurrences there is not occasion for alarm at present.”<br />
Less than two years later, he might have considered<br />
a retraction.<br />
At 5:12 in the morning on April 18, 1906, the Bay<br />
Area was literally thrown from bed by what was dubbed<br />
“The Great San Francisco Earthquake” and has<br />
become the most famous earthquake in U.S. history.<br />
Starting under the Pacifi c, just off the coast of the<br />
San Francisco peninsula, the magnitude-7.9 temblor<br />
grew until it had caused shaking and damage along<br />
nearly 300 miles of the then-unknown San Andreas<br />
Fault in Northern California. Strong shaking lasted for<br />
nearly a minute, and in some places along the fault,<br />
the earth moved more than 25 feet.<br />
For those who were there, it was surely a singular<br />
experience.<br />
“My sensations … were of being on ship in a gale<br />
pounding against the rocks, being thrown this way and<br />
that, then up in the air, and dropped with a sickening<br />
thud that took away my breath,” said Melissa Stewart<br />
McKee Carnahan in her 1908 book documenting<br />
her personal experiences of the earthquake. “It lasted<br />
twenty-eight seconds. Had it lasted ten seconds longer,<br />
I fear every building in San Francisco would have gone<br />
down.”<br />
As it was, 28,000 buildings were destroyed in San<br />
Francisco by both the earthquake and the subsequent<br />
fi re, which blazed for three days — the shaking had<br />
damaged the city’s water lines, rendering the fi re department<br />
ineffective.<br />
Throughout Northern California, at least 3,000<br />
people were killed (most in San Francisco and many<br />
in the fi re); and of San Francisco’s some 400,000 residents,<br />
about 225,000 lost their homes. Damage losses<br />
have been estimated at more than $500 million (1906<br />
dollars).<br />
A repeat of this quake today would likely lead to<br />
thousands of deaths and possible economic losses in<br />
the hundreds of billions of dollars.<br />
“This bombardment of nature caused greater destruction<br />
in the number of seconds it lasted than the most<br />
modern engines of war could accomplish in the same<br />
number of weeks,” Carnahan said. “From whence did<br />
this tremendous force originate?”<br />
For all the horror of this earthquake’s destruction,<br />
it’s this last question that might lend the disaster its<br />
lasting signifi cance.<br />
Continued on page 6<br />
April 2006 ★ PEOPLE, LAND & WATER 5
Continued from page 5<br />
Before April 18, 1906, knowledge of earthquakes —<br />
how and where they occur and the hazards they pose —<br />
was relatively little. However, that was about to change.<br />
“While the 1906 earthquake marked a seminal event<br />
in the history of California, it can also be remembered<br />
as the birth of modern earthquake science in the United<br />
States,” said Mary Lou Zoback, a senior research geologist<br />
with the U.S. Geological Survey (<strong>USGS</strong>), in an April<br />
2006 article for GSA Today. “It was the first time that<br />
an earthquake was recognized and documented as the<br />
result of a recurring tectonic process of strain accumulation<br />
and release.”<br />
Much of that recognition and documentation was<br />
the work of Professor Lawson, whose ironic statement<br />
in 1904 about the relative lack of seismic hazards in the<br />
Bay Area underscored the need for scientific study and<br />
understanding.<br />
With Lawson as its leader, a group of scientists and<br />
engineers documented the physical characteristics of<br />
the 1906 earthquake’s faulting throughout California<br />
and published The Report of the State Earthquake Investigation<br />
Committee, volume I, in 1908. This report also<br />
included reports on shaking intensity and an atlas of 40<br />
maps and folios.<br />
A second volume of the report was published in 1910<br />
under the editing of Harry Fielding Reid. This volume<br />
focused on the earthquake’s seismological and mechanical<br />
traits, and it was from this research that Reid created<br />
the elastic-rebound theory of earthquake sources — the<br />
primary model of the earthquake cycle even today.<br />
“H.F. Reid’s work is one of the seminal studies of earthquake<br />
science in the 20th century,” said Ross Stein, a<br />
<strong>USGS</strong> geophysicist.<br />
“Their exhaustive data and thoughtful conclusions<br />
led to a number of new discoveries about the cause and<br />
effects of earthquakes,” said Zoback of both volumes as<br />
6 PEOPLE, LAND & WATER ★ April 2006<br />
“<br />
While the 1906<br />
earthquake<br />
marked a seminal<br />
event in the history<br />
of California,<br />
it can also be<br />
remembered as<br />
the birth of modern<br />
earthquake science<br />
in the United States.<br />
It was the first time<br />
that an earthquake<br />
was recognized<br />
and documented<br />
as the result of a<br />
recurring tectonic<br />
process of strain<br />
accumulation and<br />
release.<br />
“<br />
— Mary Lou Zoback<br />
Photo courtesy California Historical Society<br />
well as a complementary report published by the <strong>USGS</strong><br />
in 1907.<br />
And these discoveries and observations still fuel<br />
seismic science nearly 100 years later.<br />
“There is still much to be gained from study of the<br />
1906 report, in spite of the fact that it is nearly a century<br />
old and in spite of the great increases in our understanding<br />
of the San Andreas Fault since the time of its publication,”<br />
said <strong>USGS</strong> geologist Carol Prentice in a 1999<br />
paper. “The 1906 report continues to supply information<br />
for modern studies in geology, geodesy and seismology.”<br />
The importance of continuing seismic research<br />
becomes apparent when one considers that a powerful<br />
earthquake is bound to happen again — a <strong>USGS</strong>-led<br />
study published in 2003 places a 62-percent probability<br />
on an earthquake of magnitude 6.7 or larger occurring in<br />
the Bay Area before 2032.<br />
With that sort of likelihood looming, earthquake hazard<br />
science and mitigation by the <strong>USGS</strong> and its partners<br />
are vital to the safety and welfare of those living in the<br />
Bay Area as well as the United States’ other seismically<br />
active places.<br />
To ponder future possibilities, however, one should<br />
also peer into America’s shaky past. In the relatively<br />
short time since its colonization and independence, the<br />
nation has seen many moments of major magnitude,<br />
including April 18, 1906.<br />
Over the next several pages, you can find a narration of<br />
how <strong>USGS</strong> scientists in and near the Bay Area responded<br />
to the earthquake as well as firsthand accounts from<br />
others who were there.<br />
A brief but significant seismic history of the United<br />
States can also be found along the bottom of the next<br />
several pages in the accounts of 18 such earthquake<br />
events, beginning in 1700.<br />
For more information on the 1906 earthquake, visit<br />
http://quake.usgs.gov/info/1906/index.html.<br />
Photo courtesy California Historical Society
Facing the Great Disaster:<br />
<strong>USGS</strong> Responds to the Earthquake<br />
By Liz Colvard and James Rogers<br />
In 1906, the only permanent<br />
U.S. Geological Survey<br />
(<strong>USGS</strong>) office in California<br />
was the Pacific Region Topographic<br />
Mapping Office in<br />
Sacramento, some 70 miles up the<br />
Sacramento River from San Francisco<br />
Bay. The office had been established<br />
just three years earlier and was the only<br />
<strong>USGS</strong> office ever created for the sole<br />
function of topographic mapping. On<br />
April 18, 1906, many of the <strong>USGS</strong> topographers<br />
were in Sacramento preparing<br />
for summer fieldwork. It was that<br />
day that the great earthquake struck.<br />
Although a small amount of shaking<br />
was felt in Sacramento, detailed information<br />
about the earthquake was slow<br />
to reach the residents there. Before the<br />
full extent of the damage was known,<br />
<strong>USGS</strong> topographic engineer George R. Davis, fearful<br />
that his 62-year-old father, Edward Davis, was caught up<br />
in the earthquake devastation, left Sacramento on the<br />
first train bound for San Francisco. “He was very worried.<br />
The phones were down and he wasn’t sure whether or<br />
not the hotel his father was living in was damaged,” says<br />
George Davis’ daughter Anna Davis Rogers, now 88 years<br />
old, recalling stories she heard of these events while growing<br />
up. “Fortunately [the hotel] hadn’t fallen down.”<br />
Davis, a tall man with a quiet demeanor and a dry<br />
wit, was accompanied to San Francisco by fellow <strong>USGS</strong><br />
topographer Clarence L. Nelson. Both were 29 years<br />
old and in excellent physical condition after a year spent<br />
mapping the Mt. Whitney quadrangle, which features<br />
some of the most rugged terrain in the conterminous<br />
United States.<br />
Upon their arrival in San Francisco, the pair was fortunate<br />
to find the elder Davis unharmed at the hotel where<br />
he had been living. Nelson had brought his camera to get<br />
photographs while things were still “hot” and began taking<br />
what would become a memorable set of images. The<br />
three men wandered through San Francisco all night and<br />
the following morning, moving from one dramatic scene<br />
America’s Shaky Past - The Top 18 Earthquake Events in the United States Since 1700<br />
This Japanese map shows the<br />
Kuwagasaki Coast, an area<br />
affected by the tsunami in 1700.<br />
This 19th-century illustration depicts<br />
the damage and chaos resulting<br />
from the 1811-1812 New Madrid<br />
earthquakes.<br />
Date: Jan. 26, 1700<br />
Magnitude: 9.0<br />
Damage: A resulting tsunami<br />
destroyed villages in the Pacific<br />
Northwest of the United States and<br />
damaged coastal areas in Japan, as<br />
New Madrid, Mo.<br />
Dates: Dec. 16, 1811; Jan. 23, 1812;<br />
Feb. 07, 1812<br />
Magnitude: All estimated to be in an<br />
approximate range from 7.5 to 8.0<br />
Damage: Structures collapsed or were<br />
damaged from Cincinnati to St. Louis;<br />
New Madrid was destroyed in the<br />
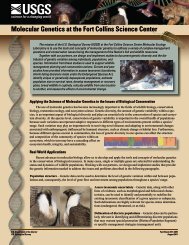
Left to right: Robert B. Marshall (back to camera), A.I. Oliver, Albert H. Sylvester,<br />
Sidney N. Stoner, George R. Davis and A.B. Searle in the <strong>USGS</strong> Pacific Region<br />
Topographic Mapping office, circa 1904-1905. Marshall, Sylvester, Stoner, Davis,<br />
and Searle were all part of the <strong>USGS</strong> group that took the first boatload of relief<br />
supplies down the Sacramento River to San Francisco following the 1906 earthquake.<br />
Photo: George R. Davis family.<br />
Cascadia Subduction Zone (from British Columbia to Northern California)<br />
to the next. Nelson captured the horse-mounted dynamite<br />
squad, soldiers marching out from the Presidio and a rare<br />
scene of two horse-drawn fire engines with one engine<br />
drawing water from a cistern on Union Street. One ironic<br />
photograph shows refugees wending their way through<br />
rubble-filled streets in the direction of a wrecked City<br />
Hall. Flames of the burning district shone brightly against<br />
the darkness, and Nelson captured the surreal glow in several<br />
of his photographs, including one of Union Square<br />
with the Breuners building burning in the background.<br />
<strong>USGS</strong> Topographers Swing into Action<br />
Because of its proximity to the Bay Area, Sacramento<br />
— a growing capital city of 31,000 — figured prominently<br />
in early relief efforts. At a mass meeting on the<br />
Sacramento courthouse steps the morning of April 19,<br />
citizens cheered when Sacramento’s ad hoc General Relief<br />
Committee declared that they would not wait to be<br />
asked to help and that a riverboat had already been secured<br />
to transport supplies to San Francisco at the earliest<br />
opportunity.<br />
geologic evidence corroborated by<br />
Native American oral traditions and<br />
Japanese written records indicate. The<br />
dollar amount of property losses is<br />
not known.<br />
Number of deaths: unknown<br />
Feb. 7 earthquake. Areas in Arkansas,<br />
Illinois, Kentucky, Missouri and<br />
Tennessee experienced landslides,<br />
land uplifted and trees destroyed. At<br />
area rivers, banks collapsed, islands<br />
disappeared and waves overwhelmed<br />
or beached boats. The dollar amount<br />
of property losses is not known.<br />
Number of deaths: unknown<br />
Continued on page 8<br />
Taken in 1935, this image shows<br />
the ruins of the first La Purísima<br />
Concepción Mission near Lompoc,<br />
Calif.<br />
Date: April 2, 1868<br />
Magnitude: 7.9<br />
Dates: Dec. 8 and Dec. 21, 1812<br />
Magnitude: ~7.5 and 7.1<br />
Damage: These potentially related<br />
earthquakes damaged several missions,<br />
including the Mission San<br />
Juan Capistrano, where the church<br />
Damage: The earthquake and resulting tsunami and<br />
landslides destroyed homes, a large church and warehouses.<br />
The dollar amount of property losses is not<br />
A Letter Home<br />
Earthquake Survivor Percy<br />
J. Holmes Recalls the<br />
Historic Day’s Events<br />
(This letter was published in a Connecticut newspaper,<br />
May 1906. Percy J. Holmes was the grandfather<br />
of the wife of John Filson, <strong>USGS</strong> emeritus.)<br />
Merchant E. F. Hawley hands us the following letter<br />
from Percy J. Holmes, son of Joshua Holmes of Shelton:<br />
2550 Pacific Avenue, San Francisco, Cal., April 26,<br />
1906.<br />
Dear Mother:<br />
Your letter arrived this morning and I will answer it immediately.<br />
It is noon now and the first chance to have had<br />
to write to you since the earthquake. I tried everywhere<br />
in ’Frisco to send you a telegram, but could not get one<br />
off until Saturday, when Mrs. Magee went to Oakland.<br />
I gave her a telegram to send to you saying that Uncle<br />
William’s family and I were all well.<br />
The quake was a great one. It happened at 5:13 a.m.<br />
and I was fast asleep, but was awakened by an awful roar<br />
and shaking. The whole house was shaking and I thought<br />
it was going to fall to pieces. I jumped out of bed and ran<br />
into the yard, but the bricks were falling so fast there that I<br />
“ducked” back into my room and slipped into my clothes.<br />
By that time the shake was over and I had to climb over<br />
about two feet of fallen bricks to gain the street.<br />
The house next to ours was a brick one, in the course<br />
of construction. It was three stories, and the top story was<br />
shaken down, depositing about two tons of bricks into<br />
our driveway. All the streets were full of bricks, as the<br />
chimneys of the houses were all shaken down. About five<br />
minutes later we had another shock, not as heavy as the<br />
first and we have had slight shocks at long intervals, ever<br />
since. Yesterday we had another severe shock, and most<br />
everyone ran into the streets again, expecting a repetition<br />
of the first.<br />
Magee’s house stood the shock finely, and with the exception<br />
of two of the chimneys, that were shaken down, it<br />
received very little damage.<br />
The first shock was a “peach” all right. I was not badly<br />
frightened until after it was all over. The first thing I<br />
thought of was “I’m sorry for the people near Vesuvius,”<br />
but about five minutes after the shock I found myself<br />
trembling like a leaf, and felt as though I was freezing.<br />
You cannot imagine how terrible everything shook. I always<br />
thought that an earthquake was a rolling motion of<br />
the ground, but that one felt as though you rode a bicycle<br />
down a long flight of stairs. The sensation is terrible, a<br />
person feels so helpless; in fact you are nearly helpless,<br />
as the only thing you can do is to run to the nearest open<br />
place.<br />
Wrightwood and Ventura, California<br />
Ka’u District, Hawaii<br />
Continued on page 10<br />
collapsed during mass. The Dec. 21<br />
earthquake destroyed the Mission La<br />
Purisima Concepcion, near presentday<br />
Lompoc, Calif. The dollar amount<br />
of property losses is not known.<br />
Number of deaths: 41 (40 in the San<br />
Juan Capistrano collapse)<br />
known. More recently, the magnitude-7.2 Kalapana,<br />
Hawaii, earthquake in 1975 led to a local tsunami of<br />
more than 40 feet.<br />
Number of deaths: 77 (tsunami, 46; landslide, 31)<br />
April 2006 ★ PEOPLE, LAND & WATER 7
A Look Back in Time<br />
An Interview with a Survivor of the 1906<br />
San Francisco Earthquake<br />
(Excerpts reprinted from “Earthquake Information Bulletin”<br />
May-June 1977, Volume 9, Number 3)<br />
By: Henry Spall<br />
Bert L. Smith, Jr., was born in Eureka, Nev., and was in the Palace<br />
Hotel, San Francisco, at the time of the great earthquake of 1906. Now<br />
retired, he lives with his wife, Emily, in Santa Rosa, Calif., 45 mi north<br />
of San Francisco. From 1926 to his retirement in 1966, he had various<br />
assignments in the field of agriculture with such organizations as the U.S.<br />
Department of Agriculture and State and Federal farm and water agencies.<br />
For 18 yr he was involved with the Commonwealth Club of California and<br />
has been a Regent of the University of California.<br />
H.S. What brought your family to San Francisco on April 18, 1906?<br />
Smith. First let me back up a little. My mother’s family founded Centennial,<br />
Wyo. My father’s family was in the woolen business in Massachusetts.<br />
My father decided to come out West with his brother, and he landed<br />
in Wyoming long enough to work in the bank and marry my mother. After<br />
a short time in Mexico, my parents followed the mining boom into Nevada.<br />
You have to understand that in those days mining was either boom<br />
or bust.<br />
H.S. Where were you living in 1906?<br />
Smith. Eureka, Nev. My father was in banking and had various interests<br />
in the mining business. The year 1906 was a good one, and my father was<br />
enjoying a period of temporary affluence. So we decided to visit San Francisco<br />
for the shopping, but largely so my parents could go to the Opera and<br />
hear the great Italian tenor, Enrico Caruso.<br />
H.S. And you stayed at the Palace Hotel?<br />
Smith. Of course. That was what you did in those days if you were affluent.<br />
Caruso stayed there, too — although we didn’t see him. We brought 1<br />
or 2 trunks with us, rather more modest than the 200 trunks we were told<br />
that Caruso had brought with him.<br />
H.S. What happened at 5:18 am the next morning?<br />
Smith. Well, of course, it was dark at the time. I remember distinctly<br />
being awakened by the earthquake — and the shock, the terror of it all.<br />
And the efforts of my mother to calm us children as best she could. Then,<br />
we heard the panic from the room next door where our friends, the George<br />
Bartletts, were staying. They couldn’t get to their children in an adjoining<br />
room because the earthquake had jammed the door shut.<br />
H.S. What did your family do then?<br />
Smith. Well, you must remember that I was a small child at the time,<br />
and at the age you don’t recall all the minute details. But several distinct<br />
memories have stuck in my mind. I recall being dressed on the bottom<br />
steps of the magnificent stairway in the lobby of the hotel. There was fallen<br />
plaster from the ceiling all around us, and I couldn’t help wondering if the<br />
chandeliers were going to fall, too.<br />
One of my most vivid memories was of my mother with her hair uncombed<br />
and not braided around her head as she usually had it. That made<br />
a distinct impression on me.<br />
I recall the discussions about if the Palace would burn and when it<br />
would burn. As you know, it survived the earthquake rather well, but it<br />
burned down later as the fire swept through the city. The answer from the<br />
hotel manager was that despite the very latest fire-prevention measures in<br />
the hotel, he thought it was probably going to burn. Perhaps because of this<br />
he gave us all our room keys as mementos.<br />
H.S. What then?<br />
Smith. We moved out of the hotel, and I recall our family riding on a<br />
wagon to Golden Gate Park. Here we lived for a few days in the tents that<br />
the Army had provided. We didn’t have anything. All we had were the<br />
clothes we had walked out of the hotel with. At Golden Gate Park, I recall<br />
seeing the soldiers and the discussions about whether they were going to<br />
dynamite to try to check the fire.<br />
Eventually the family was able to get on a train (at the station at Third<br />
and Townsend) to San Jose and then go up the east side of the Bay to<br />
Berkeley. Here we stayed with the Dewey Powell family for a few days until<br />
we were back on our feet and could return to Nevada.<br />
In those days it used to be up over the hill on Southern Pacific, then<br />
This home was damaged in the magnitude-<br />
6.9 earthquake on the Hayward Fault on<br />
Nov. 21, 1868.<br />
This aerial image looks west toward the<br />
Sierra Nevada Mountains across Owens Valley,<br />
Calif., where an earthquake on March 26,<br />
1872, caused heavy damage to the town of<br />
Lone Pine.<br />
Continued on page 9<br />
Date: Nov. 21, 1868<br />
Magnitude: ~7.0<br />
Damage: Communities along<br />
the Hayward Fault and in San<br />
Francisco and San Jose, Calif.,<br />
Date: March 26, 1872<br />
Magnitude: 7.4<br />
Damage: This earthquake on the<br />
eastern side of the Sierra Nevada<br />
Mountains caused the destruction<br />
of more than 50 houses in nearby<br />
8 PEOPLE, LAND & WATER ★ April 2006<br />
As instructed in a telegram from <strong>USGS</strong> Director<br />
Charles D. Walcott, Robert B. Marshall, the geographerin-charge<br />
of the <strong>USGS</strong> Topographic Mapping Office in<br />
Sacramento, announced to the Relief Committee that<br />
the <strong>USGS</strong> stood ready to send a complete outfit of camp<br />
property, horses, wagons and men sufficient to take care<br />
of 500 people and that he could be ready to leave that<br />
day. The offer was gratefully accepted, and Marshall was<br />
assigned to take charge of purchasing additional supplies,<br />
using the more than $50,000 in donations collected that<br />
day from the citizens of Sacramento.<br />
“Men in the Sacramento office … hurried to the warehouses<br />
and packed blankets, tents, cooking stoves and<br />
utensils, folding tables, chairs, axes, picks, shovels and<br />
much other equipment. [They] loaded the big camp wagons,<br />
buckboards, and hitched teams to water tank wagons<br />
and brought them all to the wharf in Sacramento,” wrote<br />
<strong>USGS</strong> stenographer Adelena<br />
Marie Fontaine.<br />
In addition, Marshall bought<br />
large quantities of canned<br />
goods, milk, baby food, soup<br />
and other prepared food. At<br />
his request, a factory ran all<br />
night producing crackers and<br />
cookies. Marshall and the other<br />
<strong>USGS</strong> topographers soon<br />
had an old stern-wheeler, San<br />
Joaquin, “loaded to the waters<br />
edge with relief supplies.”<br />
At some point during the<br />
night of the 19 th , the San<br />
Joaquin began its trip down<br />
the Sacramento River toward<br />
San Francisco. Aboard were<br />
Marshall; topographers A. Benson<br />
Searle, Sidney Stoner and<br />
Albert H. Sylvester; and field<br />
assistant Jake W. Muller. George Davis and Clarence<br />
Nelson were also on board. (After relocating the elder<br />
Davis in a hotel in Oakland and returning to Sacramento<br />
by train, the pair was informed that the San Joaquin was<br />
about to depart along with their <strong>USGS</strong> colleagues. The<br />
two decided to embark as well — their second trip to the<br />
beleaguered city in 48 hours.) The boat was accompanied<br />
by a barge under the direction of Almerin Sprague,<br />
the father of Sidney Stoner’s fiancée, Marjorie Sprague.<br />
The barge carried wagons, horses and water barrels.<br />
At 8 a.m. on the morning of April 20, the San<br />
Joaquin, with its load of relief supplies and <strong>USGS</strong> topographers,<br />
landed at the Presidio of San Francisco, where<br />
it was greeted with cheers. The military officer who met<br />
the boat immediately asked about baby food and milk<br />
and was overjoyed by Marshall’s reply of “a carload.”<br />
Volunteer stevedores, soldiers and citizens assisted the<br />
Hayward, California<br />
suffered an estimated $300,000<br />
(1868 dollars) in property damage.<br />
Before 1906, this was known<br />
as the “Great San Francisco<br />
Earthquake.”<br />
Number of deaths: 30<br />
Owens Valley, California<br />
Lone Pine, Calif., and there were<br />
other reports of buildings collapsing,<br />
resulting in approximately<br />
$250,000 (1872 dollars) damage.<br />
Number of deaths: 27<br />
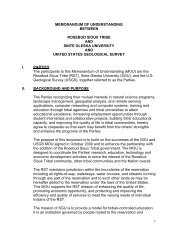
<strong>USGS</strong> topographer George R. Davis (standing) in the<br />
field, circa 1908. Davis rushed to San Francisco after<br />
the earthquake on April 18, 1906, to look for his father,<br />
who was living there in a hotel. Photo: George R. Davis<br />
family.<br />
Parts of Charleston, S.C., lie in ruin after the<br />
earthquake on Aug. 31, 1886.<br />
( Photo J.K. Hillers)<br />
These are the remains of Jefferson Junior High<br />
in Long Beach, Calif., following the earthquake<br />
on March 10, 1933.<br />
<strong>USGS</strong> men in unloading the shipment.<br />
By this time, uncontrolled fires and continuous<br />
dynamiting had filled the air of San Francisco with heat,<br />
smoke and dust, making it unpleasant to breathe. Davis<br />
and Nelson attempted to renew their exploration of the<br />
ravaged city before the boat’s return trip but were unable<br />
to bear the conditions for long. At one point, they<br />
quenched their thirst with cans of tomatoes found in an<br />
abandoned grocery store.<br />
Staffers Work Overtime Aiding Refugees<br />
Back in Sacramento, the women of the <strong>USGS</strong> family<br />
were hard at work. Stenographer Adelena Fontaine,<br />
Marjorie Sprague and the wives of Robert Marshall and<br />
Albert H. Sylvester volunteered to assist the Sacramento<br />
Women’s Council as they processed thousands of refugees<br />
from San Francisco. “I worked on [the] general Relief<br />
Committee several nights,<br />
meeting trains crowded to the<br />
doors with refugees,” wrote<br />
Fontaine. “We fed them,<br />
clothed them, took them to<br />
friends if they had any, and<br />
those who were destitute we<br />
assigned to the homes in the<br />
city whose doors had kindly<br />
been opened to welcome the<br />
unfortunates.”<br />
Fontaine recounted the<br />
story of one refugee, a young<br />
man of about 20, whose brother<br />
was mistaken for a looter<br />
and shot to death. “[He was]<br />
endeavoring to extricate his<br />
brother and their belongings<br />
from the hotel where they had<br />
lived, [and] saw his brother<br />
shot down before his eyes by<br />
a soldier. The soldier had made a mistake, and the boy<br />
was not stealing. This young refugee was a telegraph operator<br />
and volunteered his services [until] the building<br />
was abandoned; [he then] fled before the flames,” wrote<br />
Fontaine. “He was in a dreadful state from exhaustion,<br />
hunger and exposure.”<br />
Mapping the Fault<br />
The topographers in Sacramento were not the<br />
only <strong>USGS</strong> employees working in the vicinity of San<br />
Francisco. By great coincidence, eminent <strong>USGS</strong><br />
geologist Grove Karl (G.K.) Gilbert had been in<br />
Berkeley (7 miles across the Bay from San Francisco)<br />
studying sedimentation and the effect of hydraulic goldmining<br />
debris in the Sacramento River. A vigorous 63<br />
years old in 1906, Gilbert was considered one of the top<br />
field and experimental geologists of his day. He was one<br />
Date: Aug. 31, 1886<br />
Magnitude: 7.3<br />
Damage: Many of the buildings<br />
in and around Charleston were<br />
damaged or destroyed, and railroad<br />
tracks around the city were<br />
Date: March 10, 1933<br />
Magnitude: 6.4<br />
Damage: Property loss was<br />
estimated at $40 million (1933<br />
dollars), as some sections of<br />
Charleston, South Carolina<br />
twisted and shifted. Property<br />
damage was estimated at $5 to<br />
$6 million (1886 dollars).<br />
Number of deaths: 60<br />
Long Beach, California<br />
southern Los Angeles County<br />
and northern Orange County<br />
were almost totally destroyed.<br />
Number of deaths: 115
of the first five principal geologists hired by the <strong>USGS</strong><br />
when it was created in 1879 and served as its first “chief<br />
geologist.” His scientific reports are considered some of<br />
the best geologic papers ever written.<br />
Gilbert wrote of his experiences on the morning of<br />
April 18: “It is the natural and legitimate ambition of a<br />
properly constituted geologist to see a glacier, witness an<br />
eruption and feel an earthquake. … When, therefore,<br />
I was awakened in Berkeley on the eighteenth of April<br />
last by a tumult of motions and noises, it was with unalloyed<br />
pleasure that I became aware that a vigorous earthquake<br />
was in progress. … In my immediate vicinity the<br />
destructive effects were trivial, and I did not learn until<br />
two hours later that a great disaster had been wrought on<br />
the opposite side of the bay and that San Francisco was<br />
in flames.”<br />
As soon as regular ferry<br />
traffic to San Francisco was<br />
restored, Gilbert traveled<br />
across the Bay to observe the<br />
fires and the results of the<br />
earthquake firsthand. “The<br />
flames work with wonderful<br />
speed. While I lingered,<br />
whole squares were consumed.<br />
An hour is probably<br />
enough to raze a square of<br />
wooden houses.”<br />
Gilbert’s assistant in<br />
Berkeley was 32-year-old<br />
François E. Matthes, a native<br />
of the Netherlands<br />
and a highly accomplished<br />
<strong>USGS</strong> topographer and geomorphologist.<br />
The <strong>USGS</strong><br />
sent Matthes to California<br />
in 1905 for the express purpose<br />
of mapping Yosemite<br />
Valley. Matthes had garnered<br />
praise for his topographic map of the upper half<br />
of the Grand Canyon, which is one of the finest planetable<br />
maps produced by the <strong>USGS</strong>. While Matthes was<br />
between field seasons in Yosemite, Gilbert hired him to<br />
research scientific articles that were written in Dutch<br />
and French.<br />
Matthes, too, was jolted awake on April 18 by the earthquake:<br />
“Woke up 5 a.m. by violent earthquake, lasting 28<br />
seconds. Found on getting up San Francisco enveloped<br />
in flames. Severe quake 8:15 while eat[ing] breakfast…<br />
Made tour of inspection of Berkeley; found brick chimneys<br />
demolished by the wholesale; many brick houses<br />
badly damaged. All day long dynamite blasts are heard<br />
from the city… Fire rages all night.”<br />
There was no lack of scientific interest in the earthquake.<br />
Geologists and other scientists quickly flocked<br />
This political clubhouse in Hilo, Hawaii, was<br />
shattered by the earthquake-generated<br />
tsunami on April 1, 1946. (Photo: NOAA)<br />
Residents of Tehachapi, Calif., fill the streets<br />
after the earthquake on July 25, 1952.<br />
Date: April 1, 1946<br />
Magnitude: 8.1<br />
Damage: This earthquake generated<br />
a tsunami that struck Alaska,<br />
Hawaii and the west coasts of<br />
North and South America, causing<br />
Date: July 25, 1952<br />
Magnitude: 7.3<br />
Damage: The nearby towns of<br />
Arvin, Bakersfield and Tehachapi<br />
suffered extensive damage, and<br />
structures as far away as San<br />
Diego and Las Vegas (both more<br />
Aleutian Islands, Alaska<br />
to the area. Local geologists gravitated around Andrew<br />
C. Lawson, chairman of the geology department at<br />
the University of California at Berkeley, and John C.<br />
Branner, professor of geology at Stanford University,<br />
both of whom worked part time for the <strong>USGS</strong>.<br />
Three days after the earthquake, the governor of<br />
California appointed the California State Earthquake<br />
Investigation Commission, chaired by Lawson, to oversee<br />
and consolidate all of the scientific investigations.<br />
Gilbert was one of eight men assigned to the commission.<br />
Only Gilbert and one other had any experience<br />
with earthquake research. The commission ultimately<br />
brought together more than 21 scientists, architects<br />
and engineers to examine the earthquake. This included<br />
several members of Japan’s Imperial Earthquake<br />
Investigating Committee,<br />
considered at the time to<br />
be a leading authority on<br />
earthquake research. The<br />
commission primarily focused<br />
on studying surface<br />
changes caused by the<br />
earthquake, earthquake intensity,<br />
earthquake arrival<br />
times and the geophysics<br />
of the earthquake. Gilbert<br />
wrote several reports about<br />
the earthquake, and both he<br />
and Matthes took many postearthquake<br />
photographs.<br />
The Earthquake Commission<br />
quickly appropriated<br />
the services of François<br />
Matthes by sending him<br />
into the field to examine<br />
the effects of the earthquake<br />
north of San Francisco.<br />
He later mapped the<br />
trace of the San Andreas<br />
Fault through the northern part of the state. His maps<br />
were included in an atlas published by the commission,<br />
and his field observations were incorporated into the<br />
commission’s final report.<br />
The <strong>USGS</strong> and the Army Corps of Engineers collaborated<br />
on a separate federal investigation of the earthquake’s<br />
effects on buildings and construction materials.<br />
Richard L. Humphrey from the structural materials<br />
division was the primary <strong>USGS</strong> representative on the<br />
team. He was dispatched to San Francisco one day after<br />
the earthquake. Gilbert contributed an overview of the<br />
earthquake to the team’s report.<br />
It’s difficult to know what long-term impact the events<br />
of 1906 may have had on the <strong>USGS</strong> employees involved<br />
with it. They were all ordinary people who responded to<br />
a natural disaster in extraordinary ways.<br />
Kern County, California<br />
more than $26 million (1946 dollars)<br />
in damage (mostly in Hawaii).<br />
Number of deaths: 165 (all tsunami-related:<br />
149 in Hawaii; 5 in<br />
Alaska; 1 in California)<br />
than 200 miles from the epicenter)<br />
were damaged. Property loss was<br />
estimated at $60 million (1952<br />
dollars).<br />
Number of deaths: 12 (on Aug. 28,<br />
1952, an aftershock caused two<br />
more deaths)<br />
This road was<br />
broken by<br />
a landslide<br />
caused by the<br />
earthquake at<br />
Hebgen Lake,<br />
Mont., on Aug.<br />
17, 1959.<br />
Following the magnitude-9.2<br />
earthquake on March 27, 1964, this<br />
section of a street in downtown<br />
Anchorage, Alaska, has subsided<br />
more than 10 feet.<br />
A Look Back in Time<br />
back to Eureka over a narrow gauge railroad from Palisade (near Elko),<br />
which was just a wide place in the track.<br />
H.S. Did the earthquake have any long-lasting effects on your family?<br />
Smith. I don’t think my mother ever recovered from the shock of going<br />
through something like that. From that day on she too — always wanted to<br />
have a light on at night or a candle with matches. She was never going to be<br />
caught in the dark again. She always had a money belt with money in it of<br />
course. When you think about it, these were very sensible precautions.<br />
H.S. What about your father?<br />
Smith. My father took it almost routinely. After the ups and downs of the<br />
mining business, he was used to commotions. We moved back to Eureka<br />
and then to Rhyolite. The next year, 1907, was very bad in mining, and our<br />
affluence was gone. We moved to Tonopah, then to Elko. My father just<br />
moved around according to the changing fortunes of the mining ventures<br />
in Nevada.<br />
H.S. Have you been through many other earthquakes?<br />
Smith. I would guess that my wife and I have been through 15 to 20<br />
earthquakes since we were married. Curiously one of the first ones I experienced<br />
after the 1906 earthquake, occurred while my family was living<br />
in Oakland for a short while from 1910 to 1911. We had all gone to the<br />
Curran Theater in San Francisco. As we approached the balcony, we got a<br />
rather severe shake. There was an incipient panic. Don’t forget that this was<br />
only a few years after the 1906 earthquake, so you didn’t know what was going<br />
to happen. We got seated, and the manager told the audience not to be<br />
alarmed. Everything was in order. He said that we were safer in the theater<br />
than anywhere else. Just to relax and the show would go on. And we did!<br />
And it did! Things like that stick in your mind.<br />
H.S. Any other memorable earthquakes?<br />
Smith. Yes, quite a few. While we were fishing off the pier on holiday<br />
at Long Beach in 1918, we had a little earthquake which rattled the whole<br />
pier and rippled the water. My aunt lost her precious heirlooms in the 1933<br />
earthquake at Long Beach when a corner china cabinet tipped over. Ever<br />
since then we’ve always buckled our cabinets to the wall.<br />
I recall my wife’s first earthquake experience. We were living in Berkeley<br />
at the time. She was getting breakfast, and suddenly the silverware began<br />
dancing around on the table. “Something is happening,” she called out<br />
to me. “It’s just an earthquake,” I replied, “don’t worry.” So she went on<br />
frying the eggs.<br />
Then there was 1958. My office was on the 9 th floor of 821 Market Street<br />
in San Francisco. My partner in the olive business came into the office and<br />
propped his chair back up against the wall. Suddenly, he said “I’m having a<br />
heart attack.” And I said “No, you’re not. We’re having an earthquake.” The<br />
building just shook a little, and that was that.<br />
H.S. Others?<br />
Smith. Yes. The first time our three children experienced an earthquake<br />
was in Berkeley once in the middle of the night, and they all dived into<br />
bed with us. We were at Santa Barbara during the summer of 1952 relaxing<br />
in front of a motel when we felt a severe shake. I said to my wife<br />
that somewhere, someone was getting a devil of an earthquake. That was<br />
the Tehachapi (Kern County) earthquake. Later on that summer we had<br />
ranching friends who went through the Bakersfield earthquake. The only<br />
thing that happened to them was that their liquor came out of a closet, and<br />
the husband cut his foot on the broken glass as he was running out of the<br />
door.<br />
H.S. Any earthquakes while you’ve lived in Santa Rosa?<br />
Smith. Yes — the big earthquake in 1969. It was about 10 o’clock at<br />
night. We had no damage, but the chandelier rocked back and forth. We<br />
went out into the street and said hello to the neighbors. That’s what you do<br />
afterwards: Check on everyone else.<br />
H.S. You were in the 1906 earthquake. Does it bother you that 70 years<br />
later you are now retired in the same general area?<br />
Smith. Not at all. Earthquakes are a fact of life. It’s just something you<br />
have to live with. You remember what you’re supposed to do and what<br />
you’re not supposed to do. You can take some precautions, like buckling<br />
down the cabinets, having a stock of food for a week or two, putting some<br />
money away. We have a wrench handy to shut off the gas. We live in a wood<br />
frame house, bolted to the concrete foundation. You don’t need to increase<br />
the hazard if you can avoid it.<br />
Date: Aug. 17, 1959<br />
Magnitude: 7.3<br />
Date: March 27, 1964<br />
Magnitude: 9.2<br />
Continued from page 8<br />
Damage: The most significant<br />
damage was caused by a large<br />
debris avalanche that dammed<br />
the Madison River, eventually<br />
Damage: The earthquake (the largest<br />
ever recorded in the US) and ensuing<br />
landslides caused heavy damage<br />
to towns along Prince William Sound,<br />
especially Anchorage, where about 30<br />
downtown blocks were damaged or de-<br />
Hebgen Lake, Montana<br />
Prince William Sound, Alaska<br />
creating a lake more than 150<br />
feet deep. Damage to homes,<br />
highways, timber and other property<br />
was estimated at $11 million<br />
(1959 dollars).<br />
Number of deaths: 28 (most<br />
caused by rockslides)<br />
stroyed. The earthquake also generated<br />
a tsunami that struck Alaska, the U.S.<br />
West Coast and Hawaii. Property loss<br />
was about $311 million (1964 dollars).<br />
Number of deaths: 125 (15 earthquakerelated,<br />
all in Alaska; 110 tsunami<br />
related: 98 in Alaska; 11 in Calif.; 1<br />
in Oregon)<br />
April 2006 ★ PEOPLE, LAND & WATER 9
A Letter Home<br />
Continued from page 7<br />
At one place it moved the streets from 10 to 15 feet<br />
to one side. Three blocks below us it moved the whole<br />
street and left cracks three or four feet wide. At Van Ness<br />
avenue, about seven blocks from here, it bulged the macadam<br />
into ridges two feet high. On Valencia street, for a<br />
block, where the ground was “made,” it dropped about<br />
seven feet, and a hotel in that block sunk two stories out<br />
of sight, and as the large water mains broke there, it flooded<br />
into the hotel and about 50 people were killed.<br />
As soon as I could dress I started down town to see what<br />
damage was done. Some buildings were shaken down and<br />
all were damaged to a greater or less extent. The dome of<br />
the city hall was nearly shaken down, but a number of the<br />
large buildings were not damaged at all by the ‘quake,’<br />
but the fire burned them all. The most modern structures<br />
are still standing, although they are burned inside.<br />
For three days everyone was packing, where they had<br />
time before the fire caught them, and most everyone was<br />
hauling all they could pull out to the parks and sands.<br />
Everything that had wheels was used to carry away the<br />
most valuable belongings. Some had two bicycles with a<br />
wooden frame between them carrying bedsteads, Morris<br />
chairs, baby carriages, trunks, etc. There were people with<br />
sheets containing their belongings. It was a sad sight.<br />
I was driving the auto all day and most of the night,<br />
carrying Red Cross nurses, army officers, fire hose, water<br />
in boilers and about everything.<br />
The night that the fire came to Van Ness avenue we<br />
worked all night, carrying dynamite and nitro-glycerine<br />
to the dynamiters. Van Ness avenue is 125 feet wide, and<br />
they blew up a whole block wide, the length of the street,<br />
and thus saved the residential part of the city. Van Ness<br />
was the best of the residential streets in the city and it<br />
looked awful to see those palaces blown up.<br />
I carried the dynamite into the most beautiful house<br />
on the street. We put it in two cases. Most everyone was<br />
hurrying out of town, but Mr. Magee had all three of his<br />
machines working. One of them was running on a rim<br />
without any tire, but he did not care. I do not care to<br />
boast, but with those three machines and a small squad<br />
(about eight) of soldiers, we saved this end of the town.<br />
When we saw that the flames would not cross the avenue<br />
we went home at 5 a.m. At one place it crossed and it<br />
took some fast dynamiting to stop it. You see, the main<br />
trouble was no water, as the earthquake had broken the<br />
mains. While the fire was burning so fiercely, the city was<br />
light night and day. The smoke hung over the city in one<br />
vast cloud and the reflection of the fire on this smoke<br />
made a most terrible night.<br />
They are now blowing down the dangerous walls that<br />
were left standing. A peculiar incident happened to me.<br />
A fellow came and got me to fix his carburetor for him, as<br />
he could not make it work. It was a Locomobile. After I<br />
had fixed it, I looked over the levers to see how it worked<br />
and took it out to see if I could run it. I had only gone a<br />
few steps when three soldiers stopped me and told me<br />
to take the machine to headquarters, which was only a<br />
block away, to drive a captain to the Presidio. They were<br />
ordered to seize the first auto and I happened to be the<br />
first. I told the captain I had never run a Locomobile before<br />
and that he was risking his life. He thought I was<br />
lying, and so he pulled his “six shooter” on me, and told<br />
me to run the car and to run it easy, too. I knew he meant<br />
it, so I thought I had better do the best I could. He said he<br />
would shoot me if I did not go easy. I drove him for four<br />
hours. Mr Magee was mad and he got me a pass signed<br />
by the governor of the state, the mayor of the city and<br />
the commander of this division of the army. It says: “Do<br />
not detain bearer for any cause whatever.” These are the<br />
highest passes issued and only about a half dozen were<br />
given out.<br />
I heard Mr Magee tell a man that he had lost about<br />
every source of income. Do not worry about me, as the<br />
fire is out and I will keep out of all danger.<br />
Write soon.<br />
Love to All from<br />
Percy J. Holmes<br />
10 PEOPLE, LAND & WATER ★ April 2006<br />
When the Dust Settled – What Became of the <strong>USGS</strong><br />
Employees Who Responded to the Great Earthquake?<br />
By Liz Colvard and James Rogers<br />
After 1906, what became of the <strong>USGS</strong><br />
employees who responded to the great<br />
earthquake?<br />
Chief Geographer Robert Marshall<br />
moved up to the position of chief geographer<br />
for the entire <strong>USGS</strong> in 1908. Although he did not<br />
go overseas, he served as a topographer with the U.S.<br />
Army during World War I and achieved the rank of colonel.<br />
Marshall was a close friend of John Muir and a charter<br />
member of the Sierra Club. In 1916, he was loaned<br />
out to serve as superintendent of all the national parks<br />
immediately prior to the creation of the National Park<br />
Service. Marshall left the <strong>USGS</strong> in 1919 and returned<br />
to California, where he became known as the “Father of<br />
the Central Valley Project” when he obtained $200,000<br />
from the California legislature to study his plan for a<br />
series of dams, canals and aqueducts to bring water to<br />
California’s fertile Central Valley.<br />
Ten years after the earthquake, stenographer Adelena<br />
Fontaine married topographer George Davis. She remained<br />
with <strong>USGS</strong> until the birth of their only child,<br />
Anna Davis Rogers, who provided much of the information<br />
and some of the photographs for these articles.<br />
Their grandson, James Rogers, is also one of the authors<br />
of this article.<br />
Topographer George Davis continued to map the High<br />
Sierra. He was the first person to take pack stock over<br />
Muir Pass and made the first ascents of Black Mountain,<br />
Milestone Mountain and Mount Baxter. In 1917, one<br />
year after he married stenographer Adelena Fontaine,<br />
This freeway<br />
interchange in<br />
San Fernando,<br />
Calif., lies broken<br />
following the<br />
earthquake on<br />
Feb. 9, 1971.<br />
(Photo: R.<br />
Kachadoorian)<br />
This wall’s collapse<br />
killed two<br />
children in Challis,<br />
Idaho, during the<br />
earthquake on<br />
Oct. 28, 1983.<br />
(Photo: Sue<br />
Villard, Challis<br />
Messenger )<br />
Date: Feb. 9, 1971<br />
Magnitude: 6.6<br />
Date: Oct. 28, 1983<br />
Magnitude: 7.0<br />
Damage: Losses were estimated at $505<br />
million (1971 dollars), as two hospitals and<br />
two dams were severely damaged, and<br />
several freeway overpasses collapsed.<br />
Damage: This was the largest quake ever<br />
recorded in Idaho. It caused $12.5 million (1983<br />
dollars) in damage to the Idaho towns of Challis<br />
Davis took over Robert Marshall’s old position as chief<br />
geographer for the <strong>USGS</strong> Pacific Region.<br />
Topographer Clarence Nelson stayed with the <strong>USGS</strong><br />
for his entire career. He left California in 1907 and<br />
moved on to mapping projects in Puerto Rico, Argentina,<br />
Alaska and other parts of the United States. He went<br />
overseas with the Army during World War I, eventually<br />
reaching the rank of colonel with the Army Reserve.<br />
From 1922 to 1923, he was loaned out to the National<br />
Park Service to serve as acting superintendent of Mount<br />
Rainier National Park.<br />
Topographer Hal Sylvester transferred to the U.S.<br />
Forest Service in 1907. In 1908, he became the superintendent<br />
of Wenatchee National Forest in the<br />
Cascade Mountains of Washington, where he remained<br />
until his retirement in 1931. He<br />
is credited with naming more<br />
than 1,000 geographic features in<br />
Washington. Historian Harry<br />
Majors calls him “one of the supreme<br />
figures in the history of the<br />
Cascade Mountains.”<br />
Topographer Sidney Stoner and<br />
Marjorie Sprague were married<br />
soon after the earthquake. Stoner<br />
did not remain employed with<br />
the <strong>USGS</strong>.<br />
Geologist G.K. Gilbert published<br />
the results of his research on<br />
hydraulic gold-mining debris in<br />
1914 and 1917. At the same time,<br />
he continued his interest in earthquake<br />
research by serving as a member<br />
of the Scientific Committee of the Seismological Society of<br />
America, which was formed in the fall of 1906. Although<br />
he and the unconventional San Francisco botanist Alice<br />
Eastwood (whom he met through the Sierra Club) were<br />
intimate friends for many years, they did not get engaged<br />
until 1918, when Gilbert was 75 and Eastwood was 59.<br />
Gilbert died before the marriage took place.<br />
Topographer François Matthes’ topographic map of<br />
Yosemite Valley was published in 1907. It is considered<br />
by some to be one of the most beautiful topographic<br />
maps ever created. Between 1910 and 1911, he was in<br />
charge of mapping Mount Rainier National Park and<br />
twice hauled his heavy survey equipment to the summit<br />
of Mount Rainier. He spent the remainder of his career<br />
as a leader in <strong>USGS</strong> topographic mapping and in the<br />
study of the geology and geomorphology of Yosemite<br />
National Park.<br />
Photo courtesy California Historical Society<br />
San Fernando, California<br />
Borah Peak, Idaho<br />
<strong>Land</strong>slides also damaged highways,<br />
railroads and pipelines. More than 2,000<br />
people were injured.<br />
Number of deaths: 65 (49 in collapses at<br />
the San Fernando Veteran’s Administration<br />
hospital).<br />
and Mackay. In addition to structure damage,<br />
the temblor resulted in several rock falls and<br />
landslides, a temporary lake and tremendous<br />
surface faulting.<br />
Number of deaths: 2
Seismic Technology Evolves into the 21 st Century<br />
By Heidi Koontz<br />
<strong>USGS</strong> scientist emeritus<br />
Waverly Person remembers<br />
the days when a<br />
rotary phone, a pen, a<br />
globe and a keen sense<br />
of geography were the required ingredients<br />
for locating earthquakes around<br />
the world.<br />
Things have changed dramatically since<br />
he was a newly minted seismologist.<br />
“We really had to scramble,” he says, referring<br />
to earthquake response in the ’50s<br />
and ’60s, when he and his fellow scientists<br />
did calculations on globes with tape<br />
measures and compasses. “It might take a<br />
day or a day-and-a-half to get information<br />
from remote locations.”<br />
That struggle makes Waverly all the<br />
more appreciative of the real-time data<br />
and global-monitoring systems available<br />
now. “It’s great to be a part of the change<br />
and to have had a hand in getting there,”<br />
said Person, who recently retired after a<br />
51-year career as a premier earthquake<br />
scientist. [See page 13.]<br />
Today, the <strong>USGS</strong> has the most extensive<br />
seismic monitoring and response system<br />
in the nation and works with numerous<br />
universities to advance understanding<br />
of the cause and effects of earthquakes<br />
and with emergency response agencies in<br />
the interest of public safety and hazards<br />
mitigation.<br />
Throughout history, a variety of instruments<br />
has been developed to measure<br />
movement of the earth.<br />
By definition, seismographs, seismometers<br />
and seismoscopes are instruments<br />
used to detect and measure the intensity,<br />
direction and duration of movements of<br />
the ground (as caused by an earthquake).<br />
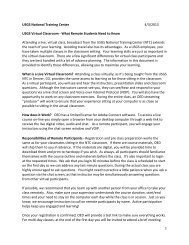
The earliest account of such technology<br />
is a seismoscope invented by the Chinese<br />
philosopher Chang Heng in A.D. 132.<br />
The instrument consisted of eight dragonheads,<br />
facing the eight principal directions<br />
of the compass. Below each of the<br />
dragonheads was a toad with its mouth<br />
This section of San Francisco’s<br />
Marina District is destroyed following<br />
the earthquake on Oct. 17,<br />
1989. (Photo: C.E. Meyer)<br />
This section of a Los Angeles-area<br />
apartment complex is broken in half<br />
following the Northridge, Calif., earthquake<br />
on Jan. 17, 1994. (Photo: FEMA)<br />
Date: Oct. 17, 1989<br />
Magnitude: 6.9<br />
Damage: The most severe damage<br />
occurred in Oakland and San Francisco,<br />
where many buildings and elevatedfreeway<br />
and bridge spans collapsed.<br />
Pipelines, port facilities, airport runways<br />
Date: Jan. 17, 1994<br />
Magnitude: 6.7<br />
Loma Prieta, California<br />
Damage: In the Los Angeles area, an<br />
estimated $20 billion in losses were<br />
sustained through damage to more<br />
opened toward the dragon. The mouth<br />
of each dragon held a ball, and when an<br />
earthquake occurred, one of the dragon<br />
mouths would release a ball into the open<br />
and levees were also damaged, and<br />
more than 1,000 landslides occurred<br />
near the epicenter in the Santa Cruz<br />
Mountains. Damage was estimated at<br />
$6 billion (1989 dollars), and more than<br />
3,500 people were injured.<br />
Number of deaths: 63<br />
Northridge, California<br />
than 40,000 buildings, collapses of<br />
freeway overpasses and subsequent<br />
fires. More than 5,000 people were<br />
injured, and more than 20,000 lost<br />
their homes.<br />
Number of deaths: 33<br />
mouth of the toad situated below. The direction<br />
of the shaking determined which<br />
of the dragons released its ball.<br />
The ancestry of today’s <strong>USGS</strong> seismic<br />
At the time of the 1906<br />
earthquake there were less than<br />
100 seismographs operating<br />
around the world. Today there are<br />
thousands.<br />
— Gray Jensen<br />
““<br />
This seismoscope, invented in A.D. 132, represents the earliest<br />
account of technology used to record information about<br />
earthquake shaking. During an earthquake, the direction of<br />
the shaking determines which dragon releases its ball.<br />
Geotech Helicorder model drum recorder used widely since the<br />
mid 1900s to record and display seismic records. Now used<br />
mainly for visitor and press displays. Whole-day records like<br />
this can be produced on computer but requests still come in<br />
for the drums.<br />
A room full of Develocorders. These were devices with a roll of 16mm photographic film in them. They also had 16 galvanometers<br />
with very tiny lights attached. The row of lights was focused on the film as it was drawn past. This caused a line to be<br />
drawn on the film for each light. The galvanometers would cause the light to move from side-to-side in response to the seismic<br />
signal which was then recorded on the film. The film was then developed internally over the next ten minutes. Finally the developed<br />
portion of the film was projected on a glass screen for viewing. The film was changed each day and the removed film could<br />
then be viewed on a larger projector for analysis of the records.<br />
This business in Seattle has sustained<br />
heavy damage following the Nisqually,<br />
Wash., earthquake on Feb. 28, 2001.<br />
(Photo: Kevin Galvin, FEMA)<br />
The Trans Alaska Pipeline System near<br />
the Denali Fault has shifted but remains<br />
intact following the earthquake on Nov.<br />
3, 2002, thanks to its slider bar supports.<br />
(Photo: Rod Combellick, Alaska Division of<br />
Geological and Geophysical Surveys)<br />
Date: Feb. 28, 2001<br />
Magnitude: 6.8<br />
Damage: This earthquake, including<br />
its resulting landslides, caused<br />
$4 billion in damages to buildings,<br />
Date: Nov. 3, 2002<br />
Magnitude: 7.9<br />
Damage: Despite being the largest<br />
onshore earthquake in nearly a century,<br />
the Denali quake was significant<br />
for what it did not do: rupture<br />
the Trans Alaska Pipeline System. In<br />
instrumentation can be traced back to the<br />
late 1800s. And while the dragonheads<br />
had been replaced by more advanced<br />
creations, the equipment of that era was<br />
still a long way from the sophistication of<br />
today’s machinery.<br />
“At the time of the 1906 earthquake<br />
there were less than 100 seismographs<br />
operating around the world. Today there<br />
are thousands,” said <strong>USGS</strong> scientist Gray<br />
Jensen, who has been tracking earthquakes<br />
for the <strong>USGS</strong> for more than 30 years.<br />
John Milne, an English seismologist<br />
and geologist, invented the first modern<br />
seismograph and promoted the building<br />
of seismological stations. In 1880, Sir<br />
James Alfred Ewing, Thomas Gray and<br />
Milne, all British scientists working in<br />
Japan, began to study earthquakes. They<br />
founded the Seismological Society of<br />
Japan, and the society funded the invention<br />
of seismographs to detect and measure<br />
earthquakes. Milne invented the<br />
horizontal pendulum seismograph in<br />
1880.<br />
The horizontal pendulum seismograph<br />
was improved after World War II with<br />
the Press-Ewing seismograph, developed<br />
in the United States for recording long-<br />
period waves. With the advent of modern<br />
electronics, conventional magnet-and-coil<br />
seismometers and geophones became the<br />
typical sensors. Electronic amplifiers were<br />
then used to produce highly sensitive seismographs.<br />
Electronic feedback was added<br />
to these devices to create sensors with the<br />
maximum in dynamic range, frequency<br />
range and sensitivity. Ultimately, arrays<br />
of these sensors were connected to computers<br />
to produce today’s fully automated<br />
seismic networks.<br />
Although <strong>USGS</strong> scientists are currently<br />
unable to predict earthquakes, the<br />
advances in technology since 1906 allow<br />
them to provide much needed information<br />
for saving lives and pinpointing risk.<br />
Compiled with assistance from Gray<br />
Jensen, Steve Walter, Jack Van Schaack<br />
and David Hebert.<br />
Nisqually, Washington<br />
Denali, Alaska<br />
highways and other structures in<br />
the cities of Olympia, Seattle and<br />
Tacoma. Approximately 400 people<br />
were injured.<br />
Number of deaths: 1<br />
anticipation of just such an event,<br />
the pipeline was engineered to shift<br />
on Teflon-coated slider bars where<br />
it crossed the fault. Despite nearly<br />
20 feet of displacement, the pipeline<br />
did not spill a drop and was quickly<br />
back in service.<br />
Number of deaths: 0<br />
April 2006 ★ PEOPLE, LAND & WATER 11
History of the <strong>USGS</strong> Earthquake Hazards Program<br />
By Susan C. Wells<br />
Scientific study of earthquakes<br />
in the United States arose<br />
from three seismic events that<br />
occurred in the eastern, central,<br />
and western parts of the<br />
country beginning in the early 1800s.<br />
In the winter of 1811–1812, three magnitude-8.0<br />
earthquakes shocked New<br />
Madrid, Mo.; a magnitude-7.3 earthquake<br />
devastated Charleston, SC, in 1886;<br />
and in 1906, the magnitude-7.9 earthquake<br />
struck San Francisco. Although<br />
Charleston’s event was thought to be an<br />
anomaly because no surface evidence<br />
showed that faults had triggered the earthquake,<br />
scientists had begun to recognize<br />
a direct link between faults — or seeming<br />
breaks in the earth’s surface — and earthquakes.<br />
In 1895, geologist A.C. Lawson<br />
at the University of California at Berkeley<br />
studied a fault south of San Francisco<br />
and named it the San Andreas Fault. At<br />
the time he didn’t realize the small fault<br />
was part of a vast system of faults along<br />
the western edge of California. After the<br />
great San Francisco earthquake, scientific<br />
research revealed its true extent and<br />
scientists began speculating that energy<br />
building up along these fissures eventually<br />
released and shook the earth.<br />
In the 1950s, a permanent <strong>USGS</strong> site<br />
in seismically-active California was established<br />
in Menlo Park, 30 miles south<br />
of San Francisco. Its focus was primarily<br />
geologic and topographic mapping; but<br />
seismology was beginning to take root<br />
with little fanfare and little funding. Two<br />
events soon propelled seismology into the<br />
national spotlight, one was due to the nature<br />
of human relations and the other to<br />
the dynamic nature of the Earth.<br />
The Nuclear Connection<br />
Scientist emeritus John Filson, a former<br />
chief of the Earthquake Hazards<br />
Program, recalls that early advancements<br />
in the field of seismology were closely tied<br />
to nuclear energy, both in monitoring<br />
nuclear arms testing and in developing<br />
seismic safety standards for nuclear reactors.<br />
To avoid global catastrophe from radioactive<br />
contamination, a treaty prohibiting<br />
nuclear testing in the atmosphere, in<br />
outer space and underwater, was signed<br />
in 1963. However, it did not prohibit<br />
underground testing.<br />
As a result, the Department of Defense<br />
began to support a broad-based program<br />
in basic and applied seismic research.<br />
This program included the development<br />
of the Worldwide Standardized Seismograph<br />
Network. During the 1960s, data<br />
from this network was used to establish<br />
the theory of plate tectonics, an essential<br />
element of modern understanding of<br />
12 PEOPLE, LAND & WATER ★ April 2006<br />
The 1964 Alaska earthquake released perhaps twice as much energy as the 1906 San Francisco<br />
Earthquake, was felt over an area of almost 500,000 square miles and triggered a tsunami<br />
that traveled along the coast from Alaska to California. The next year, the <strong>USGS</strong> Center for<br />
Earthquake Research was established.<br />
earthquake causes and occurrences. The<br />
drive toward seismic safety standards for<br />
nuclear reactors helped improve seismic<br />
hazard analyses, particularly in the eastern<br />
part of the United States.<br />
The Great Alaska Earthquake<br />
The biggest boost in earthquake awareness<br />
in the United States occurred in the<br />
aftermath of the great Alaskan earthquake<br />
of 1964. This magnitude-9.2 earthquake<br />
killed 15 people in Alaska and spawned<br />
a tsunami that took more than 100 lives<br />
along the Pacific Coast from Alaska<br />
to California.<br />
By placing instrumentation far beneath the<br />
Earth’s surface, the San Andreas Fault<br />
Observatory at Depth marks a major advance<br />
in the pursuit of understanding earthquakes.<br />
The next year, the <strong>USGS</strong> Center for<br />
Earthquake Research was established in<br />
Menlo Park, hailed as one of the largest<br />
centers for study of the earth sciences<br />
in the world. Scientists became crusaders<br />
with a quest: earthquake prediction.<br />
Jim Devine, <strong>USGS</strong> Senior Advisor for<br />
Science Applications, recalls how everyone<br />
felt that muscle and brains could<br />
make it happen, but even now, 40 years<br />
later, earthquake prediction remains the<br />
“Holy Grail” of seismology.<br />
Consolidation of Earthquake<br />
Studies<br />
The U.S. Coastal and Geodetic<br />
Survey, part of the National Oceanic and<br />
Atmospheric Administration (NOAA),<br />
had been involved since 1900 in earthquake<br />
monitoring and research. By 1972,<br />
a network of nearly 600 strong-motion<br />
seismographs was installed throughout<br />
the United States and Central and<br />
South America. In 1973, the U.S. Coastal<br />
and Geodetic Survey was merged with<br />
<strong>USGS</strong> seismological studies. The U.S.<br />
Coastal and Geodetic Survey’s National<br />
Earthquake Information Center, in<br />
Golden, Colo., was transferred to the<br />
<strong>USGS</strong>. [See page 14.]<br />
National Earthquake Hazards<br />
Reduction Program<br />
The Disaster Relief Act of 1974, referred<br />
to as the Stafford Act, gave the<br />
<strong>USGS</strong> authority to issue geologic-related<br />
hazard warnings — including earthquakes<br />
— with the caveat that “predictions of the<br />
precise location, time and magnitude of<br />
specific earthquakes cannot generally be<br />
made now.” It did allow that broad-scale<br />
estimates of earthquake susceptibility<br />
were available for various regions of the<br />
United States, principally California.<br />
As a result of this legislation, the <strong>USGS</strong><br />
National Seismic Hazards Mapping<br />
Project sprang to life, providing connections<br />
between earthquake research and<br />
hazards mitigation. Hazard maps have<br />
become the basis for the seismic sec-<br />
tions of model building codes such as the<br />
Uniform Building Code. [See “Building<br />
Safer” page 26.]<br />
In 1976, the National Science<br />
Foundation and the <strong>USGS</strong> developed a<br />
report titled Earthquake Prediction and<br />
Hazard Mitigation: Options for <strong>USGS</strong><br />
and NSF Programs, referred to as the<br />
“Newmark-Stever Report,” that combined<br />
needs assessments, state of knowledge<br />
reviews, and recommended provided<br />
programs and budgets on which to base<br />
a national earthquake hazards reduction<br />
program.<br />
In 1977, Congress enacted the<br />
Earthquake Hazards Reduction Act, recognizing<br />
the important role of scientific<br />
research in the mitigation process, and<br />
establishing the National Earthquake<br />
Hazards Reduction Program (NEHRP),<br />
a multi-agency effort that includes the<br />
<strong>USGS</strong> earthquake monitoring and research<br />
programs.<br />
A year later, the <strong>USGS</strong> Earthquake<br />
Hazards Program was established to carry<br />
out the mandates of NEHRP. The <strong>USGS</strong>,<br />
with the most extensive seismic monitoring<br />
and response system in the nation,<br />
joined forces with other agencies and universities<br />
to advance understanding of the<br />
causes and effects of earthquakes. Work<br />
also began in conjunction with emergency-response<br />
agencies to address public<br />
safety and hazards mitigation.<br />
The Loma Prieta Earthquake<br />
In 1989, the magnitude-6.9 Loma Prieta<br />
earthquake caused significant damage in<br />
an extended area around San Francisco.<br />
“I remember answering more than<br />
2,000 phone calls in the week after the<br />
Loma Prieta earthquake of 1989,” says<br />
Earthquake Hazards Program assistant<br />
Joyce Costello, who has been with the<br />
<strong>USGS</strong> earthquake program for 33 years.<br />
“Callers wanted to know if this was ‘the<br />
big one’ — an earthquake equal to or<br />
greater than the 1906 San Francisco<br />
earthquake. It wasn’t.”<br />
A curious bit of wisdom from Loma<br />
Prieta was the increased awareness that<br />
emergency responders can also be immobilized<br />
in an earthquake. In some<br />
cases, firehouses had been shaken off<br />
kilter with their doors jammed shut and<br />
trucks trapped inside. Hazards emphasis<br />
shifted from predicting the occurrence of<br />
earthquakes to predicting and mitigating<br />
their effects.<br />
Advanced National Seismic<br />
System<br />
In 1997, Congress reauthorized<br />
NEHRP with a specific request for development<br />
of a “real-time seismic hazard<br />
warning system.” This paved the way for
development of the Advanced National Seismic System.<br />
[See page 22.] Begun in 2000, the system has helped integrate,<br />
modernize, and expand earthquake monitoring<br />
and notifi cation nationwide.<br />
Parkfi eld Prediction<br />
Between 1857 and 1966, six magnitude-6.0 earthquakes<br />
occurred at intervals of approximately 22 years along the<br />
San Andreas Fault near Parkfi eld, Calif. In 1985, <strong>USGS</strong><br />
scientists took advantage of the seeming regularity of<br />
these earthquakes and set up extensive research instrumentation<br />
in the area. They boldly predicted the next<br />
sizable earthquake would occur in 1988, 22 years after<br />
the last one. Instead, it arrived in September 2004, after<br />
providing a wealth of valuable research data.<br />
In 2004, the <strong>USGS</strong> and the National Science<br />
Foundation, as part of the EarthScope science initiative,<br />
went even further and began drilling a deep hole<br />
to install instruments directly within the San Andreas<br />
Fault near the point of the previous magnitude-6.0 earthquakes,<br />
forming the San Andreas Fault Observatory at<br />
Depth (SAFOD).<br />
SAFOD is providing direct information on the com-<br />
Waverly Person uses the technology of the day to locate earthquakes.<br />
By David Hebert and Heidi Koontz<br />
After 51 years of educating audiences<br />
around the globe about earthquakes,<br />
<strong>USGS</strong> scientist Waverly Person called<br />
it quits on Feb. 3, 2006. Person is well<br />
known among media circles as the person<br />
to call when an earthquake happens anywhere in the<br />
world. Known by many as “Mr. Earthquake,” he is a<br />
fi xture both in classrooms and on television sets.<br />
Before becoming a government scientist, he served<br />
in both World War II and the Korean War with the<br />
U.S. Army. He then took his bachelor’s in mathematics<br />
to a position as a science technician with the<br />
Department of Commerce, which oversaw federal seismic<br />
monitoring in the 1950s.<br />
Person was literally thrown in front of the media spotlight<br />
in 1964 following the magnitude-9.2 earthquake<br />
that hit Anchorage, Alaska.<br />
<strong>USGS</strong> Senior Advisor for Science Applications Jim Devine<br />
recalls that improvements in earthquake monitoring and<br />
advances in seismology and geomagnetism made the 1950s<br />
and 1960s a very exciting time for scientists. “Nothing has<br />
matched it since,” he says.<br />
position and mechanical properties of rocks in the fault<br />
zone, the nature of stresses responsible for earthquakes,<br />
the role of fl uids in controlling faulting and earthquake<br />
recurrence, and the physics of earthquake initiation and<br />
rupture. By observing earthquakes “up close,” SAFOD<br />
marks a major advance in the pursuit of a rigorous sci-<br />
“Mr. Earthquake”<br />
Takes a Bow<br />
In the lobby of the Commerce Building in<br />
Washington, D.C., was a seismograph; and the ink<br />
used to create seismograms was spilled everywhere<br />
because of the machine’s drastic response to the huge<br />
quake. The lobby was full of curious people, some with<br />
microphones and cameras, asking questions about the<br />
situation. Person saw what was happening and told his<br />
supervisor, “Somebody needs to talk to those people.”<br />
“Well, there’s nobody else here,” the supervisor<br />
responded. “You’ve got to talk to them.”<br />
And that’s exactly what he did. Media, citizens,<br />
students — anyone who asked a question about earthquakes,<br />
he answered. Some notable names of inquirers<br />
over the years include Tom Brokaw, Dan Rather and<br />
Matt Lauer.<br />
Of course, Person is a natural when it comes to<br />
talking to people.<br />
“It’s one of the things I enjoy most of all,” he says.<br />
“I’ve always tried to put news to the general public in a<br />
entifi c basis for assessing earthquake hazards and predicting<br />
earthquakes. This work ties in with the National<br />
Earthquake Hazard Reduction Program’s efforts to protect<br />
lives and property from earthquake hazards.<br />
The Future<br />
“Short-term prediction is still in the future,” says<br />
Senior Science Advisor for Earthquake and Geologic<br />
Hazards David Applegate, “but we are making great<br />
strides at minimizing loss of life and property right now<br />
by providing assessments of hazard zones and delivering<br />
rapid post-event information for fi rst responders and<br />
emergency managers.”<br />
The <strong>USGS</strong> continues to improve existing earthquake<br />
monitoring, assessment and research activities with the<br />
ultimate goal of providing the nation with a new generation<br />
of earthquake products to improve earthquake<br />
mitigation and response. On the horizon is an extensive,<br />
coordinated seismic-monitoring network that will<br />
instantly register ground motion and signal an alarm if<br />
an earthquake occurs near a populated area — automatically<br />
opening the fi rehouse doors seconds or minutes before<br />
the tremblors arrive.<br />
way they can understand it — to get the message to the<br />
vast majority. When there’s an earthquake, people are<br />
frightened. If you relate the information to them so that<br />
they understand, they calm down.”<br />
Behind the public view, Person has some historical<br />
feats to boast. He marched alongside Dr. Martin<br />
Luther King, Jr., and has been coined the nation’s fi rst<br />
black earthquake seismologist.<br />
“I’ve learned a lot along the way,” said Person. “And<br />
the path hasn’t always been kind.”<br />
He feels lucky to be a noticeable face to younger<br />
generations and to have the opportunity to persuade<br />
minority students to pursue science. Thus, Person will<br />
continue educating this demographic about seismology<br />
through speaking at inner-city classrooms.<br />
Last year, U.S. Rep. Bob Beauprez (Colo.) recognized<br />
Person’s 50 years of government service at a<br />
ceremony honoring his career.<br />
“You want economic advice, you go to Alan<br />
Greenspan. You want to know anything about seismic<br />
activity, you see if you can get Waverly Person on the<br />
line,” said Rep. Beauprez in a Denver Post article commemorating<br />
Person’s 50 th anniversary.<br />
So who will fi ll Person’s shoes?<br />
“Waverly is a hard act to follow — not only because<br />
of his calm under fi re, but also his incredible<br />
encyclopedic mind for earthquake history,” said Jill<br />
McCarthy, director of the <strong>USGS</strong> Geologic Hazards<br />
Team in Golden, Colo. “For the past few years, we’ve<br />
been training other scientists to deal with media inquiries,<br />
and we’ve been developing earthquake databases<br />
and computer programs that attempt to replicate what<br />
Waverly knows intuitively from decades of hands-on<br />
experience. Even still, we realize that things just won’t<br />
be the same without Waverly.”<br />
And they haven’t been.<br />
“<strong>People</strong> still call and ask to talk with Waverly about<br />
rumblings they’ve felt,” said John Bellini, a geophysicist<br />
who was hired by Person 7 years ago. “We tell them<br />
he’s retired, and a bit of shock ensues.”<br />
Person, a long-time Boulder, Colo., resident, and his<br />
wife, Sarah, plan to enjoy each other’s company and<br />
travel around the country to visit family. And since he is<br />
now a scientist emeritus, you might just see him in the<br />
background the next time a “big one” hits.<br />
April 2006 ★ PEOPLE, LAND & WATER 13
Photo courtesy California Historical Society<br />
“ After<br />
devastating<br />
earthquakes,<br />
like the 2004<br />
Sumatra<br />
earthquake<br />
and<br />
subsequent<br />
tsunami,<br />
as well as<br />
other natural<br />
hazards in<br />
recent times,<br />
society<br />
calls for<br />
immediate<br />
information,<br />
and the new<br />
manned 24/7<br />
operation<br />
at the <strong>USGS</strong><br />
NEIC helps<br />
do this.<br />
“<br />
— P. Patrick Leahy<br />
14 PEOPLE, LAND & WATER ★ April 2006<br />
The World’s Source for Earthquake Information<br />
The <strong>USGS</strong> National Earthquake<br />
Information Center<br />
By George Choy and Heather Friesen<br />
The <strong>USGS</strong> National<br />
Earthquake Information<br />
Center (NEIC) is responsible<br />
for the comprehensive<br />
monitoring and reporting<br />
of earthquake activity for our nation and<br />
the world. Nearly 30,000 worldwide earthquakes<br />
are located each year by NEIC.<br />
Rapid reports are issued for those earthquakes<br />
that register at least a magnitude<br />
4.5 in the United States, a magnitude 6.5<br />
anywhere else in the world or any magnitude<br />
if the earthquake is known to have<br />
caused damage.<br />
This information is communicated<br />
to federal and state government agencies<br />
that are responsible for emergency<br />
response, to government public information<br />
channels, to national and international<br />
news media, to scientific groups and to<br />
private citizens who request information.<br />
When a damaging earthquake occurs in a<br />
foreign country, the earthquake information<br />
is passed to the staffs of the American<br />
embassies and consulates in the affected<br />
countries and to the United Nations<br />
Department of Humanitarian Affairs.<br />
NEIC has come a long way since<br />
its beginnings in 1966 in Rockville,<br />
Md., as part of the National Ocean<br />
Survey of the Department of Commerce.<br />
Before 1966, the U.S. Coast and Geodetic<br />
Survey, a forerunner of the National<br />
Ocean Survey, had coordinated the<br />
collection of seismological data in the<br />
United States. In 1972, the NEIC was<br />
transferred to Boulder, Colo., and in the<br />
following year, it was made part of the<br />
<strong>USGS</strong>. NEIC was moved again in 1974<br />
to its present location in Golden, Colo.<br />
In the 1960s, NEIC received most of<br />
its data from analog stations via telegraph<br />
or telephone circuits. It could take several<br />
days for the location and magnitude<br />
of an earthquake to be finalized. Today,<br />
NEIC receives more than 1,000 channels<br />
of digital waveform data in real time from<br />
approximately 475 digital seismic stations<br />
worldwide using dedicated satellite circuits<br />
and Internet links. For the largest<br />
events, locations and magnitudes are determined<br />
in minutes. While NEIC once<br />
provided only the basic information on<br />
the location and size of the earthquake,<br />
it now provides information on the extent<br />
of the affected area, on the location and<br />
degree of damage potential and on the<br />
tectonic and historical context.<br />
The urgency for assessing the extent<br />
of natural disasters as quickly as possible<br />
was painfully evident in the aftermath<br />
of the Sumatra-Andaman earthquake<br />
in late December 2004. In order to determine<br />
the location and magnitude of<br />
significant earthquakes as rapidly and<br />
accurately as possible, NEIC implemented<br />
round-the-clock-on-site staffing in<br />
January 2006. This was complemented<br />
with a state-of-the-art processing system<br />
that became fully operational in March<br />
2006. This new seismic-event processing<br />
system identifies, locates and measures<br />
the size of earthquakes with unprecedented<br />
speed and accuracy.<br />
“After devastating earthquakes, like the<br />
2004 Sumatra earthquake and subsequent<br />
tsunami, as well as other natural hazards<br />
in recent times, society calls for immediate<br />
information, and the new manned<br />
24/7 operation at the <strong>USGS</strong> NEIC helps<br />
do this,” said P. Patrick Leahy, <strong>USGS</strong>.<br />
It took an hour to process the information<br />
about the December 2004 Sumatra<br />
earthquake. With the new system, it will<br />
take 12 to 13 minutes to process the same<br />
information. The immediate transmission<br />
of this information to cooperative<br />
agencies such as tsunami warning centers<br />
is critical. Previously, there were 25,000<br />
contacts to notify; now the list is up to<br />
54,000, and the demand for rapid notification<br />
keeps growing.<br />
“We are improving all the time,” said<br />
Harley Benz, director of the NEIC. “The<br />
new systems are more robust, accurate<br />
and contain new information critical<br />
for emergency-response applications.<br />
We’re essentially replacing 20-year-old<br />
technology.”<br />
Location and magnitude, the staples of<br />
earthquake reporting, are now being supplemented<br />
by information equally important<br />
to describing and understanding the<br />
impact of an earthquake.<br />
The Community Internet Intensity<br />
Map (or “Did You Feel It?”) project collects<br />
information about ground shaking<br />
following significant earthquakes.<br />
Persons who experience an earthquake<br />
can go online to share information about<br />
its effects. A Community Internet Intensity<br />
Map is then generated and automatically<br />
updated with real-time data from these<br />
first-hand accounts. [See page 33].<br />
A new system, the Prompt Assessment<br />
of Global Earthquakes for Response<br />
(PAGER), is being designed to estimate<br />
Left to right: U.S. Congressman Bob Beauprez listens to NEIC director Harley Benz describe<br />
new earthquake technology. Joan Fitzpatrick, Linda Pratt and Jill McCarthy observe.<br />
damage from major earthquakes worldwide<br />
based on estimates of people and<br />
property exposed to potentially damaging<br />
levels of ground motion. The system<br />
promises to be a significant tool for emergency<br />
relief organizations such as the U.S.<br />
Agency for International Development.<br />
PAGER information will also be available<br />
to scientists and the public.<br />
A new earthquake notification service<br />
sends out earthquake alerts to subscribers<br />
via e-mail. With the new service, users can<br />
customize the contents of the alerts they<br />
receive. For instance, they may define regions<br />
of interest, set magnitude thresholds,<br />
specify time periods such as day and night,<br />
opt for “Aftershock Exclusion,” and enter<br />
various notification addresses. Anyone can<br />
subscribe to the notification service.<br />
“The <strong>USGS</strong> Earthquake Hazards<br />
Program Web site allows Internet users to<br />
find the information they need,” said Lisa<br />
Wald, <strong>USGS</strong> geophysicist and Webmaster<br />
at the NEIC.<br />
The Web site receives more than one<br />
million hits per day. All products of the<br />
NEIC are available to the public via the<br />
<strong>USGS</strong> Earthquake Hazards Program Web<br />
site, http://earthquake.usgs.gov.
Photo courtesy California Historical Society<br />
Thinking Globally but Guiding the<br />
Local Message for the 1906 Centennial<br />
By Stephanie Hanna<br />
As the pace of events builds<br />
toward a crescendo on<br />
April 18, 2006, for the<br />
Centennial of the Great San<br />
Francisco Earthquake, Mary<br />
Lou Zoback’s work week extends into the<br />
weekend and often well into the evening.<br />
She is currently regional coordinator for<br />
the <strong>USGS</strong> Earthquake Hazards Program<br />
in Northern California and chairs the<br />
steering committee of federal, state, local<br />
and private partners making up the 1906<br />
Centennial Alliance. In this role, Zoback<br />
routinely fi elds calls and conducts interviews<br />
with the news media, speaks at up<br />
to four public events per week, attends<br />
multiple meetings and recruits new partners<br />
to assist in the funding and distribution<br />
of new and important products for<br />
fi rst responders, decision makers and an<br />
interested public.<br />
“It’s important to view the 1906<br />
Centennial as an incredible, teachable<br />
moment,” Zoback explained. “Living in<br />
California, we see huge vulnerabilities<br />
from earthquakes, both to individuals and<br />
to society. The high probability of large,<br />
devastating urban earthquakes exposes society<br />
to enormous vulnerabilities. So the<br />
1906 Centennial becomes an invaluable<br />
opportunity to remind people, ‘It will happen<br />
here,’ and to encourage citizens to<br />
push their communities and governments<br />
to help them prepare. The Hurricane<br />
Katrina disaster, unfortunately, emphasizes<br />
that we have to be proactive.”<br />
Zoback is a senior research scientist<br />
with the <strong>USGS</strong> Western Earthquake<br />
“It’s important to view the 1906 Centennial<br />
as an incredible, teachable moment,”<br />
says <strong>USGS</strong> senior research scientist<br />
Mary Lou Zoback.<br />
Hazards Team in Menlo Park, Calif. Her<br />
primary research interest is the relationship<br />
between earthquakes and stress in<br />
the Earth’s crust. Areas of recent study<br />
include the San Andreas Fault system,<br />
the Basin and Range area of the western<br />
United States and intraplate regions such<br />
as the central and eastern United States.<br />
After the Centennial commemoration<br />
in April, Zoback plans to return full time<br />
to her research. Her current research interest<br />
is in understanding the deformation<br />
caused by active fault systems such as that<br />
associated with the epicenter of the 1906<br />
earthquake. The geologic evidence and<br />
persistent small earthquakes indicate that<br />
in this region, the Earth’s crust is pulling<br />
apart. She would like to determine<br />
the likelihood that the next big Bay Area<br />
earthquake will occur in this region and<br />
what additional risk and damage might<br />
occur from a similar magnitude earthquake<br />
that begins either south or north<br />
of this area and “steps over” to devastate<br />
areas further along the San Andreas<br />
Fault.<br />
Early in her career with <strong>USGS</strong>, Zoback<br />
headed the International Lithosphere<br />
Program’s World Stress Map Project. A<br />
team of 40 scientists from 30 countries<br />
focused on compiling, standardizing<br />
data collection and interpreting geologic<br />
and geophysical data on the modern-day<br />
stress fi eld. Working by telex and fax between<br />
1986 and 1992, before the advent<br />
of the Internet, the team made important<br />
discoveries about stresses acting in<br />
the interior of the Earth’s tectonic plates<br />
and producing earthquakes. In recognition<br />
of the signifi cance of this and other<br />
work, Zoback was elected to the National<br />
Academy of Sciences in 1995. She is currently<br />
the only <strong>USGS</strong> member of the<br />
NAS and also serves as a member of the<br />
NAS Council.<br />
Zoback joined <strong>USGS</strong> in 1978 after<br />
receiving her Ph.D. in geophysics from<br />
Stanford University. From 1999 to 2002,<br />
she was chief scientist of the Northern<br />
California Earthquake Hazards Program.<br />
Zoback has served on numerous national<br />
committees and panels on topics ranging<br />
from continental dynamics and storage<br />
of high-level radioactive waste to science<br />
education. She is active in several professional<br />
societies and served as the president<br />
of the Geological Society of America<br />
from 2000 to 2001. In 1987, she received<br />
the American Geophysical Union’s<br />
Macelwane Award for signifi cant contributions<br />
to the geophysical sciences by a<br />
young scientist of outstanding ability.<br />
When asked what draws her from<br />
research to her dedication to public<br />
outreach on earthquake hazards and<br />
preparedness, Zoback said, “I think it’s<br />
my personality. When I see problems, I<br />
want them to be fi xed. The study of geology<br />
and geophysics shows us that earthquakes<br />
are not random events and that<br />
they will happen again where they have<br />
happened before, so we must help society<br />
be prepared.”<br />
Zoback was instrumental in the redesign<br />
and recent publication of “Putting<br />
Down Roots in Earthquake Country<br />
— Your Handbook for the San Francisco<br />
Bay Region,” an earthquake preparedness<br />
guide. This publication by <strong>USGS</strong><br />
and 11 other partners was published in<br />
September 2005 and has already reached<br />
nearly a million people and is expected to<br />
be translated into Spanish, Vietnamese,<br />
Cambodian and Chinese during 2006.<br />
[See page 34.]<br />
Zoback is married to a fellow geophysicist,<br />
Mark Zoback, a professor at<br />
Stanford University and principal investigator<br />
on the National Science Foundation<br />
San Andreas Fault Observatory at<br />
Depth (SAFOD) project. The Zobacks<br />
have a grown son and daughter and are<br />
residents of Stanford. Combining their<br />
love of adventure and common interest<br />
in geology, they recently climbed Mount<br />
Kilimanjaro in Africa, went trekking in<br />
Bhutan and are planning to climb to<br />
Macchu Pichu in Peru after the 1906<br />
Centennial activities subside.<br />
April 2006 ★ PEOPLE, LAND & WATER 15
Chain Reaction:<br />
Earthquakes that Trigger Other Natural Hazards<br />
Compiled by Diane Noserale and Tania Larson<br />
Afi re destroys much of a major city. The side<br />
of a mountain collapses and then explodes.<br />
A train of waves sweeps away coastal villages<br />
over thousands of miles. All of these<br />
events are disasters that have started with<br />
or been triggered by an earthquake. Some of the triggers<br />
were among the largest earthquakes ever recorded. But<br />
the disasters that followed were often so large that the<br />
earthquakes were overshadowed, and so, we hear about<br />
the eruption of Mount St. Helens; devastating landslides<br />
in Washington and Pakistan; and tsunamis in Chile,<br />
Japan and the Indian Ocean. To understand these events,<br />
we need to remember the earthquakes.<br />
Tsunamis<br />
On Dec. 26, 2004, an earthquake ruptured an 800mile<br />
length of the sea fl oor from northern Sumatra to<br />
the Andaman Islands. A monstrous series of waves rolled<br />
across the Indian Ocean. Together, the earthquake and<br />
tsunami took more than 200,000 lives in 11 countries.<br />
In 1960, the largest earthquake ever recorded, a magnitude-9.5,<br />
hit Chile. Many survived the earthquake,<br />
only to perish in the tsunami that followed. The leading<br />
wave hit Hawaii in 15 hours. It struck Japan nearly<br />
24 hours after the earthquake. More than 2,000 people<br />
were killed in Chile, 61 in Hawaii and 138 in Japan.<br />
Hawaii reported $75 million in damage (1960 dollars),<br />
Japan $50 million. In the Philippines, 32 people<br />
were killed or missing, and the United States suffered<br />
$500,000 in damage.<br />
Hundreds of years earlier, on January 26, 1700,<br />
America’s Pacifi c Northwest was unknown to most of<br />
the world — a blank spot on maps of that time. Beneath<br />
the shallow waters offshore, an enormous earthquake<br />
unleashed, sending a series of waves that would engulf<br />
the Pacifi c Ocean. About 10 hours after the earthquake,<br />
the tsunami’s leading wave reached Japan. The waters<br />
swept away houses, fl ooded fi elds and inundated crops,<br />
frightening villagers with a disaster that seemed to have<br />
come from nowhere. That this tsunami had been triggered<br />
by an earthquake off the West Coast of North<br />
America would remain unknown until the 1990s, when<br />
the link was established through a combination of North<br />
American geology and Japanese historical research.<br />
Volcanoes<br />
Volcanoes produce a variety of hazards — hot-ash<br />
and mudfl ows, landslides, tsunamis, lava fl ows and volcanic<br />
gases. And quite often, small-to-moderate earthquakes<br />
serve as a warning of an impending eruption.<br />
Volcanoes erupt when hot, liquid rock, called “magma,”<br />
moves upward through cracks in the Earth’s surface.<br />
This motion, and the building up of pressure, generates<br />
volcanic earthquakes. Monitoring volcanoes for these<br />
tremors has proven a powerful tool in the prediction of<br />
16 PEOPLE, LAND & WATER ★ April 2006<br />
volcanic eruptions.<br />
Scientists have known that movement of magma often<br />
triggers earthquakes, but they are discovering that this<br />
relationship may also work in reverse. Scientists are looking<br />
at earthquakes that meet very specifi c criteria: a magnitude<br />
of 6 or higher; a location on major fault zones<br />
near a volcano; and a later eruption of a nearby volcano.<br />
They are fi nding evidence that these earthquakes might<br />
have triggered the eruptions.<br />
In the early morning of Nov. 29, 1975, a magnitude-<br />
7.2 earthquake struck the Big Island of Hawaii. Less than<br />
45 minutes later, Kilauea Volcano starting erupting. That<br />
eruption ended after about 17 hours. The small volume<br />
of magma and brief duration suggest that the eruption<br />
was triggered by the earthquake.<br />
In January 1700, a mysterious tsunami hit Japan without the<br />
warning that a nearby earthquake usually provides. Nearly<br />
three centuries later, discoveries in North America revealed its<br />
source. The evidence tells of a catastrophe that helps guide<br />
preparations for future earthquakes and tsunamis in the United<br />
States and Canada. Read the scientifi c detective story in “The<br />
Orphan Tsunami of 1700.”<br />
This was not the fi rst eruption on Hawaii that appears<br />
to have been triggered by an earthquake. Other scientists<br />
have linked Hawaii’s largest historic earthquake, estimated<br />
to have a magnitude of at least 7.5, in 1868 to a small<br />
eruption from Kilauea.<br />
On June 15, 1991, Mount Pinatubo in the northern<br />
Philippines exploded, sending a column of ash into the<br />
atmosphere. About 11 months earlier, a magnitude-7.8<br />
earthquake had struck about 60 miles from the volcano.<br />
Scientists from the <strong>USGS</strong> and the Philippine Institute of<br />
Volcanology and Seismology have found that these two<br />
events were related. According to the study, compression<br />
from the earthquake might have squeezed a small<br />
volume of magma into the volcano’s reservoir. Strong<br />
ground shaking might have also compressed the reservoir<br />
or triggered movement along previously stressed<br />
faults that allowed magma to ascend into the volcano.<br />
Following a massive eruption, a volcano can collapse,<br />
as the empty magma chamber cannot support<br />
the weight of the material above. The result is a large,<br />
concave structure called a “caldera.” These structures are<br />
found around the world. Yellowstone and Crater Lake<br />
are two examples in the United States. Research shows<br />
that activity at calderas often occurred within months or<br />
even hours of large regional earthquakes, sometimes as<br />
a precursor to the earthquakes and sometimes as a result<br />
of them.<br />
<strong>Land</strong>slides<br />
Heavy rain, wildfi res, volcanic eruptions and human<br />
activity often work together to cause landslides. In hilly<br />
terrain, earthquakes can easily cause landslides, and<br />
these landslides are often more destructive than the<br />
triggering event.<br />
In 1964, the magnitude-9.2 earthquake that violently<br />
shook southern Alaska also induced huge landslides<br />
throughout Anchorage, including the downtown business<br />
district. The 1994 Northridge earthquake triggered<br />
more than 10,000 landslides in the hills around<br />
Los Angeles.<br />
On May 18, 1980, a magnitude-5.1 earthquake triggered<br />
the collapse of the north fl ank of Mount St.<br />
Helens, resulting in the largest landslide ever recorded.<br />
Debris raced down the mountain at speeds in excess of<br />
180 miles per hour. Within about 10 minutes, enough<br />
debris to fi ll 250 million dump trucks traveled up to<br />
14 miles down the valley, destroying buildings, bridges<br />
and many miles of highway. The debris dammed the<br />
North Fork Toutle River and its tributaries and posed<br />
hazards to downstream communities because of the possible<br />
failure of the dams and catastrophic fl ooding. With<br />
an earthquake, a massive landslide, a volcanic blast and<br />
fl ooding — Mount St. Helens was truly a multi-hazard<br />
disaster.<br />
The Clear Case for Multi-Hazard Science<br />
From the 1700 orphan tsunami to the 1991 Mount<br />
Pinatubo eruption, these examples show that, to be truly<br />
understood, hazards cannot be studied in isolation. By<br />
developing a better understanding of how one hazard<br />
event has triggered others in the past, we are working<br />
to identify potential hazards before they become multihazard<br />
disasters.<br />
The <strong>USGS</strong>, along with numerous partners, carries out<br />
research and monitoring designed to reduce losses from<br />
future hazards. From improving building codes to identifying<br />
hazard zones and evacuation routes, integrated<br />
science can provide emergency managers with the information<br />
they need to continue to make America safer<br />
from natural hazards. After the tragic events of 2004 and<br />
2005, scientists have redoubled their efforts to help the<br />
public learn how to recognize the danger and survive<br />
natural hazard events. These hazards will always be with<br />
us, but by examining both individual hazards and how<br />
they relate to one another, scientists are building a bigger<br />
picture and a better understanding that is helping to save<br />
lives and property.
About “This Dynamic Planet”<br />
Legend<br />
This Dynamic Planet — Special Poster Pullout<br />
This map shows many of the features that have shaped<br />
— and continue to change — our dynamic planet. Most<br />
new crust forms at ocean ridge crests, is carried slowly<br />
away by plate movement, and is ultimately recycled deep<br />
into the earth — causing earthquakes and volcanism<br />
along the boundaries between moving tectonic plates.<br />
Oceans are continually opening (for example, Red Sea,<br />
Atlantic) or closing (for example, Mediterranean). Because<br />
continental crust is thicker and less dense than<br />
thinner younger oceanic crust, most does not sink deep<br />
enough to be recycled and remains largely preserved<br />
on land. Consequently, most continental bedrock is far<br />
older than the oldest oceanic bedrock.<br />
The earthquakes and volcanoes that mark plate<br />
boundaries are clearly shown on this map, as are craters<br />
made by impacts of extraterrestrial objects that punctuate<br />
Earth’s history, causing some catastrophic ecologi-<br />
Volcanoes — Data from Global Volcanism Program, Smithsonian Institution, Washington,<br />
D.C.; accessed at http://www.volcano.si.edu/world/summary.cfm,<br />
March 16, 2005<br />
Erupted A.D. 1900 through 2003<br />
Erupted A.D. 1 through 1899<br />
Erupted in Holocene time (Paste 10,000 years), but no known eruptions<br />
since A.D. 1<br />
Uncertain Holocene activity and fumarolic activity<br />
Impact Craters — Data from University of New Brunswick, Planetary and Space<br />
Science Centre, Earth Impact Database; accessed at http://www.unb.ca/<br />
passc/ImpactDatabase/. October 23, 2003 (also see Grieve, 1998). Geologic<br />
age span: 50 years to 2,400 million years. Crater diameter indicated<br />
below<br />
70 km (shown at actual map scale)<br />
Notable Events — Numbers next to a few symbols — of many thousands shown<br />
— denote especially noteworthy events, keyed to correspondingly numbered<br />
entries in tables found on the back of the map. These numbered events have<br />
produced devastating natural disasters, advanced scientific understanding<br />
or piqued popular interest. They remind us that the map’s small symbols<br />
may represent large and geologically significant events.<br />
Volcanoes<br />
Earthquakes<br />
I mpact craters<br />
Plate Tectonics<br />
Divergent (sea-floor spreading) and transform fault boundaries — Red lines<br />
mark spreading centers where most of the world’s volcanism takes place;<br />
thickness of lines indicates divergence create, in four velocity ranges. White<br />
number is speed in millimeters per year (mm/yr) from DeMets and others<br />
(1994). The four spreading-rate ranges are 90 mm/yr. Thin black line marks the plate boundary, whether<br />
sea-floor spreading center or transform fault. On land, divergent boundaries<br />
are commonly diffuse zones; therefore, most are not shown. The only transform<br />
faults shown on land are those separating named plates.<br />
This Dynamic Planet<br />
The following pages are a special poster pullout featuring the front of the <strong>USGS</strong> map, “This Dynamic Planet.”<br />
cal change. Over geologic time, continuing plate movements,<br />
together with relentless erosion and redeposition<br />
of material, mask or obliterate traces of earlier plate-tectonic<br />
or impact processes, making the older chapters of<br />
Earth’s 4,500-million-year history increasingly difficult<br />
to read. The recent activity shown on this map provides<br />
only a present-day snapshot of Earth’s long history, help-<br />
ing to illustrate how its present surface came to be.<br />
The map is designed to show the most prominent<br />
features when viewed from a distance, and more detailed<br />
features upon closer inspection. The back of the<br />
actual “This Dynamic Planet” map zooms in further,<br />
highlighting examples of fundamental features, while<br />
providing text, timelines, references and other resources<br />
to enhance understanding of this dynamic planet. Both<br />
the front and back of the map illustrate the enormous<br />
recent growth in our knowledge of planet Earth. Yet,<br />
much remains unknown, particularly about he processes<br />
operating below the ever-shifting plates and the detailed<br />
geological history during all but the most recent<br />
stage of Earth’s development.<br />
The complete and full-sized version of “This Dynamic<br />
Planet” will be available from the <strong>USGS</strong> in the summer<br />
of 2006.<br />
Plate motion — Data from Rice University Global Tectonics Group. Length<br />
of arrows is proportional to plate velocity, in millimeters per year. These approximate<br />
rates and directions are calculated from angular velocities with<br />
respect to hotspots, assumed to be relatively fixed in the mantle (see plate<br />
motion calculator at http://tectonics.rice.edu/hs3.html).<br />
Plate convergence — More accurately known than “absolute” plate motion,<br />
convergence data are shown by arrows of uniform length showing direction<br />
and speed, in millimeters per year relative to the plate across the boundary.<br />
Data from Charles DeMets (University of Wisconsin at Madison, written commun.,<br />
2003) and Bird 2003)<br />
Earthquakes — Data from Engdahl and Villaseñor (2002). From 1900 through<br />
1963, the data are complete for all earthquakes >6.5 magnitude; from<br />
1964 through 1999, the data are complete for all earthquakes >5.0 magnitude.<br />
Most location uncertainties 7.7) have been added for completeness through<br />
2004; data from <strong>USGS</strong> National Earthquake Information Center at http://<br />
neic.usgs.gov/, accessed January 4, 2005. An epicenter is the surface location<br />
of the first rupture on an earthquake fault. Symbols shown represent<br />
epicenters. For earthquakes larger than about magnitude 7.0, the size of the<br />
rupture zone, which can extend hundreds of kilometers from the epicenter,<br />
is larger than the symbols used on this map<br />
Earthquakes that occurred from 1750 to 1963 within stable plate interiors<br />
on continents — Data from A.C. Johnston (Center for Earthquake Research<br />
and Information, University of Memphis, written, commun., 2002). Even<br />
though these epicenters do not meet the precise location criteria of Engdahl<br />
and Villaseñor (2002), they are plotted here to remind readers of the potentially<br />
hazardous earthquakes that are distant from known plate boundaries.<br />
Size of symbol proportional to earthquake magnitude<br />
Notable pre-1900 earthquakes — Nos. 1,2,3,6 and 7<br />
April 2006 ★ PEOPLE, LAND & WATER 17
18 PEOPLE, LAND & WATER ★ April 2006<br />
17.
April 2006 ★ PEOPLE, LAND & WATER 19
An earthquake is a sudden<br />
movement of the Earth’s<br />
crust caused by the abrupt<br />
release of pressure that<br />
has accumulated over a<br />
long time. The energy it releases can<br />
be generated by a sudden dislocation<br />
of segments of the crust; by a volcanic<br />
eruption; or by human activities, such as<br />
mining, oil extraction and filling reservoirs.<br />
Most destructive earthquakes are<br />
caused by dislocations of the crust. The<br />
crust may first bend, and then, when the<br />
stress exceeds the strength of the rocks,<br />
break and “snap” to a new position.<br />
The Earth is formed of several distinct<br />
layers that have very different physical<br />
and chemical properties. The outer<br />
layer, which averages about 22 miles<br />
in thickness, consists of about a dozen<br />
large, irregularly shaped, brittle plates<br />
on top of a pliable inner layer. These<br />
plates are constantly moving, their edges<br />
sliding over, under, away from or past<br />
each other. Most earthquakes occur at<br />
the boundaries where the plates meet.<br />
All earthquakes occur along faults,<br />
which reflect zones of weakness in the<br />
Earth’s crust. A fault is a fracture in the<br />
Earth’s crust where two blocks of the<br />
crust have slipped with respect to each<br />
other. Even if a fault zone has recently<br />
experienced an earthquake, there is no<br />
guarantee that all the pressure has been<br />
relieved. Another earthquake could still<br />
occur within a short period of time.<br />
Many of the most active faults are deep<br />
20 PEOPLE, LAND & WATER ★ April 2006<br />
This Dynamic Planet — Special Poster Pullout<br />
Earthquake Basics<br />
The Fundamentals and Terminology of Earthquake Science<br />
Aerial view of the San Andreas Fault slicing<br />
through the Carrizo Plain in the Temblor<br />
Range east of the city of San Luis Obispo,<br />
Calif. Photo: Robert E. Wallace.<br />
within the crust and are not visible at<br />
the surface, especially where the plates<br />
are colliding with each other.<br />
The hypocenter of an earthquake is<br />
the location beneath the surface where<br />
the rupture of the fault begins. The<br />
epicenter of an earthquake is the location<br />
directly above the hypocenter on<br />
the surface of the Earth. The focal depth<br />
of an earthquake is the depth from the<br />
Earth’s surface to the hypocenter. The<br />
location of an earthquake is commonly<br />
described by the geographic position of<br />
its epicenter and by its focal depth.<br />
Measuring Earthquakes<br />
When an earthquake occurs, vibra-<br />
tions called seismic waves are generated.<br />
These waves travel outward from<br />
the source of the earthquake along the<br />
surface and through the Earth at varying<br />
speeds depending on the material<br />
through which they move. The vibrations<br />
produced by earthquakes are<br />
detected, recorded and measured by<br />
instruments called seismographs. By<br />
responding to the motion of the ground<br />
surface beneath it, a seismograph creates<br />
a zigzag line called a seismogram<br />
that reflects the changing intensity of<br />
the vibrations. From the data expressed<br />
in seismograms, scientists can estimate<br />
how much energy was released and determine<br />
the time, the hypocenter and<br />
the type of faulting of an earthquake.<br />
Magnitude verses Intensity<br />
The severity of an earthquake can<br />
be expressed in several ways. The<br />
magnitude of an earthquake describes<br />
its size. Most magnitude computation<br />
procedures (sometimes referred to as the<br />
Richter scale) measure the amplitude<br />
of various seismic waves. The moment<br />
magnitude is a measure of the physical<br />
dimensions of the zone that ruptured in<br />
the earthquake (i.e., the area of the fault<br />
that ruptured) times the amount of offset,<br />
and that too can be estimated from data<br />
processed by modern seismographs. [See<br />
“Measuring Magnitude” page 25.]<br />
In general, each earthquake has one<br />
preferred magnitude, but each per-<br />
son who feels or observes a quake can<br />
describe its intensity at their location. The<br />
intensity is an observation of how strongly<br />
a shock was felt at a particular location.<br />
To quantify the effect or intensity of an<br />
earthquake, scientists use the Modified<br />
Mercalli Intensity Scale. While magnitudes<br />
are expressed as Arabic numbers<br />
and in theory have no upper or lower<br />
limits, intensity is expressed in Roman<br />
numerals I-XII. Evaluation of earthquake<br />
intensity can be made only after eyewitness<br />
reports and results of field investigations<br />
are studied and interpreted. (Was it<br />
barely felt, did it knock dishes off shelves,<br />
destroy poorly constructed buildings or<br />
destroy almost all buildings?)<br />
Although magnitude is an important<br />
factor in the effect of an earthquake,<br />
earthquakes of large magnitude do not<br />
necessarily cause the most intense surface<br />
effects. An earthquake’s destructiveness<br />
depends on many factors: magnitude,<br />
focal depth and local geologic conditions,<br />
as well as the distance from the<br />
epicenter, the population density, and the<br />
design and construction types of buildings<br />
and other structures. The combination<br />
of these factors is often what determines<br />
the difference between slight damage<br />
and catastrophe.<br />
Compiled by Steve Vandas with assistance<br />
from Diane Noserale. Much of the<br />
information was obtained from the <strong>USGS</strong><br />
publication “Earthquakes” by Kaye M.<br />
Shedlock and Louis C. Pakiser.
What it’s Like to be an Earthquake Scientist<br />
By Tania Larson<br />
In a field where the work is critical<br />
to saving lives, earthquake scientists<br />
often operate at a dizzying<br />
pace, collaborating with partners<br />
around the world as they try to<br />
solve the many mysteries of the Earth’s<br />
processes. And just when they least expect<br />
it, they are thrown into the public spotlight,<br />
expected to respond to the fear and<br />
confusion that inevitably follow natural<br />
disasters with answers they may or may<br />
not have. It is tough, challenging work;<br />
but for most, the rewards of scientific<br />
discovery and knowing that they are giving<br />
something back to society make it all<br />
worthwhile.<br />
<strong>USGS</strong> geophysicist Ross Stein sums<br />
up his average day with two words:<br />
“collaborative chaos.” Ostensibly, Stein<br />
says, his job is to examine how one earthquake<br />
sets up the next, how one earthquake<br />
can promote or inhibit another. In<br />
reality, he does much more.<br />
“In some ways,” he says, “I’m an entrepreneur.<br />
I have to raise funds, account for<br />
them and make sure they are being used<br />
responsibly. In some ways, I’m a teacher,<br />
working with high school, college and<br />
post-doctoral students, making sure they<br />
learn the trade and take wing. And in<br />
some ways, I’m a student, learning from<br />
my colleagues and trying to do a better<br />
job of understanding earthquakes.”<br />
Stein is currently working on roughly<br />
half a dozen projects, and his office is<br />
virtually a revolving door as colleagues,<br />
post-docs and student interns come and<br />
go with questions, problems and ideas.<br />
One of the joys of the job, Stein says,<br />
is simply being a research scientist, following<br />
his ideas to wherever they lead.<br />
“I have the opportunity to follow my own<br />
hunches, to raise the funds, do the research<br />
and make it happen — and that’s<br />
my shot,” he says.<br />
One of the challenges, Stein says, is trying<br />
to figure out the strengths and weaknesses<br />
of your ideas, finding competing<br />
ideas and testing them against your own.<br />
Stein makes no bones about the fact that<br />
science research is competitive. Considering<br />
the innate bias of wanting to prove<br />
your own theories right, he feels the competition<br />
is healthy.<br />
“There is a competition of ideas,” he<br />
says. “You need to be constantly surveying<br />
alternatives, examining them for<br />
strengths and fine tuning your theories.<br />
It’s a process that is very competitive and<br />
very open.”<br />
Earthquakes are complicated events,<br />
and discovering how the pieces fit together<br />
takes not only collaboration and inge-<br />
Talking with <strong>USGS</strong> Geophysicist Ross Stein<br />
Above, Ross Stein<br />
prepares for a flight<br />
to film the fault and<br />
the city of Istanbul<br />
for the IMAX/National<br />
Geographic film<br />
“Forces of Nature.”<br />
Stein wears a climbing<br />
harness underneath<br />
his jacket so he<br />
can lean out of the<br />
helicopter, and the<br />
chopper’s doors are<br />
removed in order to<br />
fit the IMAX camera<br />
inside.<br />
nuity, but also a balance of knowing when<br />
to look for a new piece of the puzzle and<br />
when to stick with the piece you are already<br />
working with.<br />
As Stein points out, however, earthquake<br />
science is peculiar in that it is<br />
largely an experimental science, yet<br />
earthquake scientists cannot set up their<br />
experiments. Because they do not know<br />
when and where earthquakes will occur,<br />
they do not have the preparation and<br />
careful planning afforded to other experimental<br />
sciences. It is difficult to have the<br />
right equipment set up in the right spot at<br />
the right time.<br />
In earthquake science, opportunities<br />
come unexpectedly. “Usually,” Stein says,<br />
“when you are working frantically to finish<br />
up something else.” This creates a dilemma.<br />
“When they hit,” says Stein, “you<br />
have to make a decision about whether<br />
to drop what you’re doing to chase something<br />
new, something that could turn out<br />
to be a phantom, or stick to what you’re<br />
doing and possibly miss the bus for something<br />
that could be a new breakthrough.”<br />
Stein believes that in order to be successful,<br />
earthquake scientists need to find<br />
a balance. He says, “You can’t always<br />
chase something new or you’ll never<br />
finish. And you can’t always finish what<br />
you’re working on or you’ll never discover<br />
anything new.”<br />
“It’s a painful choice,” he admits. “But<br />
if you can’t handle that choice, this isn’t<br />
the field for you.”<br />
Although some scientists are happiest<br />
working close to home, Stein seems to<br />
jump at opportunities to cross an ocean.<br />
This is because he believes international<br />
efforts are imperative to advancing the<br />
science. He says, “We’re never going to<br />
fully understand earthquakes in the United<br />
States unless we go to places where<br />
the earthquakes are big, frequent and<br />
well-recorded.”<br />
He is currently working on projects<br />
connected to Japan, Algeria and Turkey.<br />
“Japan,” Stein says, “is lush in the quality<br />
of records.” Algeria and Turkey, on<br />
the other hand, are more vulnerable. He<br />
says, “They have numerous earthquakes,<br />
but their records are not as good. So, international<br />
work is some giving and some<br />
taking. We’re learning in some places and<br />
offering something back in others.”<br />
Communicating to the public is another<br />
way earthquake scientists give back.<br />
It is also a big responsibility. “There is a<br />
strong connection with the public,” Stein<br />
says. “They are interested in what we do,<br />
and we have a responsibility to speak hon-<br />
Above, Ross Stein with<br />
Professor Mustafa Erdik<br />
at the Bosphorous University<br />
earthquake engineering<br />
shake table.<br />
At left, Ross Stein sits in<br />
Istanbul’s Aya Sofya, which<br />
was the largest domed<br />
structure in the world for<br />
600 years. It has sustained<br />
12 large earthquakes in<br />
15 centuries, serving as an<br />
ancient seismometer for<br />
earthquake scientists. Built<br />
as a Christian cathedral by<br />
Justinian in A.D. 537,<br />
becoming an Islamic mosque<br />
in 1453 and a secular<br />
museum in 1938, it is one of<br />
the world’s great religious,<br />
architectural and scientific<br />
marvels.<br />
estly. We have a twin responsibility: to tell<br />
what we know and what we don’t know.”<br />
In times of disaster, there can be a lot<br />
of pressure for information. “When you<br />
are least prepared is when you will have<br />
to talk to the public,” Stein says. “Fifteen<br />
minutes after an earthquake, there will be<br />
30 cameras on you. And that’s when you<br />
know the least. You have to be honest,<br />
clear and straight with people.”<br />
“We have to play it straight,” Stein<br />
emphasizes, “not pretend what we don’t<br />
know and not hold back what we do<br />
know. That’s our contract with the public.<br />
That’s an important element of being<br />
a government scientist and one I enjoy<br />
and value.”<br />
At the end of the day, however, it is scientific<br />
discovery that Stein enjoys most<br />
about being a <strong>USGS</strong> scientist. He says,<br />
“I’m not principally responsible for teaching,<br />
but for discovery. I am responsible for<br />
conducting research, and when we make<br />
discoveries, for making sure they are published.<br />
And I’m happy with that.”<br />
This is because, for Stein, discovery is<br />
the best part of the job. He says, “To discover<br />
something new — that’s the intoxicating<br />
part, finding out something about<br />
how the Earth works. That’s what drives<br />
all scientists.”<br />
April 2006 ★ PEOPLE, LAND & WATER 21
By David Hebert<br />
If you were to learn that in 1886,<br />
a major U.S. city was ravaged by<br />
a magnitude-7.3 earthquake in<br />
which 60 people were killed and<br />
millions of dollars of damage<br />
done, where would you guess it had happened<br />
— Los Angeles? San Francisco?<br />
Anchorage?<br />
Try Charleston, S.C.<br />
In fact, damaging earthquakes have<br />
rocked several U.S. cities far from Alaska<br />
or California — Boston, Memphis and<br />
Salt Lake City, to name a few. Chances<br />
are, they will again, and those at risk need<br />
to be ready.<br />
That’s where the Advanced National<br />
Seismic System (ANSS) comes in.<br />
The ANSS is a proposed nationwide<br />
earthquake-monitoring system designed<br />
to provide accurate and timely data and<br />
information products for seismic events,<br />
including their effects on buildings<br />
and structures.<br />
“The ultimate goal of the ANSS is to<br />
save lives, ensure public safety and reduce<br />
economic losses,” said Bill Leith,<br />
a <strong>USGS</strong> scientist and coordinator of the<br />
ANSS. “Rapid, accurate information<br />
about earthquake location and shaking,<br />
now available in parts of California,<br />
Washington and Utah, is generated by<br />
data from a dense network of seismicmonitoring<br />
instruments installed in highrisk<br />
urban areas. The information has<br />
revolutionized the response time of emergency<br />
managers to an earthquake in these<br />
areas, but its success depends on further<br />
deployment of instruments in other vulnerable<br />
cities across the United States.”<br />
Although the frequency of earthquakes<br />
on the West Coast is higher than other<br />
areas of the contiguous United States,<br />
the geologic characteristics nationwide<br />
By David Hebert<br />
The Advanced National Seismic System:<br />
A Sure Bet for a Shaky Nation<br />
<strong>USGS</strong> scientists from across the<br />
country have been part of many incredible<br />
and memorable earthquake<br />
experiences. With that in mind, several<br />
of them were asked, “What has<br />
been your proudest, most exciting<br />
or most noteworthy moment in<br />
<strong>USGS</strong> earthquake science?”<br />
The answers are as different as the<br />
scientists themselves.<br />
22 PEOPLE, LAND & WATER ★ April 2006<br />
Twenty-six U.S.<br />
urban areas, identified<br />
in the map at<br />
right, are at risk of<br />
significant seismic<br />
activity:<br />
Albuquerque, N.M.<br />
Anchorage, Alaska<br />
Boise, Idaho<br />
Boston, Mass.<br />
Charleston, S.C.<br />
Chattanooga-<br />
Knoxville, Tenn.<br />
Eugene-<br />
Springfield, Ore.<br />
Evansville, Ind.<br />
Fresno, Calif.<br />
Las Vegas, Nev.<br />
Los Angeles, Calif.<br />
Memphis, Tenn.<br />
New York, N.Y.<br />
Portland, Ore.<br />
Alaska, Hawaii and Puerto Rico<br />
also have proposed sites.<br />
All other sites to be determined<br />
on a region-by-region basis.<br />
mean that research and monitoring are<br />
necessary everywhere.<br />
“When people think of faults and<br />
earthquakes, they tend to think of the San<br />
Andreas Fault, but earthquakes in the<br />
eastern United States might be different,”<br />
said Eugene Schweig, a <strong>USGS</strong> geologist<br />
in Memphis, Tenn. “Assuming buildings<br />
will shake the same in the East as they do<br />
in California is probably not valid.”<br />
ANSS network instruments are already<br />
at work in many areas and are planned<br />
for other earthquake-prone regions nationwide,<br />
including Northern and Southern<br />
California, the Pacific Northwest,<br />
Alaska, Salt Lake City, the New Madrid<br />
Seismic Zone, and along the Atlantic<br />
Provo-Orem, Utah<br />
Reno, Nev.<br />
Sacramento, Calif.<br />
St. Louis, Mo.<br />
Salinas, Calif.<br />
Salt Lake City, Utah<br />
San Diego, Calif.<br />
Coast in South Carolina, New York and<br />
Massachusetts.<br />
The ANSS, when fully implemented,<br />
will integrate all regional and national<br />
networks with 7,000 new seismic instruments,<br />
including 6,000 strong-motion<br />
sensors in 26 at-risk urban areas. (See<br />
map for a list of these areas.)<br />
Boston is one of those urban areas<br />
— indeed, it has experienced damaging<br />
earthquakes before. In 1755, an earthquake<br />
centered near Cape Ann, Mass.,<br />
caused building damage and chimney<br />
collapses in Boston. The buildup of the<br />
city since then would likely make matters<br />
much worse if such an earthquake were<br />
to happen there today.<br />
San Francisco-Oakland, Calif.<br />
San Juan, P.R.<br />
Santa Barbara, Calif.<br />
Seattle, Wash.<br />
Stockton-Lodi, Calif.<br />
<strong>USGS</strong> Earthquake Scientists — A Nationwide Notion of Pride<br />
Susan Hough<br />
Title: Geophysicist/Seismologist<br />
Location: Pasadena, Calif.<br />
Length of service with the <strong>USGS</strong>: 14<br />
years<br />
In April of 1992, less than two months<br />
after joining the <strong>USGS</strong> office in Pasadena,<br />
Calif., I led the deployment of portable<br />
seismometers after the magnitude-6.1<br />
“Joshua Tree” earthquake struck the<br />
Southern California desert near Palm<br />
Springs. My colleagues and I were able<br />
✩ Proposed ANSS urban networks.<br />
to keep these instruments running for<br />
the next few months, recording many<br />
thousands of aftershocks.<br />
On the morning of June 28, 1992, the<br />
magnitude-7.3 <strong>Land</strong>ers earthquake struck<br />
just to the north of where the Joshua<br />
Tree event had occurred. The portable<br />
seismometers — instruments developed<br />
by the <strong>USGS</strong> in Menlo Park — operated<br />
faithfully, recording invaluable close-in<br />
seismograms of the largest earthquake in<br />
California in 40 years.<br />
Now, as in 1906, seismology remains a<br />
data-driven science: Our most important<br />
Highest hazard<br />
Lowest hazard<br />
The earthquake<br />
hazards map of the<br />
conterminous United<br />
States shows the areas<br />
of highest seismic<br />
hazard in red and lowest<br />
seismic hazard in<br />
grey. The stars indicate<br />
urban areas where<br />
dense urban monitoring<br />
networks are<br />
proposed. The regional<br />
networks (not shown)<br />
will be concentrated<br />
in the areas of highest<br />
risk, and the national<br />
networks (not shown)<br />
will have sites evenly<br />
distributed throughout<br />
the country.<br />
John Ebel, a professor of geophysics at<br />
Boston College and northeast coordinator<br />
for ANSS implementation, estimates<br />
that damaging earthquakes (magnitude 5<br />
or greater) happen in New England every<br />
50 to 60 years. In 1940, there was a magnitude-5.5<br />
quake in New England, and<br />
the clock is ticking.<br />
“I talk to people all the time who ask,<br />
‘Earthquakes don’t really happen here,<br />
do they?’ ” Ebel said. “And I answer, ‘Yes,<br />
they do.’ ”<br />
Although the frequency of earthquakes<br />
is much greater in the West, the<br />
damaging effects of a quake in the East<br />
travel farther.<br />
“The 1994 magnitude-6.7 Northridge,<br />
leaps in understanding have invariably<br />
come after large earthquakes not only<br />
strike but are recorded by increasingly<br />
sophisticated instrumentation.<br />
Earthquakes do not, however, record<br />
themselves. Long- and short-term monitoring<br />
requires ingenuity and commitment.<br />
The <strong>USGS</strong> has taken a leadership<br />
role with such efforts in the United States<br />
for nearly half a century. Looking back at<br />
my own career, I am proud of any number<br />
of accomplishments, but none more than<br />
the chance to contribute in a modest way<br />
to this tradition of excellence.
Calif., earthquake was not felt in San<br />
Francisco, less than 400 miles away,”<br />
Ebel said. “If that same earthquake happened<br />
in Boston, it would be felt in<br />
Minneapolis-St. Paul, more than 1,000<br />
miles away. There is potential for several<br />
metropolitan areas to be damaged by a<br />
single, large earthquake in the East.”<br />
In 1811 and 1812, a series of earthquakes,<br />
ranging in estimated magnitude<br />
from 7.5 to 8.0, started near New Madrid,<br />
Mo., and shook cities from St. Louis to<br />
Cincinnati. Although the probability for<br />
another 1811/1812-type sequence in the<br />
next 50 years is 7 to 10 percent, the probability<br />
for a magnitude-6 or greater during<br />
that same period is 25 to 40 percent.<br />
“Based on paleoseismic work, we know<br />
that 1811- and 1812-like events have happened<br />
two or three times in the past,”<br />
said Mitch Withers, seismic networks<br />
director at the Center for Earthquake<br />
Research and Information at the University<br />
of Memphis. “So we know it’s not a<br />
fluke and that they tend to come in sequences,<br />
where there are several events<br />
clustered together in time. From a hazard<br />
and recovery point of view, it’s much<br />
more difficult if we have several in a row<br />
like that.”<br />
Earthquake hazard concerns stretch to<br />
the Mountain States as well, where several<br />
earthquakes since 1935 have caused<br />
more than 30 deaths in Idaho, Montana<br />
and Wyoming. The threat of such a<br />
quake happening in a mountain urban<br />
area means preparation and monitoring<br />
are vital in at-risk locations such as Salt<br />
Lake City.<br />
“We haven’t had our 1906 earthquake<br />
in Utah yet, but our partnership with<br />
the <strong>USGS</strong> under the ANSS has made us<br />
feel much better prepared to deal with it<br />
when it happens,” said Gary Christenson,<br />
a geologist and manager of the Geologic<br />
Hazards Program at the Utah Geological<br />
Survey. “The <strong>USGS</strong> has been a partner<br />
in earthquake monitoring in Utah from<br />
the beginning, and implementation of<br />
the ANSS has been a major achievement<br />
in improving preparedness, response and<br />
scientific/engineering data gathering.”<br />
The variety of earthquake hazard concerns<br />
that are both unique to and shared<br />
by urban areas nationwide illustrates<br />
the need for a consolidated, cooperative<br />
approach to information gathering<br />
and mitigation.<br />
“The ANSS is working toward development<br />
and implementation of integrated<br />
software and human resources to more effectively<br />
use these with existing hardware<br />
resources to provide timely and valuable<br />
information to the public,” Withers said.<br />
Timely and valuable information is<br />
a key ingredient to effective mitigation.<br />
A possibility <strong>USGS</strong> scientists have been<br />
keenly aware of throughout the development<br />
of ANSS is that an early warning<br />
of even a few seconds would give schoolchildren<br />
enough time to get under their<br />
desks and would allow managers time to<br />
stop trains and subways, shut off pipelines<br />
and suspend medical procedures.<br />
These sorts of warnings can only be<br />
accomplished through national cooperation,<br />
so a nationwide network of science<br />
and civic partners is working to make the<br />
ANSS a reality.<br />
“The <strong>USGS</strong> and its regional partners<br />
combine resources to augment<br />
ANSS-funded stations to operate regional<br />
seismic networks,” Withers said.<br />
These partners include state geological<br />
surveys, university researchers, emergency<br />
managers, engineering organizations<br />
and more. The <strong>USGS</strong> works to unify<br />
perspectives and efforts to create a single,<br />
national force with which to address<br />
earthquake concerns and provide timely<br />
information.<br />
“To have the <strong>USGS</strong> as overseer and coordinator<br />
of the ANSS makes sense,” Ebel<br />
said. “The <strong>USGS</strong> is nationally involved in<br />
earthquake research and monitoring and<br />
it has expertise in house.”<br />
The <strong>USGS</strong> is the only agency in the<br />
United States responsible for the routine<br />
monitoring and notification of earthquakes.<br />
The <strong>USGS</strong> fulfills this role by<br />
operating the U.S. National Seismograph<br />
Network, the National Earthquake<br />
Information Center, the National Strong<br />
Motion Program and by supporting 14 regional<br />
networks in areas of moderate to<br />
high seismic activity. All of these efforts<br />
are being integrated into the ANSS.<br />
“The ANSS contributes to the infrastructure<br />
that enables monitoring to be<br />
much more cooperative and integrated,<br />
allowing information to the public that<br />
combines data from all regional partners,”<br />
Withers said.<br />
The goal of <strong>USGS</strong> earthquake moni-<br />
toring is to mitigate risk — using better<br />
instruments to understand the damage<br />
caused by shaking and to help engineers<br />
create stronger and sounder structures<br />
that ensure vital infrastructures, utility,<br />
water and communication networks can<br />
keep operating safely and efficiently.<br />
The ANSS comprises several products<br />
that work to engage and inform the public,<br />
emergency managers and decision<br />
makers:<br />
• Recent Earthquakes — Automatic<br />
maps and event information are available<br />
within minutes online at the <strong>USGS</strong><br />
Earthquake Hazards Program Web site,<br />
which displays earthquake locations<br />
nationwide.<br />
• Did You Feel It? – This is a citizen<br />
science Web page where shaking intensity<br />
maps are created by the people who<br />
<strong>USGS</strong> Earthquake Scientists — A Nationwide Notion of Pride<br />
Roberto J. Anima<br />
Title: Geologist<br />
Location: Menlo Park, Calif.<br />
Length of service with the <strong>USGS</strong>: 33 years<br />
For the past six or seven years, I have had the<br />
opportunity to report, both locally and internationally,<br />
to the Spanish-speaking public on both<br />
television and radio, about earthquakes, tsunamis<br />
and other natural disasters. I feel that this<br />
is important because much of the information<br />
reported in English was not being reported to<br />
the Spanish-speaking community. Because we<br />
live in an earthquake-prone area — the entire<br />
West Coast of North, Central and South America<br />
The ultimate goal of the<br />
ANSS is to save lives, ensure<br />
public safety and reduce<br />
economic losses.<br />
— Bill Leith<br />
““<br />
— these communities need to be made aware<br />
of the potential hazards that surround us and<br />
them. As part of these assumed duties, I have<br />
also helped in translating two fact sheets<br />
concerning earthquakes and tsunamis.<br />
In 2001, I was asked to be part of the Tsunami<br />
Response Team that was invited to Peru in<br />
response to a series of tsunamis that occurred<br />
along the coast of Camana, Peru, as a result of<br />
a magnitude-8.4 earthquake off the coast of<br />
southern Peru. The study focused on tsunami<br />
deposits on the beaches between Ocoña and<br />
Mejia, Peru. I am currently working on mapping<br />
the rift valley of the San Andreas Fault, Tomales<br />
Bay. I am also mapping the continental shelf<br />
along the central California coast.<br />
felt the earthquake. [See page 33.]<br />
• ShakeMap – A rapidly generated<br />
computer map that shows the location,<br />
severity and extent of strong ground shaking<br />
within minutes after an earthquake.<br />
Fast information on strong shaking in urban<br />
areas helps get emergency response<br />
to the right places.<br />
• Hazard Maps – Hazard maps identify<br />
the areas of the country that are mostly<br />
likely to experience strong shaking in the<br />
future. ZIP code or latitude-longitude<br />
lookup is available. [See pages 26, 30, 31.]<br />
• Earthquake Notification – Automated<br />
notifications of earthquakes are available<br />
through e-mail, pager or cell phone.<br />
This provides rapid information and updates<br />
to first responders and resources for<br />
media and local government.<br />
• Earthquake Catalog and Data –<br />
Users can search an online catalog and<br />
download information and technical<br />
data.<br />
• Real-time Waveforms – Real-time<br />
waveform displays from 60 stations, showing<br />
the movement of seismic waves, are<br />
available online 24 hours a day.<br />
• Regional Earthquake Info – Information<br />
about earthquake hazards, historical<br />
seismicity, faults and more is available<br />
for different regions of the country and<br />
by state.<br />
• Movies of Structures Shaking<br />
– These are Quicktime movies created<br />
from the recordings of fully instrumented<br />
structures during earthquakes.<br />
“<strong>USGS</strong> and ANSS support allows for<br />
much better monitoring than we would<br />
otherwise have,” Withers said. “By making<br />
use of ANSS tools, we are able to provide<br />
rapid notification, recent earthquakes,<br />
ShakeMap, real-time data exchange,<br />
technical expertise exchange, etc.”<br />
Rapid and reliable information on the<br />
location, magnitude and effects of an<br />
earthquake is needed to guide emergency<br />
response, save lives, reduce economic<br />
losses and speed recovery. ANSS can offer<br />
these benefits if resources and efforts<br />
are continuously devoted to it.<br />
“These things play out over decades to<br />
hundreds to thousands of years, so implementations<br />
and improvements have to<br />
be done year in and year out,” Ebel said.<br />
“ANSS is a down-payment investment on<br />
future earthquake monitoring.”<br />
Ken Rukstales<br />
Title: IT Specialist<br />
Location: Golden, Colo.<br />
Length of service with the <strong>USGS</strong>: 21 years<br />
Along with Art Frankel and E.V. Leyendecker, we<br />
have produced seismic building-design maps that<br />
are the basis for the seismic design provisions of the<br />
International Building Code and the International Residential<br />
Code. These maps are the most significant<br />
product to ensure that buildings, bridges and other<br />
structures are designed to withstand expected levels<br />
of ground shaking caused by earthquakes. Properly<br />
designed, earthquake-resistant structures greatly reduce<br />
the loss of life and property from earthquakes.<br />
April 2006 ★ PEOPLE, LAND & WATER 23
Taking it all in Slide —<br />
How the Trans-Alaska Pipeline Survived a Big One<br />
Compiled by Heather Friesen<br />
The Nov. 3, 2002, magnitude-7.9<br />
central Alaska earthquake<br />
was one of the largest<br />
recorded earthquakes<br />
in our nation’s history. The<br />
epicenter of the temblor was located near<br />
Denali National Park, approximately 75 miles<br />
south of Fairbanks and 176 miles north of<br />
Anchorage. It caused countless landslides and<br />
road closures, but minimal structural damage,<br />
and amazingly, few injuries and no deaths.<br />
In contrast, the 1906 magnitude-7.9 earthquake<br />
and subsequent fires took 3,000 lives<br />
and caused $524 million in property losses.<br />
The remote location of the magnitude-7.9<br />
Denali Fault earthquake played a role in ensuring<br />
that the earthquake was not more devastating.<br />
However, advanced seismic monitoring,<br />
long-term research and a commitment to hazard<br />
preparedness and mitigation also played a key role. The<br />
science done before the Denali Fault earthquake aided in<br />
the successful performance of the Alaska pipeline, and the<br />
science done after the Denali Fault earthquake revealed<br />
more about large quakes that will help save lives and property<br />
during future temblors, especially in populated areas.<br />
<strong>USGS</strong> seismologists and geologists serving on a federal<br />
task force were instrumental to ensuring that the Trans-<br />
Alaska Pipeline was designed and built to withstand the<br />
effects of a magnitude-8.0 earthquake with up to 20 feet<br />
of movement at the pipeline. The <strong>USGS</strong> design guidance<br />
proved to be on target. In 2002, the Denali Fault ruptured<br />
beneath the pipeline, resulting in an 18-foot horizontal<br />
offset. The resilience of the pipeline is a testament<br />
to the importance of science in hazard mitigation and<br />
decision making.<br />
More than 30 years ago, Trans-Alaska Pipeline System<br />
(TAPS), formed by seven oil companies, confirmed the<br />
existence of a great deal of oil on the North Slope. In<br />
February 1969, TAPS announced plans to build a 4-foot diameter,<br />
800-mile pipeline to carry crude oil from Prudhoe<br />
Bay to Valdez. Issues pertaining to the safety of the design<br />
emerged. Would the heat in the oil melt the pervasive,<br />
thick, permafrost layer and cause damaging spills? Would<br />
the pipeline be able to withstand a large earthquake in the<br />
nation’s most seismically active state?<br />
24 PEOPLE, LAND & WATER ★ April 2006<br />
Designed to withstand a magnitude-8 earthquake with up to 20 feet of movement, the Trans-<br />
Alaska Pipeline is supported by rails on which it can slide freely during an earthquake.<br />
Walter Hickel, then U.S. Secretary of the Interior<br />
(1969-70), was alerted about the proposed pipeline and<br />
immediately appointed Bill Pecora, then <strong>USGS</strong> director<br />
(1965-71), to chair a technical advisory board. Pecora appointed<br />
the Menlo Park working group, made up mostly<br />
of <strong>USGS</strong> scientists, to advise the board.<br />
<strong>USGS</strong> created several scientific documents to be used<br />
in planning the pipeline location and construction. Documents<br />
included an estimate of potential earthquake<br />
shaking levels and a report on thermal effects of a heated<br />
pipeline in permafrost that described how the pipe would<br />
float, twist and break.<br />
In 1971, Pecora brought the Menlo Park group to<br />
Washington and thanked them for telling the oil companies<br />
“what they can’t do,” but now he wanted them to tell<br />
the companies “what they can do.” Pecora locked the door<br />
of the conference room and told the group that he would<br />
not let them out until they had finished the analysis of<br />
the question “To bury or not to bury?” So the group put<br />
together the necessary stipulations on the pipeline construction.<br />
Among other things, the stipulations required<br />
that the pipeline system be designed to prevent oil leakage<br />
from the effects of a magnitude-8.0 earthquake on the<br />
Denali Fault.<br />
In April 1974, construction of a 400-mile, all-weather<br />
road from the Yukon River to Prudhoe Bay was started.<br />
Pipeline and storage tank construction at<br />
Valdez began in 1975. Large segments of the<br />
Trans-Alaska Pipeline were elevated above<br />
ground to keep the permafrost from melting,<br />
and about half of the 800-mile pipeline was<br />
buried. A special fault design was adopted for<br />
crossing the Denali Fault Zone. Here the pipeline<br />
is supported by rails on which it can slide<br />
freely in the event of fault offset. In mid-1977,<br />
the first tanker shipped Alaska north slope oil<br />
from Valdez.<br />
More than 14 billion barrels (nearly 550 billion<br />
gallons) have moved through the pipeline<br />
since startup in 1977. After the 2002 quake,<br />
the pipeline continued to carry 1 million barrels<br />
of oil each day, though it was temporarily<br />
shut down for inspection. With the pipeline<br />
intact, an important source of revenue for the<br />
state of Alaska was preserved. Moreover, as<br />
Alaskans know all too well, the consequences<br />
to the environment, should the pipeline have<br />
failed, would have been catastrophic.<br />
“Good science made the difference between an emergency<br />
and a tragedy,” said P. Patrick Leahy, <strong>USGS</strong>. “It’s<br />
an example of how partnerships between the <strong>USGS</strong>,<br />
the Federal Emergency Management Agency, universities,<br />
state and local officials, and business leaders and<br />
the community enable us to apply our scientific knowledge.<br />
We know we can’t stop the Earth from changing,<br />
but we can work together making public safety our<br />
primary goal.”<br />
The 2002 Denali earthquake is the largest seismic event<br />
ever recorded on the Denali Fault system — one of the<br />
longest continental faults in the world. The earthquake<br />
was similar to the magnitude-7.9 1906 earthquake, which<br />
ruptured the San Andreas Fault in Northern California.<br />
Both fault systems exhibit strike-slip movement, where<br />
blocks of continental crust slip horizontally past each<br />
other.<br />
“Studying the 2002 Denali Fault earthquake is an opportunity<br />
to understand the consequences of a very large<br />
earthquake to better prepare for the time when one will<br />
occur in a much more densely populated area,” said<br />
<strong>USGS</strong> scientist Peter Haeussler.<br />
The Denali Fault earthquake was very directional.<br />
It ruptured rapidly over a long distance, focusing the<br />
earthquake energy in the direction of the earthquake<br />
<strong>USGS</strong> Earthquake Scientists — A Nationwide Notion of Pride<br />
David Oppenheimer<br />
Title: Seismologist; Project Chief of the<br />
Northern California Seismic Network<br />
Location: Menlo Park, Calif.<br />
Length of service with the <strong>USGS</strong>: 28 years<br />
The first memorable moment is scientific: In<br />
the mid-1980s, my colleague Paul Reasenberg<br />
and I developed software to compute<br />
the focal mechanism of an earthquake from<br />
first-motion polarities from seismograms. A<br />
focal mechanism indicates to seismologists<br />
the orientation and sense of relative motion of<br />
the fault on which the earthquake occurred.<br />
The ability to compute what was formerly done<br />
laboriously by hand opened up a new vista into<br />
the earthquake process.<br />
When Paul, Bob Simpson and I began to look at<br />
the suite of focal mechanisms of aftershocks<br />
from the magnitude-6.2 Morgan Hill, Calif.,<br />
earthquake in 1984, we were initially confounded.<br />
We discovered that the mechanisms<br />
for earthquakes adjacent to the Calaveras Fault<br />
were reflecting a state of stress in which the<br />
orientation of the maximum compressive stress<br />
was nearly perpendicular to the fault instead of<br />
being oriented approximately 30 degrees to the<br />
fault as predicted by classical mechanics.<br />
This finding, together with borehole stress<br />
measurements, heat-flow measurements and<br />
geological observations, provided compelling<br />
evidence that the frictional strength of the<br />
Calaveras Fault was much lower than had been<br />
commonly thought. It was both exciting and<br />
gratifying to be making a new and fundamental<br />
observation that altered our understanding of<br />
fault mechanics and the process of how earthquakes<br />
are generated.<br />
The second is operational: As the project chief of<br />
the <strong>USGS</strong> Northern California Seismic Network<br />
(NCSN), it has been my privilege to manage<br />
a complex project staffed by very creative<br />
and hard-working individuals who deploy and<br />
maintain seismic instrumentation and telecommunications,<br />
and who develop sophisticated,<br />
real-time data processing systems.<br />
Perhaps the proudest moment was the occurrence<br />
of the September 28, 2004, magnitude-6<br />
Parkfield earthquake. The Parkfield earthquake<br />
culminated in an effort that began more than<br />
30 years earlier to instrument a section of the<br />
San Andreas Fault that repeatedly ruptures in<br />
similarly sized earthquakes every few decades.<br />
In an instant, the earthquake tested all phases<br />
of the NCSN and University of California-Berkeley<br />
monitoring system.<br />
Not only did we successfully capture a rare<br />
data set for study by the seismological research<br />
community, but the results were automatically<br />
available on the Web. Within minutes after<br />
the earthquake, we were reliably and rapidly<br />
delivering earthquake information on the Web<br />
at a rate of 10,000 hits/sec. It was both exciting<br />
and gratifying to see that all of our instrumentation,<br />
telemetry and processing systems worked<br />
as designed.
upture. As a result, said Haeussler, distant<br />
earthquake effects were most pronounced<br />
in one direction — southeast<br />
of the fault trace toward western Canada<br />
and the lower 48 states. Consequently, the<br />
Denali Fault earthquake was felt as far<br />
away as Louisiana. In the New Orleans<br />
area — more than 3,000 miles away —<br />
residents saw water in Lake Pontchartrain<br />
slosh about as a result of the earthquake’s<br />
power. The earthquake also disturbed<br />
levels of water in Pennsylvania wells by up<br />
to two feet, damaged houseboats in Seattle<br />
from seismic sea waves, and triggered small<br />
earthquakes at many volcanic or geothermal<br />
areas in the direction of rupture. The<br />
most pronounced triggering was observed<br />
at Yellowstone, Wyo., with 130 small earthquakes<br />
recorded in the four hours following<br />
the 1,940-mile-away Alaskan rupture.<br />
By contrast, in the other direction, only<br />
one of the many active Alaskan volcanoes<br />
had triggered earthquakes.<br />
“Research like this conducted by the<br />
<strong>USGS</strong> and collaborating institutions<br />
helps to anticipate the effects of future<br />
large earthquakes, such as the kind that<br />
will occur on the San Andreas Fault in<br />
the Los Angeles area,” explained Lucy<br />
Jones, <strong>USGS</strong> scientist-in-charge for Southern<br />
California. “The effect of directivity<br />
may be important in hazard planning for<br />
future large Southern California earth-<br />
quakes.” The last time the San Andreas<br />
Fault ruptured in Southern California, in<br />
a magnitude-7.9 earthquake in 1857, the<br />
earthquake began in central California<br />
and ruptured southeastward toward the<br />
now highly urbanized Los Angeles region.<br />
Thanks to George Gryc, Robert Page and<br />
Peter Haeussler.<br />
Measuring Magnitude — What Do the Numbers Mean?<br />
Compiled by Diane Noserale<br />
Often two or more different magnitudes<br />
are reported for the same earthquake.<br />
Sometimes, years after an earthquake<br />
occurs, the magnitude is adjusted.<br />
Although this can cause some confusion<br />
in news reports, for the public and among scientists,<br />
there are good reasons for these adjustments.<br />
Preliminary Magnitude<br />
Following an earthquake, the first magnitudes that<br />
seismologists report are usually based on a subset of<br />
seismic-monitoring stations, especially in the case of<br />
a larger earthquake. This is done so that some information<br />
can be obtained immediately without waiting<br />
for all the data to be processed. As a result, the first<br />
magnitude reported is usually based on a small number<br />
of recordings. As additional data are processed and<br />
become available, the magnitude and location are refined<br />
and updated. Sometimes the assigned magnitude<br />
is “upgraded” or slightly increased, and sometimes it is<br />
“downgraded” or slightly decreased. It can take months<br />
before a magnitude is no longer “preliminary.”<br />
Sometimes the earthquake magnitude is reported<br />
by different networks of seismometers based on only<br />
their recordings. In that case, the different assigned<br />
magnitudes are a result of the slight differences in the<br />
instruments and their locations with respect to the<br />
earthquake epicenter. Depending on the specifics of<br />
the event, scientists might determine that the network<br />
closest to the event reports it most accurately. This is<br />
especially true where the instrumentation is denser.<br />
Other times, national networks, in which the instruments<br />
are often more state-of-the-art, produce the<br />
most reliable results.<br />
Different Methods of Calculating Magnitude<br />
The concept of using magnitude to describe earthquake<br />
size was first applied by Charles Richter in 1935.<br />
The magnitude scale is logarithmic so that a recording<br />
of 7.1, for example, indicates a disturbance with ground<br />
motion 10 times larger than a recording of 6.1. However,<br />
the difference in energy released is even bigger.<br />
In fact, an earthquake of magnitude 7.1 releases about<br />
33 times the energy of a magnitude 6.1 or about 1,000<br />
times the energy of a magnitude-5.1. Another way of<br />
thinking of this is that it takes about 1,000 magnitude-<br />
5.4 earthquakes to equal the energy released by just<br />
one magnitude-7.4 event. A earthquake of magnitude<br />
2 is normally the smallest felt by people. Earthquakes<br />
with a magnitude of 7.0 or greater are commonly considered<br />
major; great earthquakes have a magnitude of<br />
8.0 or greater.<br />
Through the years, scientists have used a number of<br />
different magnitude scales, which are a mathematical<br />
formula, not a physical scale. Although news reports<br />
often call all magnitudes “Richter,” scientists today<br />
rarely use Richter’s original method. Unless further<br />
detail is warranted, <strong>USGS</strong> simply uses the terms magnitude<br />
or preliminary magnitude, noted with the symbol<br />
“M,” in its news releases.<br />
The Most Common Magnitude Scales in<br />
the United States<br />
When earthquakes occur, energy is radiated from<br />
the origin in the form of different types of waves.<br />
Moment magnitude (M W ) is usually the most accurate<br />
measure of an earthquake’s strength, particularly for<br />
larger earthquakes. Moment magnitude accounts for<br />
the full spectrum of energy radiated by the rupture<br />
and is generally computed for earthquakes of at least<br />
magnitude 5.5 when the additional data needed for<br />
this computation are available and the effort is warranted.<br />
Using some sophisticated regional networks<br />
in which noise is limited, seismologists can compute<br />
moment magnitudes for earthquakes down to less than<br />
magnitude 3.5.<br />
Surface-wave magnitude (M S ) is computed only for<br />
shallow earthquakes, those with a depth of less than<br />
30 miles. Body-wave magnitude (m b ) is computed for<br />
both shallow and deeper earthquakes, but with restrictions<br />
on the period of the wave. And local “Richter”<br />
magnitudes (ML) are computed for earthquakes recorded<br />
on a short-period seismometer local to (within<br />
370 miles of) the focus of the earthquake.<br />
Seismologists may measure an earthquake’s magnitude<br />
with one scale. Then, once more data are<br />
available, reassign the magnitude using another scale<br />
deemed more accurate based on the additional data.<br />
For example, for the 1999 earthquake near Ismit,<br />
Turkey, the 7.8 magnitude first cited was a (M S ) surface-wave<br />
magnitude. The later figure of 7.4 is a (M W )<br />
moment magnitude. Magnitudes assigned to a specific<br />
event for years can sometimes change.<br />
Compiled with assistance from Steve Vandas.<br />
<strong>USGS</strong> Earthquake Scientists — A Nationwide Notion of Pride<br />
Brian Sherrod<br />
Title: Research Geologist<br />
Location: Seattle<br />
Length of service with the <strong>USGS</strong>:<br />
11 years<br />
One of my most memorable times as a<br />
<strong>USGS</strong> scientist is when I found evidence<br />
of surface rupture along the Seattle<br />
Fault near Bellevue, Wash. I was looking<br />
for evidence of the Seattle Fault east of<br />
Seattle — using old aerial photographs<br />
taken from biplanes in the 1930s, more<br />
recent laser mapping data, geologic<br />
maps and lots of field work. I had a<br />
good idea where I thought a strand of<br />
the fault zone traversed the area I was<br />
working in, so I obtained permission to<br />
do some detailed work on an undeveloped<br />
parcel of land near the shoreline of<br />
Lake Sammamish.<br />
After many hand-excavated test pits and<br />
soil auger holes, I thought I had found<br />
a trace of the fault that put weathered<br />
Miocene bedrock against young glacial<br />
deposits. The time had finally come to<br />
really test my ideas with a large excavation<br />
across what I thought was a fault.<br />
I remember being nervous when the<br />
backhoe arrived and we finally began<br />
excavating. Within a short time, though,<br />
we uncovered a thrust fault that placed<br />
weathered bedrock and old glacial<br />
deposits over a recent forest soil. The<br />
fault and buried soil were within a few<br />
meters of where I originally thought the<br />
fault was.<br />
Want to know what was most satisfying<br />
about this discovery? I had many<br />
modern tools at my disposal, including<br />
LiDAR (laser) maps, geospatial information<br />
systems and a host of detailed<br />
geophysical studies, but it was getting<br />
down on my hands and knees in the dirt<br />
(oops, soil...) and doing the field geology<br />
that really made this study succeed.<br />
Joan Gomberg<br />
Title: Research Seismologist<br />
Location: Memphis, Tenn.<br />
Length of service with the<br />
<strong>USGS</strong>: 18 years<br />
The most exciting thing for<br />
me was discovering the<br />
strong correlation between<br />
distant aftershocks and<br />
focusing of seismic waves<br />
(implying triggering by the<br />
waves) — a Eureka moment!<br />
Visiting Bhuj, India, was also<br />
memorable.<br />
April 2006 ★ PEOPLE, LAND & WATER 25
By Tania Larson<br />
On October 17, 1989,<br />
occupants of the<br />
Transamerica Pyramid<br />
in San Francisco were<br />
unnerved as the building<br />
started to shake. Sixty miles away, in the<br />
forest of Nisene Marks State Park in the<br />
Santa Cruz Mountains, the Loma Prieta<br />
earthquake had struck with a magnitude<br />
of 6.9. The seismic waves were channelled<br />
— focused by the geological features<br />
of the area — toward San Francisco.<br />
<strong>USGS</strong> instruments installed in the building<br />
showed that it shook for more than<br />
a minute and that the top floor swayed<br />
more than a foot from side to side.<br />
The earthquake caused more than<br />
$6 billion in damages and took 63 lives.<br />
Yet no lives were lost in the Transamerica<br />
Pyramid. Despite the intensity of the shaking,<br />
the 49-story building came through<br />
undamaged. Having been aware of the<br />
area’s potential for even larger earthquakes,<br />
engineers had designed the Transamerica<br />
Pyramid to withstand greater stresses than<br />
those from the Loma Prieta earthquake.<br />
The biggest danger during an earthquake<br />
is often the failure of man-made<br />
structures. Not only are lives lost to falling<br />
buildings, collapsed bridges and<br />
crumbling facades, but disruption of<br />
infrastructure and utilities can cause additional<br />
hazards and actually keep emergency<br />
crews from life-saving resources.<br />
Earth scientists have been working for<br />
more than 100 years to improve our understanding<br />
of earthquake hazards. One<br />
of their most important goals is to provide<br />
designers, lawmakers and residents with<br />
the information they need to build structures<br />
that are better able to withstand the<br />
forces of the earthquakes they are likely<br />
to face.<br />
Building Codes Help Protect<br />
Earthquake-Prone Communities<br />
“The most common cause of damage<br />
to a structure (a building or bridge)<br />
during an earthquake is strong ground<br />
shaking,” says E.V. Leyendecker, <strong>USGS</strong><br />
scientist emeritus. “The first line of<br />
defense against such shaking is the de-<br />
<strong>USGS</strong> Earthquake Scientists — A Nationwide Notion of Pride<br />
Heidi Stenner<br />
Title: Geologist<br />
Location: Menlo Park, Calif.<br />
Length of service with the <strong>USGS</strong>:<br />
7 years<br />
In 1999, a large, magnitude-7.4<br />
earthquake rocked northwestern<br />
Turkey. The fault that ruptured<br />
is similar in a lot of ways to the<br />
San Andreas Fault in California,<br />
so it was important to learn all<br />
we could about the quake and its<br />
effects. As part of a small team,<br />
I helped map where and how<br />
the fault ruptured the ground. In<br />
26 PEOPLE, LAND & WATER ★ April 2006<br />
Building Safer:<br />
How Decades of Earth Science is Helping<br />
to Reduce the Biggest Earthquake<br />
Vulnerability — Man-Made Structures<br />
sign and construction of structures to<br />
resist it.”<br />
And as <strong>USGS</strong> scientist David Perkins<br />
points out, “Earthquake building codes<br />
are the primary means to prevent or limit<br />
damage to structures.”<br />
Building codes help protect us by<br />
requiring that new construction meet certain<br />
safety requirements. In many earthquake-prone<br />
areas, these codes specify the<br />
levels of earthquake forces that structures<br />
must be designed to withstand.<br />
“To ensure that the code is adequate<br />
without being excessively expensive to<br />
implement, engineers have to know the<br />
likelihood that certain levels of ground<br />
shaking will be experienced during the<br />
lifetime of the structure,” says Perkins.<br />
But how do they know what conditions<br />
a building is likely to face? <strong>USGS</strong> has de-<br />
doing so, we saw multi-story apartment<br />
buildings reduced to a single<br />
story of rubble, people living in tents<br />
outside their homes in the rain and<br />
bridges and overpasses rendered<br />
useless. And we heard a lot of sad<br />
stories.<br />
Seeing firsthand the effects of an<br />
earthquake really motivated me<br />
to do what I can to keep that from<br />
happening again. Understanding the<br />
science behind earthquakes is one<br />
aspect needed to better prepare and<br />
reduce the risk to people from such<br />
events. It is my time in Turkey that<br />
reminds me most why we need to<br />
keep advancing earthquake science.<br />
Unreinforced masonry<br />
buildings are<br />
especially vulnerable<br />
during strong earthquake<br />
shaking. Shaking-hazard<br />
maps are<br />
used to determine<br />
areas where these<br />
types of buildings<br />
need to be reinforced<br />
to make them safe<br />
during earthquakes.<br />
Photo: J. Dewey<br />
veloped a number of products to show not<br />
only how probable it is that a structure<br />
will face small, moderate and large earthquakes,<br />
but also how much shaking buildings<br />
are likely to experience and how they<br />
tend to respond to these varying levels<br />
of shaking.<br />
Hazard Maps to Reveal<br />
Nationwide Seismic Threats<br />
Since 1948, scientists have been making<br />
national earthquake-shaking maps<br />
that show the variations in the seismic<br />
threat from one area to the next. These<br />
maps demonstrate the potential shaking<br />
hazard from future earthquakes across the<br />
country, and they are frequently updated<br />
as scientists learn more about earthquakes<br />
and the hazards they pose.<br />
Thomas Noce<br />
Title: Geologist<br />
Location: Menlo Park, Calif.<br />
Length of service with the <strong>USGS</strong>: 20 years<br />
I’m most proud to have been working to<br />
help quantify the hazards in the greater San<br />
Francisco Bay Area, particularly in the areas<br />
of man-made land that didn’t exist in the<br />
1906 earthquake. These areas are potentially<br />
the most vulnerable in a repeat scenario<br />
of the 1906 event, and the Loma Prieta<br />
earthquake of 1989 provided but a glimpse<br />
of their shortcomings. We have learned a<br />
great deal about liquefaction and hazard<br />
analysis since then, and we have developed<br />
Looking to the Past to<br />
“Construct” Models of the Future<br />
Coming up with these estimations can<br />
be very complicated. Basically, researchers<br />
do everything they can to learn about<br />
past events: where earthquakes have occurred,<br />
how frequently and at what size;<br />
how the vibrations have traveled through<br />
the ground; how those vibrations were affected<br />
by soil and bedrock; and how all of<br />
this affected both the land and the structures<br />
we have built. Researchers then<br />
combine this information to build models<br />
of future earthquakes.<br />
As earth scientists look at historical<br />
earthquakes, they are particularly interested<br />
in the levels of shaking the earthquakes<br />
have caused. “Earth scientists can<br />
determine past shaking levels by studying<br />
the effects of past earthquakes on people,<br />
structures and the landscape,” says<br />
Perkins. “For more recent earthquakes,<br />
instrumentation on the ground and in<br />
buildings gives a more direct measure of<br />
the shaking experienced.”<br />
Scientists have been putting instruments<br />
in buildings since the 1940s. From<br />
this data, scientists and engineers can<br />
directly estimate how earthquake shaking<br />
will affect similar buildings in the<br />
future. When the information is less direct,<br />
researchers use computer models<br />
of buildings to indirectly generate the<br />
estimated effects.<br />
Digging Deeper<br />
What they don’t learn with instrumentation<br />
above the ground, researchers<br />
can sometimes learn from clues beneath<br />
the ground surface. The layers of<br />
the earth typically lie flat, but when an<br />
earthquake rumbles through these layers,<br />
they are disrupted, leaving breaks and<br />
folds and other clues scientists can use to<br />
learn more about an area’s susceptibility<br />
to earthquakes.<br />
“Historical seismicity alone does not<br />
tell us all we need to know about future<br />
earthquake locations and magnitudes,”<br />
says Perkins. “Accordingly, earth scientists<br />
look for faults and signs of earthquake<br />
liquefaction or earthquake-induced<br />
landslides in the geological past in order<br />
to estimate the sizes and dates of these<br />
methodologies to identify and quantify the<br />
liquefaction hazards that will serve us not only<br />
here in the Bay Area, but across the country in<br />
all seismically-at-risk regions.<br />
Although much work remains to be done in<br />
the Bay Area to complete the hazard mapping,<br />
what we have begun and hope to finish will<br />
serve as an example of how hazard mapping<br />
should be done in the future in historically<br />
active liquefaction zones across the United<br />
States, such as the New Madrid seismic<br />
region, Charleston, S.C., the Pacific Northwest<br />
and Alaska.<br />
It has been equally exciting to work with the<br />
best of the best in their fields, with people who<br />
care about their work and their contributions<br />
to make the world a safer place.
events. This allows them to extend the<br />
‘history’ of large events back as much as<br />
10,000 years or more. From this longer<br />
history, earth scientists can also determine<br />
the rate at which earthquakes of all<br />
sizes occur.”<br />
However, as Leyendecker points out,<br />
this does not tell the entire story. Designing<br />
a building requires knowledge not<br />
only of the earthquakes it will likely face,<br />
but also how those earthquakes will affect<br />
the building — the loads it will have<br />
to bear and how and to what capacity it<br />
will respond to those forces. “Research<br />
conducted since the 1906 San Francisco<br />
earthquake, particularly over the last 20 to<br />
30 years under the National Earthquake<br />
Hazards Reduction Program, has contributed<br />
to these three areas of loads, response<br />
and capacity,” says Leyendecker.<br />
Science Advancements Help<br />
Refine and Improve Building Codes<br />
Thanks to increased earth science<br />
focus, building codes have seen regular<br />
major changes since the 1960s, and according<br />
to Perkins, these advancements<br />
have paid off.<br />
“Structures built using recent building<br />
codes have withstood remarkably large<br />
levels of ground motion in the earthquakes<br />
that have been experienced since<br />
the 1990s,” says Perkins.<br />
For example, in 1971, the magnitude-<br />
6.6 San Fernando earthquake left the Los<br />
Angeles dam badly damaged. This dam,<br />
so weakened that a strong aftershock could<br />
have caused a collapse, was all that stood<br />
between 80,000 people and 15 million<br />
tons of water. Residents in an 11-squaremile<br />
area were forced to evacuate their<br />
homes while the water behind the dam<br />
was lowered. With years of ground motion<br />
studies and advancements in earthquake<br />
studies to turn to, engineers built<br />
a new, safer dam. This new structure was<br />
tested in 1994 when the magnitude-6.7<br />
Northridge earthquake hit the area. The<br />
new dam held, with very little damage.<br />
“In 1996, a major revision of the groundshaking-hazard<br />
maps, developed in collaboration<br />
with the earth-science community<br />
and design engineers, resulted<br />
in major improvement of building codes<br />
<strong>USGS</strong> Earthquake Scientists — A Nationwide Notion of Pride<br />
Hal Macbeth<br />
Title: Supervisor of seismic analysis for the<br />
Northern California Seismic Network<br />
Location: Menlo Park, Calif.<br />
and design standards,” says Leyendecker.<br />
The revisions incorporated new descriptions<br />
of the hazard, such as the specific<br />
soil and rock conditions and how buildings<br />
experience vibrations in response to<br />
the vibrations of the ground.<br />
“This new way of describing the hazard<br />
enables structural engineers to better predict<br />
structural response to ground shaking<br />
for design purposes. Knowledge of the site<br />
condition of the maps also enables engineers<br />
to adjust the design to incorporate<br />
the actual site condition. In the end, these<br />
improvements result in better protection<br />
of lives and property,” says Leyendecker.<br />
By taking all of this information into<br />
account, scientists have created a powerful<br />
data set. “With all these forms of<br />
earth science information,” says Perkins,<br />
“researchers can compute the likelihood<br />
of future earthquake ground shaking<br />
at all locations in the U.S. It is maps of<br />
these probabilistic ground motions that<br />
are used to determine building code<br />
requirements.”<br />
More than 20,000 cities, counties and<br />
local government agencies use building<br />
codes based on these maps, but shakinghazard<br />
maps have many other applications.<br />
They are also used by insurance<br />
companies to set rates for properties in<br />
different areas, civil engineers to estimate<br />
the stability of hillsides, the Environmental<br />
Protection Agency to set construction<br />
standards for waste-disposal facilities, and<br />
the Federal Emergency Management<br />
Agency to allocate funds for earthquake<br />
education and preparedness.<br />
To make sure users understand and get<br />
the best value out of the maps, the <strong>USGS</strong><br />
offers workshops to familiarize users with<br />
the shaking-hazard maps and earthquake<br />
issues.<br />
While both the Loma Prieta and<br />
Northridge earthquakes demonstrated<br />
that we can build safer structures that do<br />
withstand earthquakes, there were still<br />
considerable losses that revealed just how<br />
vulnerable major metropolitan areas can<br />
be when hit by an earthquake. Awareness<br />
of this vulnerability was reinforced by<br />
the 1995 Kobe, Japan, earthquake. With<br />
magnitudes of 6.7 and 6.9, respectively,<br />
both the Northridge and the Kobe events<br />
are considered moderate earthquakes, yet<br />
Length of service with the <strong>USGS</strong>: 26 years<br />
Public Education: The Earthquake Hazards<br />
Team has put a superior effort into providing<br />
Web-based information to the public not only<br />
about where recent or historical earthquakes<br />
have occurred, but also about how the public<br />
can use that information to protect themselves<br />
and others from earthquake hazards<br />
in the future. This effort has brought public<br />
awareness and access to disaster crisis information<br />
to a level where, in the end result,<br />
we hope some lives might be saved.<br />
Through the efforts of public outreach, I have<br />
personally fielded calls and e-mails daily<br />
on questions about earthquakes, volcanoes,<br />
landslides and other hazard/earth science<br />
information. Many of these calls are from<br />
our nation’s youth, who are eager to educate<br />
themselves and potentially will be our<br />
nation’s next generation of scientists. That’s<br />
much to be proud of.<br />
Emergency Hazards Response: I have seen<br />
Houses without adequate connections to foundations can easily shift during even moderate<br />
earthquake shaking, causing extensive damage. Pipes and wires may be broken by a slight<br />
cripple-wall shift, resulting in fires, water damage or other problems. Much damage of this type<br />
can be avoided by using inexpensive bracing techniques, such as those recommended in the<br />
seismic design provisions of building codes.<br />
even in these areas known for their earthquake<br />
preparedness, the losses suffered by<br />
the densely populated urban areas were<br />
catastrophic.<br />
High-Resolution Maps to Help<br />
High-Risk Urban Areas<br />
To address this vulnerability, engineers,<br />
officials and emergency-response teams<br />
needed better, more detailed information.<br />
In 1998, the <strong>USGS</strong> began highresolution<br />
earthquake hazard mapping<br />
in three high-risk urban areas: the eastern<br />
San Francisco Bay region, Seattle and<br />
Memphis. Since then, projects in St.<br />
Louis, Mo., and Evansville, Ind., have<br />
also been started.<br />
These projects will provide city officials<br />
with hazard maps that are more detailed<br />
and take local and regional geology into<br />
account. As the Loma Prieta earthquake<br />
demonstrated, geology can play a big role<br />
in how a city is impacted by an earthquake.<br />
The assessments are also addressing<br />
potential ground failure hazards, such<br />
as liquefaction and earthquake-triggered<br />
landslides.<br />
This research is being used to create<br />
urban hazard maps, scenario earthquake<br />
maps and long-term forecasts of earthquake<br />
probabilities. These products will<br />
provide better details for updating building<br />
codes, reducing risks and planning for<br />
recovery in high-risk metropolitan areas.<br />
this as a continually evolving effort to better<br />
improve the access of real-time earthquake<br />
information for federal, state and local<br />
disaster-response teams. I serve as one of<br />
five <strong>USGS</strong> duty seismologists who are on call<br />
24/7 for emergency response to earthquakes<br />
occurring in Northern California. ShakeMaps<br />
(one of our map products showing calculated<br />
ground-shaking intensities) are produced<br />
minutes after a moderate-to-large earthquake<br />
strikes, alerting rescue/repair crews to<br />
focus on the most damaged areas first.<br />
Efforts are also being made to establish an<br />
early warning system for ground shaking<br />
Looking Long Term<br />
The hazard maps that influence today’s<br />
building codes incorporate more than a<br />
century of seismic monitoring and decades<br />
of research. In their quest to find ways to<br />
protect people from the effects of earthquakes,<br />
<strong>USGS</strong> researchers have come<br />
up with many creative ways to expand<br />
their understanding of the hazards. They<br />
have traveled the globe, comparing notes<br />
and historical records with researchers<br />
around the world. They have dug through<br />
mud and sand and clay. They have bored<br />
through layers of rock. They have even<br />
learned about earthquakes by examining<br />
long-drowned forests and other side effects<br />
earthquakes have had on the landscape.<br />
By taking all of these efforts and turning<br />
them into products communities can use<br />
to protect themselves, <strong>USGS</strong> researchers<br />
have helped save many lives and millions<br />
of dollars. But they know their work is not<br />
done. In the next 100 years, they will continue<br />
to look for new ways to refine and enhance<br />
the maps and models that influence<br />
building codes, making all of our structures<br />
— from our homes, to our hospitals, to the<br />
infrastructures that support our resources<br />
— better able to withstand the earthquakes<br />
they will inevitably face.<br />
Thanks to E.V. Leyendecker, Nicolas<br />
Luco, David Perkins and Robert Wesson<br />
for their help and expertise.<br />
in a large earthquake, potentially giving a<br />
few seconds warning ... more potential lives<br />
saved.<br />
I don’t think I could be any more proud than<br />
being a team member of an organization<br />
whose ultimate purpose is to protect lives<br />
and property not only here in the United<br />
States, but also helping to identify and possibly<br />
mitigate hazards in a global crisis, such<br />
as tsunamis and other earthquakes occurring<br />
around the world.<br />
April 2006 ★ PEOPLE, LAND & WATER 27
Working for a Safer Southern California<br />
A Profile of Lucy Jones<br />
An Interview<br />
with Lucy Jones<br />
By Diane Noserale<br />
What is your nightmare earthquake<br />
scenario?<br />
Any magnitude-7 in the Los Angeles basin,<br />
and we have many faults — Santa Monica,<br />
Hollywood, Puente Hills, Palos Verdes, Sierra<br />
Madre — that are capable of producing an earthquake<br />
of that size. During a Santa Ana wind<br />
condition when fires cannot be controlled is the<br />
scenario for a true nightmare. “Multi-hazard” is<br />
not just popular jargon.<br />
What was your most interesting<br />
experience while working in the field?<br />
I generally don’t do fieldwork. I use the permanent<br />
seismic network. But to bribe me to go to<br />
graduate school at MIT, Professor Peter Molnar<br />
(my eventual thesis advisor) offered to take me<br />
on fieldwork in Afghanistan for the two months<br />
before school started. I spent the time running<br />
portable seismographs in the Hindu Kush Mountains.<br />
In one of the villages, someone tried to<br />
buy me from Peter for two camels, double the<br />
going rate.<br />
You talk to all kinds of groups. Do you<br />
see a difference between young and<br />
old people’s perceptions about<br />
earthquakes?<br />
No. There is a fundamental divide between<br />
people who are afraid of earthquakes and those<br />
who aren’t, but I have not found a defining characteristic<br />
of what makes people afraid.<br />
28 PEOPLE, LAND & WATER ★ April 2006<br />
By Stephanie Hanna and Diane Noserale<br />
Lucy Jones, chief scientist of the Earthquake<br />
Hazards Program in Southern California, is<br />
truly a household name and the face of the<br />
<strong>USGS</strong> in Southern California. Over the past<br />
23 years, she has worked tirelessly to calm<br />
shattered nerves following earthquakes and to convince<br />
Southern Californians that they can take steps to make<br />
their lives safer during an earthquake.<br />
Born in Santa Monica in 1955, Jones is a fourth-generation<br />
Southern Californian who has earned an undergraduate<br />
degree in Chinese language and literature from<br />
Brown University and a Ph.D. in geophysics from the<br />
Massachusetts Institute of Technology. This somewhat<br />
unusual combination tells the tale of her diverse interests<br />
and helped her (as a graduate student in 1979) to become<br />
the first American scientist to work in China following the<br />
normalization of relations.<br />
In 1983, Jones joined the <strong>USGS</strong> as a seismologist. Her<br />
first interview as an employee of the <strong>USGS</strong> was on PBS’s<br />
nationally televised “MacNeil/Lehrer Report” in 1985.<br />
During a spate of earthquakes that followed, she quickly<br />
became the go-to scientist for earthquake interviews, appearing<br />
on almost all the major network television news<br />
shows and making hundreds of appearances on local Los<br />
Angeles affiliates. An articulate spokeswoman, Jones has a<br />
knack for seeing through the question asked and responding<br />
to the concern or fear that prompted it.<br />
Jones has appeared multiple times on many national<br />
programs, including “Dateline,” “Nightline” and “The<br />
Today Show.” She has worked with the staff of Universal<br />
Studios and even been to Disneyland to instruct the<br />
“Three Little Pigs” in earthquake safety and non-structural<br />
mitigation (They already had learned the construction<br />
lesson!) on Disney’s “Toon-Town Kids.”<br />
For broadcasts across the nation, she must often appear<br />
awake, alert and articulate at 3 a.m., many times after<br />
live late-night newscasts. What little sleep afforded during<br />
these times is often interrupted by the shaking of local<br />
earthquakes or her beeper.<br />
Jones’ most enduring media persona is that of the calm<br />
working mom. During a post-earthquake news conference<br />
in 1992, she comforted her fussing 1-year-old. She was<br />
shown carrying a baby and advising people not to abandon<br />
their homes and potentially be caught near freeway<br />
overpasses during powerful aftershocks. She is still asked,<br />
“How’s your baby?” and responds that he is a defensive<br />
tackle on his high school’s JV football team.<br />
In her spare time — between earthquakes, media appearances,<br />
running the <strong>USGS</strong> office in Pasadena and<br />
family responsibilities with her two sons and husband,<br />
Egill Hauksson, a seismologist at Caltech — Jones has<br />
authored more than 80 scientific papers. Her research<br />
focuses primarily on earthquake-hazard assessment and<br />
forecasting earthquake aftershocks. Her theoretical geophysics<br />
work forms the basis for a Web service that provides<br />
24-hour forecasts for strong shaking from aftershocks<br />
in California. [See page 30.]<br />
She has also written several guest editorials printed in<br />
major daily newspapers and published several guidebooks<br />
for the general public and for classrooms. One of her<br />
more significant and lasting contributions was in writing<br />
and developing the publication “Putting Down Roots in<br />
Earthquake Country.” [See page 34].<br />
Her contributions to public safety also include briefing<br />
local and state officials on complex earthquake topics,<br />
helping to develop safety plans for several cities, including<br />
Los Angeles, and helping to train first responders in cities<br />
and counties throughout Southern California.<br />
<strong>USGS</strong> Earthquake Scientists — A Nationwide Notion of Pride<br />
Peter Haeussler<br />
Title: Research Geologist<br />
Location: Anchorage, Alaska<br />
Length of service with the <strong>USGS</strong>: 14 years<br />
No doubt, my most exciting experience was<br />
as the principal geologic investigator for<br />
the immediate post-earthquake geologic<br />
response to the Nov. 3, 2002, magnitude-7.9<br />
Denali Fault quake in Alaska.<br />
Right after the earthquake, we chartered a<br />
helicopter — we were looking for surface<br />
ruptures of the Denali Fault. It was really<br />
exciting to be able to follow surface ruptures<br />
on land and through glacier ice. It was the<br />
first time rupturing has been seen through<br />
glacier ice right after an earthquake.<br />
I also remember following the Denali Fault<br />
rupture when it suddenly ended, and we<br />
couldn’t find any more surface rupture. Our<br />
helicopter then flew over a mountain, and<br />
there we saw more surface rupture, this<br />
time on the little-known Totschunda Fault,<br />
which we followed out to the west where it<br />
terminated.<br />
Also, in the two days of initial investigations,<br />
we discovered there were these humongous<br />
landslides that had covered glaciers. The<br />
clouds were down low on the deck, and<br />
as we flew over in the helicopter, we were<br />
asking, “What’s all this rock here?” We then<br />
realized, “Oh — landslides!”<br />
Over the past 23 years, Lucy Jones has worked to calm shattered<br />
nerves following earthquakes and to convince Southern<br />
Californians that they can take steps to make their lives safer<br />
during an earthquake.<br />
About 10 days after the earthquake, we were<br />
also continuing to try to map the fault trace,<br />
and we wanted to go east but couldn’t because<br />
of weather. We decided to head west,<br />
and we started to find all the valleys full of<br />
clouds, so we couldn’t get to the trace.<br />
We were getting near the helicopter’s fuel<br />
limit as we were flying over a glacier, and we<br />
saw surface rupture through the glacial ice<br />
— we realized we had found a previously<br />
unknown major thrust fault, which is now<br />
known as the Susitna Glacier Thrust Fault.<br />
That was incredibly exciting to see on the<br />
ground, and satisfying because we had heard<br />
of Japanese seismologists who had a notion<br />
of there being thrusting at the beginning of<br />
the earthquake sequences. So when we saw<br />
this, we said, “Well, there it is!”<br />
That first day we were on the Susitna Glacier<br />
Thrust Fault, we heard a sound like a deep<br />
Howitzer in the distance; then the bushes on<br />
the tundra would start shaking. It was very<br />
wild hearing and feeling an earthquake aftershock<br />
while standing on the fault plane.<br />
In the end, it was the discovery and mapping<br />
out of the entire surface rupture and finding<br />
these other faults that was just<br />
really exciting.
Jones is, or has been, a member of a<br />
number of local, national and international<br />
decision-making commissions and<br />
professional associations. In 2002, then-<br />
Governor Gray Davis appointed her to the<br />
California Seismic Safety Commission,<br />
and she was reappointed by Governor<br />
Arnold Schwarzenegger in 2005. The<br />
work of the Commission has led to<br />
two bills now before the California<br />
Legislature. Jones has advised the California<br />
Offi ce of Emergency Services on the<br />
state’s earthquake-prediction and response<br />
plans and has briefed the U.S. Congress<br />
and other high-level offi cials.<br />
Generous with her time, Jones estimates<br />
that since joining the <strong>USGS</strong> she<br />
has given more than 200 talks to civic<br />
groups, teachers associations and the public.<br />
From 2- and 3-year-olds at preschool<br />
to retirement home residents, Jones has<br />
provided science education with a focus<br />
on hands-on inquiry to a variety of audi-<br />
<strong>USGS</strong> Earthquake Scientists — A Nationwide Notion of Pride<br />
John Solum<br />
Title: Mendenhall Fellow, Earthquake<br />
Hazards Team<br />
Location: Menlo Park, Calif.<br />
“ The magnitude-5.0 Pasadena earthquake in<br />
1988 was the most memorable [for me]. It was<br />
almost directly beneath my house during the night<br />
and literally threw us out of bed. Also, it was the<br />
fi rst time my oldest child, Sven, then 2 years old,<br />
saw me on TV (in that case, a live interview) and<br />
told my husband, ‘Mommy’s in the TV!’<br />
— Lucy Jones<br />
Length of service with the <strong>USGS</strong>: 1 year<br />
My proudest moment has defi nitely been<br />
working with the team of scientists from a<br />
large number of academic institutions, as<br />
well as the <strong>USGS</strong>, on the San Andreas Fault<br />
Observatory at Depth (SAFOD), which is part<br />
of the EarthScope project funded by the<br />
National Science Foundation.<br />
The SAFOD hole successfully crossed the<br />
active San Andreas Fault at a depth of<br />
several kilometers this past summer. I spent<br />
the summer of 2005 driving between Menlo<br />
Park and the SAFOD site near Parkfi eld,<br />
Calif., spending a few days here and there at<br />
the drill site to lend a hand, and then driving<br />
back to Menlo Park to analyze samples<br />
using a powder X-ray diffractometer (a lot<br />
of people were also kind enough to ferry<br />
samples up to me from the drill site).<br />
In Menlo Park, I also helped to prepare the<br />
sidewall and spot cores that came up from<br />
the hole, with the help of Sarah Draper (Utah<br />
“<br />
State University), Sheryl Tembe (SUNY Stony<br />
Brook), Fred Chester (Texas A&M), Joe Svitek<br />
(<strong>USGS</strong> Menlo Park), Steve Hickman (<strong>USGS</strong><br />
Menlo Park) and Dave Lockner (<strong>USGS</strong> Menlo<br />
Park). We devoted a lot of long hours to extracting<br />
the cores from the pieces of drilling<br />
equipment they were collected with and then<br />
preserving them, making thin sections from<br />
them and making a fi rst pass at describing<br />
their mineralogy.<br />
There were three sessions on SAFOD at the<br />
annual meeting of the American Geophysical<br />
Union in San Francisco in December 2005<br />
(Naomi Boness, a post-doctoral student at<br />
ences and age groups. She has worked to<br />
empower those who are frightened by repeated<br />
earthquakes with the message “you<br />
can keep yourself safe.”<br />
All these efforts have earned her many<br />
professional awards, not only in her specialty<br />
of seismology, but also from educators,<br />
civic groups, safety offi cials and from<br />
the media. In 2000, she was awarded the<br />
Alquist Medal for “signifi cant contribution<br />
to earthquake safety in California.” This<br />
year, she became the second non-journalist<br />
to win a Golden Mike Award from the<br />
Radio and TV News Association of Southern<br />
California for a radio-news special that<br />
drew lessons from Katrina for a future big<br />
earthquake in Los Angeles.<br />
Top 10 Things Northern Californians Should Do<br />
to Prepare for the Next Big Earthquake<br />
Excerpted from material by the 100 th Anniversary<br />
Earthquake Conference Steering Committee<br />
The people, businesses and government<br />
agencies in Northern California will risk<br />
suffering loss of life and structural and<br />
fi nancial damage when major earthquakes<br />
strike. Scientists, engineers and<br />
emergency-management experts gathering for the<br />
100 th Anniversary Earthquake Conference call on the<br />
region’s citizens, businesses and governments to take<br />
the following actions to increase safety, reduce losses<br />
and ensure a speedier recovery when the next major<br />
earthquake strikes.<br />
✔ Develop a Culture of Preparedness<br />
at Home, Work and School<br />
1. Know the seismic risks of the buildings you inhabit,<br />
the transportation systems you use and the utilities<br />
that serve them, and the actions you can take to<br />
protect yourself.<br />
2. Be prepared to be self-suffi cient for up to three<br />
days (72 hours) following a disaster.<br />
3. Take steps to ensure adequate response care for<br />
all special-needs populations — seniors, the poor, the<br />
disabled and other vulnerable residents.<br />
4. Get involved in preparing the region to respond<br />
to and recover from major earthquakes. This includes<br />
region-wide, multi-organizational plans, training, exercises<br />
and coordination assessments, as well as continuing<br />
improvements in our collective understanding of<br />
seismic risks.<br />
✔ Ensure Resiliency in Recovery<br />
8. Collaboratively plan for the regional relocation<br />
and housing, both short- and long-term, of residents<br />
displaced by potential fi res, uninhabitable buildings or<br />
widespread economic and infrastructure disruption following<br />
a major earthquake.<br />
9. Assess and plan for fi nancing your likely repair and<br />
recovery costs following a major earthquake.<br />
10. Ensure adequate post-event funding to provide<br />
economic relief to individuals and communities after a<br />
major earthquake, when resources are scarce yet crucial<br />
for recovery and reconstruction.<br />
In conclusion, the earthquake professionals of the 100 th<br />
Anniversary Earthquake Conference believe that, based<br />
on our current understanding of the hazards, local planning,<br />
stronger building codes and ongoing mitigation<br />
have substantially reduced the potential loss of life and<br />
property that a major Northern California earthquake<br />
could cause. While many areas are better prepared<br />
than ever before, the region is not yet suffi ciently ready<br />
for the next major earthquake, and the social and economic<br />
consequences could prove to be long-lasting and<br />
ruinous to communities. A renewed emphasis on preparedness<br />
and safety is needed to fully prepare Northern<br />
California for a major natural disaster.<br />
✔ Invest in Reducing Losses<br />
5. Target those buildings that pose the greatest risk of<br />
collapse for seismic mitigation through retrofi t, reduced<br />
occupancy or reconstruction.<br />
6. Retrofi t or replace all facilities essential for emergency<br />
response to ensure that they function following earthquakes.<br />
These facilities include fi re and police stations,<br />
emergency communications centers, medical facilities,<br />
schools, shelters and other community-serving facilities.<br />
7. Set priorities, and retrofi t or replace vulnerable<br />
emergency- and community-serving infrastructure —<br />
including cellular communications, airports, ports, roads<br />
and bridges, transportation, water, dams and levees, sewage,<br />
and energy supplies — to ensure that functions can<br />
be resumed rapidly after earthquakes.<br />
Stanford University, and I were the conveners<br />
of those sessions). It was very heartening<br />
for me to see all of the effort that people<br />
had put into analyzing results from SAFOD<br />
pay off with a lot of really nice presentations<br />
at that meeting. I’m a newcomer to the<br />
SAFOD project, and I feel very privileged to<br />
have been able to work with so many highly<br />
dedicated scientists.<br />
April 2006 ★ PEOPLE, LAND & WATER 29
30 PEOPLE, LAND & WATER ★ April 2006<br />
Not Just a California Thing<br />
Why Earthquakes in the Eastern and Central United States could be a Bigger Problem than You Think<br />
By Diane Noserale<br />
Scientists estimate that Memphis<br />
has a 25 to 40 percent<br />
probability of a magnitude-6.0<br />
or greater earthquake during<br />
the next 50 years. During the<br />
winter of 1811 to 1812, the central Mississippi<br />
River Valley was violently shaken by<br />
a series of earthquakes with magnitudes of<br />
7.5 to 8.0. The area of strong shaking from<br />
these shocks was two to three times larger<br />
than that of the 1964 Alaska earthquake and<br />
10 times larger than that of the 1906 San<br />
Francisco earthquake. And there’s a 7 to 10<br />
percent chance that an earthquake of this<br />
size will hit in the next 50 years.<br />
The eastern United States is not generally<br />
regarded as “earthquake country.” Yet,<br />
earthquakes do strike here. A look back<br />
shows that the eastern and central United<br />
States have a significant earthquake history,<br />
and there are factors that could make these<br />
areas of the country even more vulnerable<br />
than the West.<br />
In November 1755, an earthquake with<br />
an estimated magnitude of 6.0, centered<br />
25 miles off the coast of Cape Ann, Mass.,<br />
heavily damaged Boston. In August 1886, a<br />
magnitude-7.3 earthquake hit Charleston,<br />
S.C., destroying most of the city. During<br />
the winter earthquakes of 1811 to 1812,<br />
observers reported that the ground rose and<br />
fell. Large waves were generated on the<br />
Mississippi River; high banks collapsed;<br />
and whole islands disappeared. Raised or<br />
sunken lands, fissures and large landslides<br />
By Tania Larson<br />
In the course of a day, the<br />
probability for moderate-tostrong<br />
earthquake shaking in<br />
California is between 1-in-<br />
10,000 and 1-in-100,000. That<br />
isn’t very high when you consider that<br />
the average American has a one-in-2,500<br />
chance of being in a car accident in the<br />
same period of time. However, there are<br />
times when the likelihood of experiencing<br />
earthquake shaking goes up considerably.<br />
The <strong>USGS</strong> 24-hour forecast of aftershock<br />
hazard maps show Californians<br />
when and where the risk is elevated.<br />
Custom earthquake probability maps<br />
are available nationwide. Simply enter<br />
your ZIP code, the magnitude, and<br />
number of years you would like the probability<br />
to reflect; and the tool will return<br />
a map of your area. But the results are<br />
Earthquakes of similar size (1895 New Madrid Seismic Zone earthquake and 1994 Northridge<br />
earthquake) show how earthquakes in the central and eastern United States affect much larger<br />
areas than earthquakes in the West. Illustration by Eugene Schweig<br />
covered an area of at least 30,000 square<br />
miles. Chimneys were toppled, and log<br />
cabins were thrown down as far away as<br />
Cincinnati, Ohio, and St. Louis, Mo. These<br />
earthquakes were felt throughout the eastern<br />
United States, rattling even the White House.<br />
President Madison and his wife were said to<br />
have thought a burglary was in progress.<br />
Almost every state east of the<br />
Mississippi River has had at least one earthquake<br />
strong enough to cause damage, and<br />
a major earthquake seems to occur somewhere<br />
along the Eastern Seaboard about<br />
once every 100 years.<br />
Earthquakes in the central and eastern<br />
United States are less frequent than in the<br />
Forecast of aftershock hazard maps show<br />
Californians the likelihood of strong aftershocks,<br />
which could destroy already damaged<br />
buildings. Photo: J.K. Nakata<br />
based on a mean probability for random<br />
time periods.<br />
The <strong>USGS</strong> and the Swiss Federal Institute<br />
of Technology, with additional<br />
funding from the Southern California<br />
Earthquake Center, have developed a<br />
western United States, but they affect much<br />
larger areas. For example, let’s compare<br />
two earthquakes of similar strength: a magnitude-6.8<br />
earthquake in the New Madrid<br />
Seismic Zone in 1895 and the magnitude-<br />
6.7 Northridge, Calif., earthquake in 1994.<br />
After the New Madrid earthquake, shaking<br />
was reported from Louisiana to Michigan<br />
and from Kansas to North Carolina. Shaking<br />
reports from the Northridge earthquake,<br />
however, were mostly limited to Southern<br />
California.<br />
This strong contrast is caused by differences<br />
in geology east and west of the Rocky<br />
Mountains. Rocks in the eastern and central<br />
United States transmit earthquake waves<br />
way to quantify the current probability of<br />
shaking based on recent seismic activity<br />
— all the earthquakes recorded by the<br />
California Integrated Seismic Network,<br />
part of the <strong>USGS</strong> ANSS. [See page 22].<br />
The aftershock forecast map, released<br />
in May 2005, shows the chance<br />
for strong shaking at any location in<br />
California within the next 24 hours.<br />
“The only times probabilities become<br />
large enough to cause concern is after<br />
a significant earthquake that may have<br />
already caused damage,” said Matt<br />
Gerstenberger, former <strong>USGS</strong><br />
Mendenhall Fellow, when the maps<br />
were released. “Aftershocks are likely in<br />
this situation, and the new maps show<br />
where those aftershocks are most likely<br />
to be felt and how the hazard changes<br />
with time.”<br />
As a fault ruptures, it tends to stutter,<br />
like heavy furniture pushed along a hard<br />
more efficiently and for greater distances<br />
than those in the West.<br />
This expansive shaking is a concern<br />
because of how shaking affects buildings<br />
and other structures. It has been said that<br />
earthquakes don’t kill people, buildings do.<br />
A greater population density and an older<br />
stock of buildings and roads that have not<br />
been retrofitted for earthquake safety are a<br />
big concern. Building codes with strict provisions<br />
for earthquake-resistant construction<br />
of new buildings are less common in eastern<br />
and Middle America than in California<br />
and much of the West.<br />
Another complication for earthquake<br />
science in the eastern United States is that<br />
faults here rarely break the ground surface.<br />
Although this is a good thing, it means that<br />
in many areas faults capable of hosting<br />
earthquakes have not been mapped or even<br />
identified. How frequently and how strongly<br />
earthquakes hit the area is, therefore,<br />
often unknown.<br />
When it comes to earthquakes, one of<br />
the most important differences between the<br />
East and the West is the lack of awareness<br />
about earthquake hazards. Many people<br />
are unaware of the potential for a major<br />
earthquake to hit outside of California, and<br />
fewer still know what to do when one does<br />
hit. Whether in the East, the West or somewhere<br />
in between, all Americans should<br />
learn the earthquake risk for their area and<br />
incorporate earthquake preparedness into<br />
their overall disaster plan.<br />
Written with assistance from Tania Larson<br />
Forecast of Aftershock Hazard Maps Show Daily Shaking Probability<br />
floor. Sometimes, the first earthquake is<br />
a main event, followed by a series of aftershocks.<br />
At other times, it is a foreshock<br />
with a larger earthquake to follow. Either<br />
way, after the rumbles of one earthquake<br />
subside, there is a strong probability of<br />
more shaking to come. Within an hour<br />
of a damaging earthquake, there will<br />
likely be several aftershocks. The second<br />
day will often have half as many aftershocks<br />
as the first day.<br />
Updated hourly, the forecast maps<br />
illustrate this change in the likelihood<br />
of experiencing shaking during earthquake<br />
sequences. Perhaps even more<br />
importantly, they take magnitude and<br />
distance into account and show where<br />
potentially damaging levels of shaking<br />
are likely to occur. Past sequences show<br />
that an increase in probability could be<br />
seen before about half of California’s<br />
larger earthquakes.
By Tania Larson<br />
During the Loma Prieta<br />
earthquake in 1989, 42<br />
people were killed when<br />
the Cypress Structure,<br />
the freeway approach to<br />
the Bay Bridge from Oakland, Calif., collapsed.<br />
But it wasn’t just the strength of<br />
the earthquake that contributed to its fall.<br />
There were factors beneath the Earth’s<br />
surface that made this location particularly<br />
vulnerable to earthquake shaking.<br />
Remember the parable of the wise man<br />
who built his house upon the rock and<br />
the foolish man who built his house upon<br />
the sand? Well, the principle is still true<br />
today, and a new tool from the <strong>USGS</strong> is<br />
taking it to a whole new level. The <strong>USGS</strong><br />
has created a 3D geologic map and<br />
seismic-velocity model of the upper 30<br />
miles of the Earth’s crust in the greater<br />
San Francisco Bay Area and much of<br />
Northern California.<br />
“The new 3D model is a result of the<br />
long and productive collaboration between<br />
the California Geological Survey<br />
and <strong>USGS</strong>,” said California state geologist<br />
John Parrish. “Its usefulness will be to<br />
test and predict the intensity and effects<br />
of shaking in future earthquakes and to<br />
build safer structures. This will be cost<br />
“ “<br />
saving and life saving for residents of the Bay Area, now and in the future.”<br />
Most loss of life and property damage<br />
during earthquakes stems from the ef-<br />
For the first<br />
time, we have a tool<br />
that allows us to<br />
forecast the strong<br />
shaking likely to<br />
be produced by<br />
large Bay Area<br />
earthquakes on a<br />
neighborhoodby-neighborhood<br />
basis.<br />
— Tom Brocher<br />
<strong>USGS</strong> Earthquake Scientists — A Nationwide Notion of Pride<br />
Jack Townshend<br />
Title: Special Projects Coordinator, <strong>USGS</strong><br />
Geomagnetism Group<br />
Location: Fairbanks, Alaska<br />
Taking Seismic Science<br />
into the Third Dimension<br />
3D Models Help Predict Shaking<br />
Vulnerability in Your Neighborhood<br />
Oblique view, looking from the southwest toward San Francisco Bay: The corner of the 3D<br />
Geologic Model has been cut away to show faults (red lines), basins (yellow) and other geologic<br />
rock units (various colors). By incorporating geologic features, scientists have created a powerful<br />
new tool to help protect people and their investments by showing where earthquake shaking is<br />
likely to be more intense.<br />
fects of strong ground shaking, and scientists<br />
have shown that how long and how<br />
strongly a building will shake is directly<br />
influenced by the properties of the Earth<br />
beneath it. The Loma Prieta earthquake<br />
provided the first set of recordings of the<br />
levels of shaking on a wide variety of geologic<br />
materials, including soft, unconsolidated<br />
sand and clay.<br />
These records clearly documented that<br />
ground shaking is much more violent on<br />
the soft sediments around the Bay margins<br />
than on bedrock. They also showed<br />
that differences in the Earth’s crust can<br />
affect how seismic waves move through<br />
the ground. For example, at least two<br />
properties of the Earth’s crust worked together<br />
to cause the collapse of the Cypress<br />
Structure. First, the structure was built<br />
on loose soils that shook much more<br />
Length of service with the <strong>USGS</strong>: 33 years<br />
I remember the magnitude-9.2 Good Friday<br />
earthquake in Alaska on March 27, 1964.<br />
I was chief of the U.S. Coast and Geodetic<br />
Survey’s Geomagnetic and Seismological<br />
Observatory at the University of Alaska,<br />
Fairbanks (The Observatory was transferred<br />
to the <strong>USGS</strong> in 1973.)<br />
The house my family and I lived in was on<br />
the observatory grounds. We were 300 miles<br />
from the earthquake’s epicenter, but I remember<br />
feeling the shaking and hearing the<br />
observatory’s earthquake warning alarms.<br />
I rushed to the instrument room and saw<br />
red ink splashed all over the place. Visual<br />
seismographs used at the time had inkwells,<br />
and the instruments had been shaken off<br />
their piers. The magnetic instruments were<br />
also askew. I called in the staff, and a few<br />
hours later, we had most of the instruments<br />
back up and working.<br />
Later that night, I made a decision to do<br />
a preliminary intensity assessment in the<br />
Anchorage area. I managed to get on a flight<br />
chartered to fly doctors from Fairbanks to<br />
strongly than surrounding regions on<br />
stronger ground. And second, there were<br />
variations in the thickness of the Earth’s<br />
crust between the hypocenter and Oakland<br />
that actually focused energy toward<br />
Oakland and downtown San Francisco.<br />
The 3D model is an important scientific<br />
advancement that combines 100<br />
years of surface geologic mapping with<br />
decades of research into the seismic properties<br />
of rocks. It also incorporates information<br />
from boreholes and variations in<br />
the Earth’s gravity and magnetic fields. In<br />
creating the model, scientists broke the<br />
upper 15 to 30 miles of the Earth’s crust<br />
into irregular shaped blocks bounded<br />
by faults, making it a “fault and block”<br />
model. Since seismic waves can bounce<br />
off faults, bend and be focused as they<br />
cross faults, and be trapped and amplified<br />
in buried basins, the inclusion of subsurface<br />
faults and basins provides important<br />
information.<br />
Anchorage to assist with medical care. We<br />
couldn’t land until daylight because the<br />
airport tower was down and much of the<br />
runway was damaged. When we finally<br />
landed, I flagged down a car and driver and<br />
asked for a ride into town. The driver was<br />
a chief flight engineer with a major airline<br />
whose commercial jet had been grounded<br />
because of damaged runways. He volunteered<br />
to drive me around Anchorage and<br />
outlying areas to assess the damage and<br />
take photos.<br />
After assessing the damage from the<br />
ground, we stopped at a useable airstrip,<br />
and I asked for a piloted plane to survey the<br />
landscape even further out and from the<br />
By pulling all of this information together,<br />
the model developers have created<br />
a powerful new tool for earthquake<br />
science. “We expect this new 3D model<br />
to revolutionize our ability to forecast<br />
the location of ‘hotspots’ — where shaking<br />
occurs most intensely — throughout<br />
the Bay Area,” said Tom Brocher, <strong>USGS</strong><br />
seismologist and co-developer of the<br />
model. “For the first time, we have a tool<br />
that allows us to forecast the strong shaking<br />
likely to be produced by large Bay<br />
Area earthquakes on a neighborhood-by-<br />
neighborhood basis.”<br />
In addition to helping researchers<br />
forecast strong ground motions that may<br />
damage buildings, essential infrastructure<br />
and levees, the 3D model will help<br />
locate earthquakes more accurately; predict<br />
where destructive liquefaction of the<br />
ground may occur; and model permanent<br />
ground deformation that may be produced<br />
by earthquakes, including ground subsidence<br />
that could cause flooding. The 3D<br />
geologic map was also built with the flexibility<br />
to serve other needs in the future.<br />
Researchers are already using it to study<br />
what happens when the crustal plates that<br />
meet in California move slowly past each<br />
other, and future refinements will help<br />
scientists study groundwater movement<br />
and toxic contaminant dispersion.<br />
This information will help not only<br />
scientists, but residents, lawmakers<br />
and building designers. Chris Poland,<br />
president of Degenkolb Engineers, said,<br />
“The 3D velocity model will provide a<br />
much more detailed definition of the<br />
intensity of shaking.”<br />
With more detailed information, builders<br />
will have a better idea of how to tailor<br />
construction to fit the location, protecting<br />
people and their investments.<br />
“There are hundreds of billions of dollars<br />
of new construction each year in high<br />
seismic regions,” said Poland. “The more<br />
we can design for the proper amount of<br />
strength and durability, the more we can<br />
achieve cost efficiencies, perhaps in the<br />
billions, while giving people greater safety<br />
during a large, damaging earthquake.”<br />
<strong>USGS</strong> developers of the model include<br />
Thomas Brocher, Robert Jachens,<br />
Russell Graymer, Carl Wentworth, Bradley<br />
Aagaard and Robert Simpson.<br />
air. I was told that if I could find a pilot, they<br />
would lend me an airplane. Fortunately, I<br />
had a pilot with me! We flew around for a<br />
few hours taking photos and assessing the<br />
damage until the FAA restricted the airspace<br />
we were flying and instructed us to land.<br />
The results of this and subsequent assessment<br />
trips were published by the Alaska<br />
Division of the American Association for the<br />
Advancement of Science, 1964 Proceedings<br />
of the Alaskan Science Conference held at<br />
The University of Alaska in Fairbanks, titled,<br />
Preliminary Intensity Evaluations of the<br />
Prince William Sound Earthquake of March<br />
28, 1964, U.T.<br />
April 2006 ★ PEOPLE, LAND & WATER 31
A Guidebook to the San Andreas<br />
Geology Fieldtrips on the World’s Most Famous Fault<br />
By Clarice Nassif Ransom<br />
When Philip W. Stoffer, geologist<br />
for the <strong>USGS</strong> in Menlo<br />
Park, Calif., learned he had<br />
lymphoma, or cancer of the<br />
lymph system, in 2004, he<br />
was not sure if he was going to live. The statistics<br />
for surviving were grim. He knew he had to do<br />
whatever he could to try to survive.<br />
For four months during the summer of 2004,<br />
Stoffer underwent rounds of chemotherapy and<br />
a stem cell implant while in isolation at the<br />
Seattle Cancer Care Association. At the same<br />
time, he authored a first draft of Where’s the<br />
San Andreas Fault? A Guidebook to Tracing the<br />
Fault on Public <strong>Land</strong>s In the San Francisco Bay<br />
Region, which was unveiled in April by <strong>USGS</strong><br />
and the National Park Service (NPS).<br />
The book features more than 50 destinations<br />
along the 800-mile fault, including 20 different<br />
hiking trips in national and local parks. Stoffer wrote the<br />
field guide as part of cancer survival therapy and to encourage<br />
people to live life, not just through maps, books, television or<br />
the Internet, but in person.<br />
“Phil was hospitalized for weeks during the transplant,” said<br />
Stoffer’s good friend and colleague John Vogel, a <strong>USGS</strong> scientist<br />
in Tucson, Ariz., who spent many weeks with Stoffer<br />
during his recovery. “He worked every day, except for the a<br />
few days when he was most sick from the chemotherapy. I<br />
don’t mean eight hours a day. If he was awake, he was working.<br />
It was amazing. He wasn’t<br />
watching TV. He wasn’t reading<br />
books or magazines. He<br />
was working. I would say that<br />
having something productive<br />
to do, to focus on, was therapeutic<br />
— make that incredibly<br />
therapeutic.”<br />
“I love to hike and explore,”<br />
said Stoffer. “The whole experience<br />
of having cancer<br />
changed my outlook on life. I<br />
am someone who was not just<br />
treated for cancer, but cured<br />
from cancer. I had to give<br />
something back. You never<br />
know how much time you have<br />
left, and I had all of these pictures<br />
of different places along<br />
Point Reyes<br />
National<br />
Seashore<br />
the San Andreas Fault that I had compiled over the years and<br />
a project I was going to get to, ‘one day.’ When I was in the<br />
hospital, I was motivated to write the book and get it done. I<br />
had a field trip to go on when I got out of the hospital.”<br />
Stoffer encourages everyone to see an aspect of the San<br />
Andreas Fault in person. The field guide provides detailed<br />
information about the geologic diversity of the landscape and<br />
also describes the cultural and historical aspects of the area.<br />
Loaded with colorful photographs and detailed road maps,<br />
the guide describes the natural setting in which Bay Area<br />
residents live. The guide should interest a wide spectrum of<br />
the public, from serious hikers and geology students, to casual<br />
strollers and earth science novices.<br />
“The National Park Service relies on the organizations like<br />
32 PEOPLE, LAND & WATER ★ April 2006<br />
N<br />
12 MILES<br />
1<br />
20 KILOMETERS<br />
<strong>USGS</strong> scientist Philip W. Stoffer leads a public field trip in Sanborn Park on the<br />
San Andreas Fault. (Photo by Leslie Gordon)<br />
101<br />
Pacific Ocean<br />
Map of field-trip<br />
stop locations<br />
San Andreas Fault<br />
580<br />
80<br />
101<br />
880<br />
480<br />
San Francisco<br />
Half<br />
Moon<br />
Bay<br />
Hollister and San Juan Bautista<br />
Lexington Reservoir and Loma Prieta<br />
Forest of Nisene Marks<br />
Lyndon Canyon and Lake Ranch Reservoir<br />
Sanborn County Park<br />
Skyline Ridge<br />
San Mateo County<br />
Point Reyes National Seashore<br />
1<br />
92<br />
1<br />
35<br />
101<br />
780<br />
the U.S. Geological Survey to provide scientific information<br />
to help make informed decisions and to help educate the<br />
public,” writes Don Neubacher, park superintendent, Point<br />
Reyes National Seashore, in the preface to the guidebook.<br />
“This field guide is an example of collaboration between the<br />
two federal agencies. Our hope is that this guidebook will<br />
help enrich public understanding and encourage exploration<br />
of our natural and cultural heritage.”<br />
“The [guidebook] is the best thing since the invention of<br />
ice cream!” said David Boore, a docent with the Midpeninsula<br />
Regional Open Space District. “This publication<br />
is a fantastic resource for those interested in the geology of<br />
the San Francisco Bay Area.<br />
It’s well-written, detailed,<br />
280<br />
84<br />
9<br />
85<br />
680<br />
880<br />
17<br />
Santa<br />
Cruz<br />
San Jose<br />
129<br />
101<br />
152<br />
580<br />
25<br />
205<br />
156<br />
San Juan<br />
Bautista<br />
156<br />
up-to-date, includes useful<br />
background information about<br />
earthquakes and faults, contains<br />
lots of color photos and<br />
maps, and the price is right.”<br />
Tom Brocher, a seismologist<br />
with the <strong>USGS</strong>, added, “This<br />
guidebook is a great educational<br />
resource for learning<br />
about the geology and natural<br />
environment along the coast<br />
in the Bay Area. What I love<br />
about the guidebook is that it<br />
offers several different tours<br />
of the San Andreas Fault that<br />
cater to diverse educational in-<br />
terests and hiking abilities. Everyone can find something of<br />
interest in it.”<br />
The release of the guidebook also coincides with the 100 th<br />
anniversary of the Great San Francisco Earthquake. On April<br />
18, 1906, the earth ruptured for about 300 miles along the<br />
San Andreas Fault through Northern California, both on<br />
land and where the fault extends offshore. The earthquake<br />
and fires that followed caused catastrophic damage to cities<br />
and towns throughout the region and had a dramatic impact<br />
on the culture and history of California. The event also<br />
initiated national interest in the study of earthquakes and disaster<br />
prevention. The field guide can be accessed online at http://<br />
pubs.usgs.gov/gip/2006/16/.<br />
Story written with contributions from Tom Brocher.<br />
5<br />
152<br />
Hollister<br />
25<br />
Stoffer’s Favorite Bay<br />
Region Places to Visit:<br />
■ Pinnacles National Monument<br />
(San Benito and Monterey Counties)<br />
— This monument features high, rugged<br />
mountain scenery (an ancient volcano),<br />
boulder-covered slot canyons<br />
and many miles of well-maintained<br />
hiking trails.<br />
Point Reyes<br />
Headlands<br />
in Point<br />
Reyes<br />
National<br />
Seashore.<br />
■ Point Reyes National Seashore<br />
(Sonoma County) — This national<br />
park features unrivaled coastal sea cliffs<br />
and coastal prairie scenery.<br />
■ Henry Coe State Park (Santa Clara<br />
County) — This is the second largest<br />
state park in California and has hundreds<br />
of miles of trails throughout the<br />
central Diablo Range.<br />
The valley<br />
of the Arroyo<br />
Seco<br />
Canyon in<br />
the Ventana<br />
Wilderness.<br />
The High<br />
Peaks area<br />
within<br />
Pinnacles<br />
National<br />
Park.<br />
California<br />
poppies growing<br />
near the<br />
top of Mount<br />
Wilson in<br />
Henry Coe<br />
State Park.<br />
■ Arroyo Seco Canyon (Ventana Wilderness,<br />
Monterey County) — This<br />
wilderness area features a perennial<br />
stream that cuts through gorges in<br />
the Santa Lucia Range. The lower<br />
valley usually has unrivaled spring<br />
wildflowers.<br />
The Marin<br />
Headlands<br />
portion of<br />
Golden Gate<br />
National<br />
Recreation<br />
Area.<br />
■ Marin Headlands, Golden Gate<br />
National Recreation Area (Marin<br />
County) — This park provides spectacular<br />
views of the San Francisco Bay<br />
and has many miles of excellent hiking<br />
and riding trails.
■ Elkhorn Slough (Santa Cruz and<br />
Monterey County) — This is a kayaking,<br />
wildlife-viewing wonderland.<br />
The<br />
seacliffs<br />
at Cove<br />
Beach in<br />
Año Nuevo<br />
State Park.<br />
■ Año Nuevo State Park (San<br />
Mateo County) — Año Nuevo is host<br />
to large seasonal population of elephant<br />
seals and other marine mammals,<br />
and also has scenic beaches and<br />
access to coastal mountain hiking.<br />
■ Wilder Ranch State Park (Santa<br />
Cruz County) — This park has many<br />
miles of hiking and riding trails,<br />
including trails along an undeveloped<br />
4-mile stretch of sea cliffs.<br />
The<br />
outcrops of<br />
limestone<br />
on the top<br />
of Black<br />
Mountain.<br />
■ Black Mountain (Mid Peninsula<br />
Open Space Preserve, San Mateo<br />
County) — This is an exceptional<br />
hiking area within the central<br />
Santa Cruz Mountains.<br />
■ Big Basin State Park (Santa Cruz<br />
County) — This has a relatively<br />
untouched stand of great coastal redwoods,<br />
but the park also has many<br />
miles of hiking trails that extend<br />
from the crest of the Santa Cruz<br />
Mountains, near Castle Rock State<br />
Park, to the coast at Año Nuevo.<br />
One of the unusual<br />
rock formations<br />
along<br />
the trail system<br />
at Castle Rock<br />
State Park.<br />
Elkhorn<br />
Slough harbors<br />
the largest<br />
tract of tidal<br />
salt marsh in<br />
California.<br />
The rugged<br />
sea cliffs<br />
along the<br />
coast trail in<br />
Wilder Ranch<br />
State Park.<br />
Two large,<br />
fire-scorched<br />
Coastal<br />
Redwoods<br />
in Big Basin<br />
State Park.<br />
■ Castle Rock State Park (Santa<br />
Clara and Santa Cruz Counties)<br />
— This park straddles the crest<br />
of Castle Rock Ridge in the central<br />
Santa Cruz Mountains and<br />
provides exceptional hiking and<br />
rock-climbing opportunities.<br />
By Heidi Koontz and David Wald<br />
Have you ever been<br />
through an earthquake?<br />
Did you know that reporting<br />
your experience<br />
during an earthquake<br />
can help save lives and property during<br />
future quakes?<br />
As a result of work by <strong>USGS</strong> with the<br />
cooperation of various regional seismic<br />
networks, the world can log in on the Internet<br />
and tell <strong>USGS</strong> scientists what they<br />
felt during an earthquake.<br />
By logging on to the <strong>USGS</strong> Earthquake<br />
Hazards Program Web site (http://earthquake.usgs.gov)<br />
and clicking on the “Did<br />
You Feel It?” link, the public can help<br />
provide information about the extent of<br />
shaking and damage during earthquakes.<br />
These “citizen scientists” may also provide<br />
specific details about how their area<br />
may respond to future earthquakes.<br />
Did You Feel It? and ShakeMaps have<br />
revolutionized the way earthquakes are<br />
reported and how emergency responders<br />
take action.<br />
<strong>USGS</strong> scientist David Wald knew<br />
these tools could help communicate post-<br />
earthquake information. But when he<br />
wrote a computer program on a whim<br />
in the late ’90s, he had no idea how<br />
pivotal these instruments would become<br />
to citizens, a.k.a. Net-izens, and<br />
emergency responders.<br />
“We wanted to make the science<br />
tangible and allow the users to tell us in<br />
simple terms how the quake impacted<br />
them, so we could in turn create some-<br />
Did You Feel It?<br />
Citizen Science Goes Seismic<br />
As a result of work<br />
by <strong>USGS</strong> with the<br />
cooperation of<br />
various regional<br />
seismic networks,<br />
the world can log in<br />
on the Internet<br />
and tell <strong>USGS</strong><br />
scientists what<br />
they felt during an<br />
earthquake.<br />
thing user-friendly for emergency personnel<br />
to rely upon,” said Wald, who<br />
created the software along with Vincent<br />
Quitoriano and James Dewey.<br />
Not too long ago, the first thing that<br />
most people did after feeling an earthquake<br />
was to turn on their television or<br />
radio for information. Recently, more and<br />
more people turn to the Internet instead,<br />
not only to obtain information, but also to<br />
share their experience of the earthquake.<br />
Users enter their ZIP code and answer<br />
a list of questions, such as, “Did<br />
the earthquake wake you up?” and “Did<br />
objects fall off shelves?” These responses<br />
are compiled into a database, and within<br />
minutes, a map to take shape on the In-<br />
This map shows<br />
responses for ZIP codes<br />
in the conterminous<br />
United States since<br />
Did You Feel It?<br />
started. More than<br />
500,000 individual<br />
responses have been<br />
measured. Earthquakes<br />
have been felt<br />
in all 50 states and in<br />
the U.S. territories.<br />
ternet. In a couple of hours, with several<br />
thousand responses at times, a Community<br />
Internet Intensity Map shows where<br />
and how strongly the earthquake was felt<br />
and where damage has been reported.<br />
The maps are then continuously<br />
updated as additional data are received.<br />
Did You Feel It? Summarizes the responses,<br />
and an intensity value is assigned<br />
to each ZIP code received. The intensity<br />
may change as more questionnaires are<br />
submitted, and the map reflects these<br />
modifications. ZIP code areas are colorcoded<br />
according to the intensity scale that<br />
accompanies the map. From the user’s<br />
perspective, Did You Feel It? is interactive,<br />
providing instantaneous feedback on<br />
the individual’s intensity along with a link<br />
back to the maps.<br />
During the past five years, more than<br />
500,000 reports for earthquakes ranging<br />
from magnitude 2.0 (New Jersey, April<br />
2004) to magnitude 7.9 (Alaska, December<br />
2001) have been logged via the Did<br />
You Feel It? Web site. Events have been<br />
felt in every state in the nation, as well as<br />
in Puerto Rico, Guam, the Virgin Islands<br />
and other U.S. territories. What’s more,<br />
other phenomena, often initially perceived<br />
as earthquakes, have been widely<br />
reported with Did You Feel It?, including<br />
sonic booms from the space shuttle,<br />
other supersonic aircraft and even meteors!<br />
Recently, the system went worldwide;<br />
and numerous responses for earthquakes<br />
felt around the globe, including<br />
reports within thousands of miles of the<br />
magnitude-9.1 2004 great Sumatra<br />
tsunami earthquake, were documented.<br />
April 2006 ★ PEOPLE, LAND & WATER 33
Putting Down Roots<br />
in Earthquake Country<br />
Are You Prepared for “The Big One”?<br />
By Tania Larson<br />
Earthquakes are scary because<br />
they are largely<br />
unpredictable. We don’t<br />
know exactly when, where<br />
or with how much force<br />
they are going to strike, but we do know<br />
they will strike again. It’s easy to feel powerless<br />
in the face of such information, but<br />
there are several things you can do to protect<br />
yourself and your loved ones. In fact,<br />
preparedness is key to survival.<br />
“Putting Down Roots in Earthquake<br />
Country,” developed by the <strong>USGS</strong> and<br />
numerous partners, contains a wealth<br />
of earthquake information. There are<br />
two versions of the handbook, one for<br />
Northern California and one for<br />
Southern. Both provide information to<br />
help you prepare for, survive and recover<br />
from future earthquakes.<br />
“All Californians need to be made<br />
aware of earthquake hazards and how<br />
to survive them,” said California state<br />
geologist John Parish. “This handbook is<br />
a valuable primer for preparedness.”<br />
Because earthquakes can strike previously<br />
unknown faults, even those<br />
who don’t believe they are in an earthquake-prone<br />
area could benefit from the<br />
handbook’s clear explanations and practical<br />
advice.<br />
The handbook contains seven steps to<br />
earthquake safety and is filled with recommendations<br />
you can start on today. One<br />
tip is to make sure areas where people sit<br />
34 PEOPLE, LAND & WATER ★ April 2006<br />
or sleep are clear of dangerous items —<br />
bookcases, glass picture frames and other<br />
heavy objects — that could fall during<br />
an earthquake. Other tidbits of wisdom<br />
are to prepare your loved ones for earthquakes<br />
by making disaster kits, practicing<br />
earthquake safety with children, and making<br />
sure you don’t forget Fido and Fluffy<br />
in your disaster-preparedness plan.<br />
So, what do you do when the earth<br />
actually starts shaking? — “Drop, Cover<br />
and Hold On.”<br />
About the Handbooks<br />
These practical guides to earthquake<br />
survival are the result of many groups<br />
coming together to meet a public need.<br />
When a magnitude-6.9 earthquake struck<br />
Loma Prieta, Calif., on October 17, 1989,<br />
it caused extensive damages and took<br />
many lives. Many people, having seen<br />
the destructive power of earthquakes but<br />
still having little understanding of how to<br />
protect themselves, came out of the event<br />
with an overly heightened sense of fear;<br />
others thought they had survived “the big<br />
one” and came out with an overly heightened<br />
sense of safety. However, this earthquake,<br />
though strong and damaging, had<br />
only released 3 percent of the energy of<br />
the “Great 1906 Quake” and was not “the<br />
big one” that scientists believe is likely<br />
to occur in the area. Something needed<br />
to be done to give residents both a realistic<br />
understanding of the dangers and<br />
knowledge of the things they should do to<br />
protect themselves.<br />
“Putting Down Roots” is full of helpful hints to protect you, your loved ones and your property from earthquake<br />
hazards. This cutaway diagram shows how weak cripple walls can be strengthened with properly attached<br />
plywood sheets.<br />
“Putting Down Roots” cover art by Jere Smith.<br />
Peter Ward, now retired, was a <strong>USGS</strong><br />
seismologist at the time of the Loma<br />
Prieta earthquake. He said, “While we in<br />
the geosciences were studying the scientific<br />
causes and effects of Loma Prieta,<br />
those in the social sciences asked us how<br />
we could help them educate the public to<br />
be better prepared for future earthquakes<br />
that we told them would surely happen.”<br />
In response, Ward contacted Red Cross<br />
officials and offered to<br />
write a booklet explaining<br />
why and how frequently<br />
earthquakes occur in the<br />
San Francisco Bay area<br />
and what people could do<br />
to prepare to survive future<br />
earthquakes.<br />
The Red Cross and other<br />
disaster-relief agencies<br />
pitched in the funds to<br />
produce the booklet, and<br />
three months later, “The<br />
Next Big Earthquake In<br />
the Bay Area May Come<br />
Sooner Than You Think<br />
— Are You Prepared?”<br />
was published. With a<br />
pressrun of ultimately<br />
more than 3 million<br />
copies, this helpful, easy-<br />
to-read booklet became<br />
the most widely distributed<br />
publication ever prepared by the <strong>USGS</strong>.<br />
The magnitude-6.7 Northridge earthquake<br />
in 1994, created the need for a book<br />
targeting the southern part of the state,<br />
and “Putting Down Roots in Earthquake<br />
Country — Your Handbook for Living in<br />
Southern California” was produced. The<br />
handbook was first written in 1995 by<br />
Lucy Jones, <strong>USGS</strong> scientist-in-charge for<br />
Southern California. She said, “It took a<br />
year of my life but was extremely satisfying.<br />
I was able to bring my understanding<br />
of earthquakes to many people and<br />
reduce fear and empower change.”<br />
Two million copies were printed<br />
and distributed between 1995 and<br />
2003. For the 10 th anniversary of the<br />
Northridge earthquake, Jones teamed<br />
up with Mark Benthien, of the Southern<br />
California Earthquake Center, to update the<br />
handbook.<br />
Shortly after the Southern California<br />
edition was updated, a version for<br />
Northern California was underway, and<br />
“Putting Down Roots in Earthquake<br />
Country — Your Handbook for the<br />
San Francisco Bay Region” was published<br />
in 2005.<br />
The creation and distribution of these<br />
booklets has been a phenomenal collaborative<br />
effort, bringing federal and state<br />
agencies, private companies, nonprofit<br />
organizations and the media together to
identify and meet the needs of local communities.<br />
Zoback said, “The amazing thing about<br />
‘Roots’s’ Northern California version was<br />
the coming together of all the groups and<br />
agencies in the greater Bay Area with<br />
‘ownership’ of the earthquake problem<br />
— science, engineering and emergency<br />
response. The best thing about the effort<br />
was that it was a true team collaboration,<br />
all 12 groups listed on the cover as authors<br />
actually contributed to the writing<br />
in a significant way.”<br />
This edition of the handbook is part<br />
of the 1906 Earthquake Centennial<br />
Alliance effort, and thanks to the Pacific<br />
Gas & Electric (PG&E) Foundation,<br />
plans for the handbook now include<br />
translation into Spanish and several<br />
Asian languages.<br />
When the new version was released,<br />
Harold Brooks, CEO of the Red Cross<br />
Bay Area Chapter, said, “The American<br />
Red Cross will be working over the next<br />
three years to get more than 1 million additional<br />
families in the Bay Area prepared<br />
for a large earthquake. This handbook<br />
will play an important role in our training<br />
efforts.”<br />
On September 18, 2005, booklets<br />
were distributed to more than 500,000<br />
readers in the Sunday edition of the<br />
San Francisco Chronicle. On April 9,<br />
2006, the handbook was sent to more<br />
than 1 million readers with the Sunday<br />
Los Angeles Times, and upon completion,<br />
the forthcoming Spanish version will be<br />
included in Oy, the LA Times’ Spanish<br />
language daily.<br />
“The real story of the success,” Zoback<br />
said, “is the amazing continued demand<br />
for the booklet.” The San Francisco General<br />
Hospital requested 5,000 copies for<br />
their employees. The Solano County Jail<br />
requested 200 for concerned inmates.<br />
But Zoback thinks the best compliment<br />
came from former ambassador and Sunset<br />
Magazine publisher William (Bill)<br />
Lane. She said, “Bill called and said he<br />
loved ‘Roots’ and wanted to give a copy<br />
to every household in his town, Portola<br />
Valley. He drove his station wagon to our<br />
office, and we loaded up 21 boxes (2,100<br />
copies!) in the back. He then took them<br />
to the Menlo Park post office where he<br />
paid to have the postmaster deliver one to<br />
every household in Portola Valley.”<br />
A Web site was created that allows<br />
people to order up to 10 copies of the<br />
handbook, and Zoback is happy to report<br />
that many people are ordering multiple<br />
copies. She said, “We were sending them<br />
to auto body shops, beauty shops, etc.<br />
— absolutely the best type of grass roots<br />
distribution, folks giving them to folks<br />
they care about.”<br />
If you would like copies for yourself<br />
and loved ones, visit http://pubs.usgs.<br />
gov/gip/2005/15 or call the Red Cross<br />
at (510) 595-4459 for the Northern<br />
California Handbook. For the Southern,<br />
go to http://www.earthquakecountry.info/.<br />
A Profusion of Products and Events<br />
for the 1906 Earthquake Centennial<br />
In addition to those already<br />
mentioned in this publication,<br />
the U.S. Geological Survey<br />
is involved with a number<br />
of products and several events<br />
commemorating the 1906 centennial,<br />
many of which are listed below. Please<br />
continue to visit http://earthquake.<br />
usgs.gov/regional/nca/1906/ for more<br />
information.<br />
PRODUCTS<br />
The <strong>USGS</strong> Gives Tours of the 1906<br />
San Francisco Earthquake — This<br />
<strong>USGS</strong> tour offers a variety of information,<br />
from ground-shaking maps and<br />
fault locations to historic photographs<br />
and quotes from those who were actually<br />
there. This tour uses Google Earth ,<br />
a computer program that combines satellite<br />
imagery with geospatial information<br />
to allow users to view and interact<br />
with actual images of the Earth’s surface<br />
in three dimensions.<br />
The <strong>USGS</strong> Gives a Virtual Tour of<br />
the Hayward Fault — This is a Webbased<br />
strip map. This tour offers a virtual<br />
helicopter tour of the Hayward Fault<br />
with parcel scale resolution so that<br />
property owners can locate their land.<br />
Two New <strong>USGS</strong> Maps Identify<br />
San Francisco Bay Area Liquefaction<br />
Risk — The first of these products is a<br />
new map of the young geologic deposits<br />
in the low-lying sections of the Bay<br />
Area. Some of these areas can undergo<br />
liquefaction, the phenomenon in which<br />
saturated soils lose their stiffness and<br />
strength during shaking, and some can<br />
greatly increase the severity of shaking<br />
that is transmitted through the deposits.<br />
The second of the map products, derived<br />
from the first map, shows the likelihood<br />
that these young deposits will<br />
liquefy due to the strong shaking a big<br />
earthquake will produce.<br />
Two New <strong>USGS</strong> Maps Show the<br />
Bay Area’s Active Faults and Geologic<br />
Materials — The first of these<br />
products is a new map of the known<br />
Quaternary-active faults in the Bay Area<br />
that have pushed up mountains and<br />
generated earthquakes over the past<br />
2 million years.<br />
The second product is a new map of<br />
the geologic materials and structures of<br />
the Bay Area.<br />
<strong>USGS</strong> Partnership Puts Curriculum<br />
Into the Classroom — The <strong>USGS</strong> has<br />
created two new educational resources<br />
to help teachers explain earthquake<br />
science.<br />
“Earthquake Science Explained”<br />
highlights how scientists study earthquakes,<br />
what evidence they collect<br />
and what they have learned since the<br />
1906 Earthquake.<br />
“Living in Earthquake Country: A<br />
Teaching Box,” a newly released online<br />
earthquake hazard resource, provides<br />
teachers with lessons including<br />
fully developed hands-on earthquake<br />
curriculum, teaching points and easyto-reproduce<br />
handouts.<br />
The <strong>USGS</strong> Unveils New Digital<br />
Map to Show Active Portions of the<br />
San Andreas Fault near San Francisco<br />
to Help the Public Be Better Prepared<br />
for Earthquakes — This is the first-ever<br />
comprehensive digital strip map of the<br />
San Andreas Fault on the San Francisco<br />
peninsula. The map features new, more<br />
accurate mapping of the 1906 fault rupture<br />
and also includes digital versions<br />
of previous paper-only maps along with<br />
earthquake reports from the 1906 earthquake,<br />
designated fault hazard zones,<br />
trenches and historical photos.<br />
EVENTS<br />
April 18<br />
“Shock Waves: 100 Years After the<br />
1906 Earthquake” — The <strong>USGS</strong>’<br />
Steve Wessels hosts this one-hour documentary,<br />
scheduled for prime time on<br />
San Francisco Bay Area CBS affiliate<br />
KPIX Channel 5.<br />
April 18-22<br />
The International Earthquake<br />
Conference — The conference will fo-<br />
cus on the 1906 earthquake, a century<br />
of progress in earthquake science and<br />
engineering and the likely impact of future<br />
earthquakes in the Bay Area. Organized<br />
by Disaster Resistant California,<br />
the Seismological Society of America<br />
and the Earthquake Engineering Research<br />
Institute.<br />
April or May<br />
Meet the Hayward Fault Face to<br />
Face — The <strong>USGS</strong> will host “The<br />
Hayward Fault — An Interpretive Viewing<br />
and Educational Exhibit” along the<br />
Hayward Fault, near Sailway Drive at<br />
Central Park in Fremont, Calif.<br />
The exhibit will feature a 12-to-<br />
15-foot-deep trench across the Hayward<br />
Fault in Fremont. The fault is<br />
easily visible within the sediments at this<br />
location, and visitors will be encouraged<br />
to descend a staircase to meet the<br />
Hayward face to face. For safety reasons,<br />
the trench walls will not be vertical, and<br />
the space will not feel too confining.<br />
Recreation of the Famous 1906<br />
Kite Photograph of San Francisco<br />
After the Earthquake and Fire — The<br />
Drachen Foundation and the <strong>USGS</strong>’<br />
Scott Haefner recreate photographer<br />
George Lawrence’s famous aerial image<br />
of San Francisco, taken from a kite<br />
three weeks after the earthquake and<br />
fire of 1906.<br />
Late May/Early June<br />
A 1906 groundshaking<br />
simulation<br />
shows how the<br />
earthquake spread<br />
from its epicenter,<br />
about two miles<br />
west of the San<br />
Francisco Zoo,<br />
and grew to cause<br />
strong shaking<br />
and damage along<br />
more than 300<br />
miles of the San<br />
Andreas Fault.<br />
<strong>USGS</strong> Open House in Menlo<br />
Park — This is an opportunity for the<br />
public and partners to see displays of<br />
<strong>USGS</strong> research and talk to scientists<br />
about their work in a variety of fields.<br />
A special earthquake tent will focus on<br />
1906 and other topics. There will also<br />
be interactive displays and activities for<br />
adults and children.<br />
April 2006 ★ PEOPLE, LAND & WATER 35
U.S. Dept. of the Interior<br />
Mail Stop 6013<br />
1849 C St. NW<br />
Washington, D.C. 20240<br />
Official Business<br />
Penalty for Private Use $300<br />
Prsrt Std<br />
POSTAGE & FEES PAID<br />
U.S. Dept. of the Interior<br />
Permit No. G-832