LA Health - Food Insecurity - Steven Reed Johnson
LA Health - Food Insecurity - Steven Reed Johnson
LA Health - Food Insecurity - Steven Reed Johnson

Create successful ePaper yourself
Turn your PDF publications into a flip-book with our unique Google optimized e-Paper software.
March 2004<br />
FOOD INSECURITY<br />
<strong>Food</strong> insecurity, defined as the limited or uncertain<br />
availability of nutritionally adequate and safe foods, has<br />
been identified as an important public health concern<br />
in the United States. 1 Results from the most recent Los<br />
Angeles County <strong>Health</strong> Survey (<strong>LA</strong>CHS) indicate that<br />
many households in the county experience food<br />
insecurity and hunger, a severe form of food insecurity.<br />
The survey found that 22% of lower income<br />
households (defined throughout this brief as<br />
households with annual incomes less than 300% of the<br />
federal poverty level (FPL 2 )) experienced food<br />
insecurity in the past year (Table 1). This equates to<br />
over 400,000 households with food insecurity, of<br />
which 141,000 included someone who had<br />
experienced hunger in the past year.<br />
The survey also found large racial/ethnic (Figure 1),<br />
geographic (Figure 2), and income disparities among<br />
those lower income households experiencing food<br />
insecurity. The percentage of lower income households<br />
(
Percentage of Lower Income Households (
<strong>Health</strong> Characteristics of Respondents<br />
Living in <strong>Food</strong> Insecure Households<br />
<strong>Food</strong> insecurity and hunger have been associated with<br />
increased risk for poor nutritional status and poor health<br />
outcomes. 4 Research has found that children living in<br />
lower income, food insecure households are generally in<br />
poorer health, and do worse in school with more<br />
absences, tardiness and suspensions. 5,6,7 The <strong>LA</strong>CHS<br />
found that 41% of respondents living in lower income,<br />
food insecure households reported fair or poor health<br />
status as compared to 25% of respondents living in lower<br />
income food secure households (Table 3). Individuals in<br />
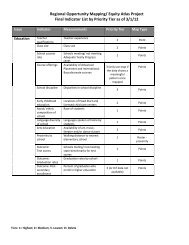
Demographic Characteristics of Respondents Living In<br />
<strong>Food</strong> Insecure 3 & <strong>Food</strong> Secure Households, 2002–03<br />
Race<br />
Living In Living In<br />
<strong>Food</strong> Insecure Household <strong>Food</strong> Secure Household<br />
Percentage Est. # Percentage Est. #<br />
Latino 61.7% 576,000 50.5% 1,712,000<br />
White 18.1% 169,000 25.1% 852,000<br />
African-American 11.7% 109,000 9.5% 322,000<br />
Asian/Pacific Islander 8.5% 80,000 14.9% 503,000<br />
Education<br />
Less than high school 45.6% 426,000 32.9% 1,113,000<br />
High school 26.4% 247,000 27.0% 915,000<br />
Some college or 19.8% 185,000 25.1% 850,000<br />
trade school<br />
College or 8.2% 77,000 15.0% 508,000<br />
post graduate degree<br />
Citizenship<br />
U.S. 55.9% 524,000 68.3% 2,319,000<br />
Non U.S. 44.1% 413,000 31.7% 1,077,000<br />
Country of Birth<br />
Foreign 58.3% 547,000 51.6% 1,752,000<br />
U.S. 41.7% 391,000 48.4% 1,644,000<br />
Employment Status<br />
Employed 52.7% 481,000 56.8% 1,867,000<br />
Unemployed 7.6% 69,000 3.7% 120,000<br />
Not in labor force 39.7% 362,000 39.5% 1,298,000<br />
lower income, food insecure households reported almost<br />
twice as many poor health days than those in lower<br />
income, food secure households (Table 3).<br />
Recent research has also shown that food insecurity<br />
is related to obesity. 8,9 This association is not intuitive<br />
as overweight is often attributed to overeating, and not<br />
to hunger and not eating enough (See Sidebar: <strong>Food</strong><br />
<strong>Insecurity</strong> and Weight Gain, p.4). <strong>LA</strong>CHS results<br />
indicate that a higher percentage of respondents living<br />
in lower income, food insecure households were obese<br />
(27%) as compared to those living in lower income,<br />
food secure households (20%) (Table 3). Additionally, a<br />
higher percentage of respondents living in lower<br />
income, food insecure households reported physical<br />
inactivity (49%), being disabled (30%), and living in a<br />
perceived unsafe neighborhood (40%) as compared to<br />
respondents living in lower income, food secure<br />
neighborhoods (Table 3). Thus, factors such as<br />
physical inactivity and living in neighborhoods<br />
perceived to be unsafe might put those living in food<br />
insecure households at further risk for obesity.<br />
What Can Be Done?<br />
Increasing eligibility and participation in the federal<br />
food programs is a first line of defense against food<br />
insecurity. The enrollment process to these federal food<br />
programs should be more consumer-friendly to remove<br />
barriers and stigmas that individuals and families in<br />
need of assistance may feel (See Sidebar: Federal <strong>Food</strong><br />
Programs, p.5).<br />
Los Angeles County has high housing and utility<br />
costs, low-paying jobs, inadequate public<br />
transportation, and food access problems that may<br />
affect the prevalence of food security. Additionally, the<br />
decision to make healthy food choices and avoid<br />
obesity is impacted by the large amount of advertising<br />
and easy accessibility to fast food restaurants. Thus, in<br />
addition to the federal programs, local interventions<br />
are also needed to help prevent food insecurity and the<br />
related problem of obesity.<br />
4. Center on Hunger and Poverty, Heller School for Social Policy and Management, Brandeis<br />
University. (2002) The consequence of hunger and food insecurity for children—evidence from<br />
recent scientific studies.<br />
5. Alaimo K, Olson CM, Frongillo EA Jr. <strong>Food</strong> insufficiency and American school-aged children’s<br />
cognitive, academic, and psychosocial development. Pediatrics 108: 44-53, 2001.<br />
6. Kleinman RE, Murphy JM, Little M, Pagano M, Wehler, CA, Regal K, Jellinek MS. Hunger in<br />
children in the United States: Potential behavioral and emotional correlates. Pediatrics 101: 1-6,<br />
1998.<br />
7. Murphy JM, Wehler CA, Pgano ME, Little M, Kleinman RE, Jellinek MS. Relationship between<br />
hunger and psychosocial functioning in low-income American children. J American Academy of<br />
Child & Adolescent Psychiatry 37: 163-170, 1998.<br />
8. Adams EJ, Grummer-Strawn L & Chavez G. <strong>Food</strong> <strong>Insecurity</strong> is associated with increased risk of<br />
obesity in California women. Journal of Nutrition 2003.<br />
9. Townsend MS et al. <strong>Food</strong> insecurity is positively related to overweight in women. Journal of<br />
Nutrition 2001; 131: 1738-1745.
Selected <strong>Health</strong> Characteristics of Respondents Living<br />
In <strong>Food</strong> Insecure 3 & <strong>Food</strong> Secure Households, 2002–03<br />
<strong>Health</strong> Status<br />
Living In Living In<br />
<strong>Food</strong> Insecure Household <strong>Food</strong> Secure Household<br />
Percentage Est. # Percentage Est. #<br />
Excellent/Very Good 23.6% 221,000 39.4% 1,335,000<br />
Good 35.6% 333,000 35.7% 1,209,000<br />
Fair/Poor 40.8% 381,000 25.0% 847,000<br />
Poor <strong>Health</strong> Days+ 11 days 6 days<br />
(Average per Month)<br />
BMI<br />
Obese 27.2% 203,000 20.0% 606,000<br />
Overweight 36.0% 269,000 35.8% 1,085,000<br />
Normal 34.8% 260,000 41.5% 1,257,000<br />
Underweight 2.0%* 15,000 2.7% 81,000<br />
Physical Activity<br />
Active (Meets Guidelines) 42.0% 390,000 46.4% 1,565,000<br />
Some Activity 9.5% 88,000 9.1% 305,000<br />
(Does Not Meet Guidelines)<br />
Minimal to No Activity 48.6% 451,000 44.6% 1,503,000<br />
(Sedentary)<br />
Disabled<br />
Yes 29.6% 276,000 18.4% 622,000<br />
No 70.4% 656,000 81.6% 2,760,000<br />
Perceived Neighborhood Safety<br />
Very Safe 15.7% 146,000 27.0% 909,000<br />
Somewhat Safe 44.3% 412,000 49.3% 1,660,000<br />
Somewhat Unsafe 25.1% 233,000 16.1% 542,000<br />
Not at All Safe 15.0% 139,000 7.5% 253,000<br />
+ Average number of reported poor physical and/or mental health days in the past month.<br />
*Estimate should be viewed with caution because of small numbers.<br />
Lower income households and communities need<br />
greater access to grocery stores and corner stores that<br />
provide healthy, affordable, and nutritionally adequate<br />
food. Public transportation between food insecure areas<br />
and grocery stores can be increased through policies.<br />
10. Radimer, K.L, Olson, C.M., Greene, J.C., Campbell, C.C., & Habicht, J. (1992).<br />
Understanding hunger and developing indicators to assess it in women and children. Journal of<br />
Nutrition Education, 24, 36S-45S.<br />
11. Slone, D.C., Diamant, A.L., Lewis, L.B., Yancey, A.K., Flynn, G., Nascimento, L.M.,<br />
McCarthy, W.J., Guinyard, J.J., and Cousineau, M.R. (2003) Improving the nutritional<br />
resources environment for healthy living through community-based participatory research.<br />
Journal General Internal Medicine 2003; 18:568-575.<br />
12. Tranquada, J. Supermarket shortage still plagues inner-city los angeles ten years after the 1992<br />
riots, new report shows. 2002. www.oxy.edu/news/articles/020631-supermarket.html<br />
<strong>Food</strong> <strong>Insecurity</strong> and Weight Gain<br />
<strong>Food</strong> insecurity and obesity is a paradox complicated by many factors<br />
including genetics, metabolism, behavior, environment and socioeconomic<br />
conditions. Possible explanations linking the lack of adequate resources for<br />
food and the prevalence of obesity in the food insecure are described below:<br />
Stretching <strong>Food</strong> Dollars: Many lower income, food insecure households<br />
may resort to consuming lower cost foods that are typically lower in<br />
nutritional quality and contain higher levels of calories per dollar (e.g.,<br />
affordable fast-foods for convenience with increased portion size). Research<br />
indicates that the quality or variety of food consumed is often compromised<br />
before the quantity of food eaten. 10<br />
<strong>Food</strong> Availability: Meats, fish, fresh fruits and vegetables and whole grains are<br />
often limited in impoverished neighborhoods, and when available the variety<br />
and the quality of items tend to be significantly lower. 11,12 This lack of access<br />
to a variety of healthy foods limits the ability to make healthy choices.<br />
Overeating: <strong>Food</strong> insecure households often have periods where the<br />
availability of food is limited or uncertain creating episodes of food<br />
deprivation. Recent research has shown that food deprivation in humans and<br />
food restriction in children produces a tendency toward binge eating<br />
behaviors. 8 When food is available, individuals in food insecure households<br />
may overeat, increasing energy intake and overall weight gain.<br />
Physiological changes: Physiological changes can occur in the body as a<br />
result of periods of hunger and consumption of foods low in nutritional<br />
value. The body begins to compensate for periodic food and nutrition<br />
shortages by becoming more efficient at storing more calories as fat. 13<br />
The Los Angeles Alliance for a New Economy<br />
(<strong>LA</strong>ANE) has devised strategies to ensure that new<br />
developments offer improvements to communities (e.g.,<br />
good jobs and vital neighborhood services). 14 <strong>Food</strong><br />
pantries and soup kitchens also need to stock nutritious<br />
foods for individuals and families. Furthermore,<br />
accessible community farmers’ markets and community<br />
gardens can be used to increase the availability of fresh,<br />
seasonal produce in higher-risk communities.<br />
In order to reduce obesity among the food insecure,<br />
increasing opportunities for physical activity should be<br />
considered. The Task Force on Community Preventive<br />
Services review (www.thecommunityguide.org/pa/paajpm-recs.pdf.)<br />
on increasing physical activity in<br />
communities recommends six evidenced-based<br />
interventions. 15 At the community level, these include<br />
creating or enhancing access to safe places for physical<br />
activity (e.g. parks and bike paths), increasing physical<br />
13. Wardlaw, g.M. and Insel, P.M. (1996) Perspectives in Nutrition. Third Edition. New York,<br />
NY:WCB/McGraw-Hill.<br />
14. Accountable Development, Los Angeles Alliance for a New Economy.<br />
www.laane.org/ad/aboutad.html, visited February 25, 2004)<br />
15. Increasing physical activity. A report on recommendations of the Task Force on community<br />
Preventative Services. MMWR Recomm rep. October 26, 2001;50(RR-18):1-14.
on the web<br />
Los Angeles Collaborative for <strong>Health</strong>y Active Children is a collaborative<br />
made up of nearly 100 stakeholders including representatives of school<br />
districts, Head Start providers, health care providers, community-based and<br />
faith-based organizations, city and local government agencies, Los Angeles<br />
County Departments of <strong>Health</strong> Services and Parks and Recreation, and nonprofit<br />
organizations that work to reduce and prevent overweight and<br />
increase physical fitness among children and their families in Los Angeles<br />
County. This is with support from the County of Los Angeles DHS, Nutrition<br />
Program, and the University of California Cooperative Extension, Los Angeles,<br />
with funding from the US Department of Agriculture <strong>Food</strong> Stamp Program.<br />
www.lapublichealth.org/nut/<strong>LA</strong>COL<strong>LA</strong>B_Files/lacollab.htm<br />
INFO LINE Los Angeles is a nonprofit organization dedicated to helping<br />
people find and access health and human services in Los Angeles County.<br />
Phone: 800-339-6993 • <strong>Food</strong> Stamps, L.A. County <strong>Health</strong> & Nutrition<br />
hotline: 877-597-4777 www.infoline-la.org<br />
Los Angeles Regional <strong>Food</strong>bank collects and distributes donated food to<br />
a network of 1,000 charities located throughout Los Angeles County.<br />
Phone: 323-234-3030 or 877-NO-HUNGER www.lafightshunger.org<br />
California <strong>Food</strong> Policy Advocates is a private nonprofit organization<br />
dedicated to improving the health and well being of low-income Californians<br />
by increasing their access to nutritious, affordable, and safe food.<br />
www.cfpa.net<br />
The Los Angeles Coalition to End Hunger & Homelessness works to<br />
eliminate hunger and homelessness through public education, technical<br />
assistance, public policy analysis, advocacy, organizing, and community<br />
action. They publish the “Peoples’ Guide to Welfare, <strong>Health</strong> & Other<br />
Services” that provides practical information about how to get food, money<br />
and other help from government programs and community services.<br />
www.lacehh.org (The Peoples’ Guide: www.peoplesguide.org)<br />
Federal <strong>Food</strong> Programs<br />
behavior activity through social support, utilizing<br />
individually-adapted health behavior change programs,<br />
increasing physical activity in school-based physical<br />
education, promoting physical activity in communitywide<br />
campaigns, and using point-of-decision prompts to<br />
increase physical activity.<br />
Ongoing monitoring of food insecurity along with<br />
research about its causes and consequences are necessary<br />
to ensure a healthy and well-nourished population.<br />
Studies to evaluate changes in conditions that are<br />
related to poor health and nutrition as well as food<br />
insecurity (e.g., food policies in schools, community<br />
food resources) are also important as efforts to address<br />
these public health problems move forward.<br />
16. Los Angeles County: A profile of poverty, hunger & food assistance. June 2003. California<br />
<strong>Food</strong> Policy Advocates; San Francisco: CA.<br />
17. 2002/2003 Free/Reduced Meals Information: All Schools Reported & 2002-03 County Profile<br />
for California School Nutrition Programs (preliminary results). Nutrition Services Division,<br />
California Department of Education.<br />
18. Los Angeles County: A profile of poverty, hunger & food assistance. June 2003. California<br />
<strong>Food</strong> Policy Advocates; San Francisco: CA.<br />
19. Gleason, P. & Suitor, C. (2001). Children’s Diets in the Mid-1990s: Dietary Intake and Its<br />
Relationship with School Meal Participation. Alexandria, VA: U.S. Department of Agriculture,<br />
<strong>Food</strong> and Nutrition Service, Office of Analysis, Nutrition and Evaluation.<br />
http://www.fns.usda.gov/oane/MENU/Published/CNP/FILES/ChilDiet.pdf<br />
20. Meyers, A.F., Sampson, A.E., Weitzman, M., Rogers, M.L., & Kayne, H. (1989). School<br />
Breakfast Program and school performance. American Journal of Diseases and Children<br />
143(10), 1234-1239.<br />
21. Murphy, J.M., Pagano, M.E., Nachmani, J., Sperling, P., Kane, S., & Kleinman, R.E.<br />
(1998). The relationship of school breakfast to psychosocial and academic functioning. Archives<br />
of Pediatrics & Adolescent Medicine 152(9), 899-907. Abstract available at:<br />
http://archpedi.ama-assn.org/issues/v152n9/abs/pnu7508.html<br />
22. Murphy, J.M. & Kleinman, R.E. in collaboration with Project Bread and Boston Public<br />
Schools. (2000). “Study Shows Link Between School Breakfast and Academic Achievement.”<br />
Summary available at: http://www.projectbread.org/MCHI/mghbreakfaststudy.htm<br />
The federal <strong>Food</strong> Stamp Program, School and Community Nutrition Programs, Special Supplemental Program for Women, Infants and Children (WIC), and the Child<br />
and Adult Care <strong>Food</strong> Program are aimed at improving the nutrition, well-being and food security of in need Americans. Of these programs, WIC is the most utilized in<br />
Los Angeles County with 99% of the eligible individuals receiving benefits. 16 Although the Child and Adult Care <strong>Food</strong> Program utilization has increased nationally,<br />
local data is not available. The remaining programs are significantly underutilized in the county due to access barriers as described below.<br />
<strong>Food</strong> Stamp Program: According to recent USDA estimates, the program reaches only approximately half of those who may be eligible across Los Angeles County.<br />
Recent legislation reduced several barriers to program utilization, but further food stamp reform needs to be implemented. For example, partnerships with schools,<br />
community and faith based organizations should be enlarged and formalized. Efforts should also be made to assist working families by extending office hours into<br />
the early evenings. Although the <strong>Food</strong> Stamp Program helps to improve food security, the average benefit of $84 per month should be increased in an urban setting<br />
like Los Angeles County, where the high cost of living causes additional hardship.<br />
School & Community Nutrition Programs: The School Breakfast and Lunch Programs are designed to provide children living below 130% FPL free meals, and those<br />
above 130%, but below 185% FPL meals, at a reduced price. Approximately 1,058,000 children in Los Angeles County are eligible to receive free or reduced priced<br />
school meals. Although approximately 70% of those children are participating in the National School Lunch Program, less than 30% are participating in the School<br />
Breakfast Program. 17 This results in an estimated $174,383,000 per year of lost federal resources. 17 For information on increasing breakfast opportunities please<br />
refer to the Los Angeles Collaborative for <strong>Health</strong>y Active Children brief at www.lapublichealth.org/nut/<strong>LA</strong>COL<strong>LA</strong>B_Files/lacollab.htm<br />
Summer <strong>Food</strong> Program: The Summer <strong>Food</strong> Program helps children obtain food when school is out. Of the 1,252,033 children eligible to receive Summer <strong>Food</strong><br />
meals, only 310,598 are being fed. 18 Increasing program utilization can help to reduce food insecurity among children as well as improve nutritional intake and<br />
improve school performance. 19,20,21,22
L. A. County Board of Supervisors<br />
Gloria Molina, First District<br />
Yvonne Brathwaite Burke, Second District<br />
Zev Yaroslavsky, Third District<br />
Don Knabe, Fourth District<br />
Michael D. Antonovich, Fifth District<br />
Los Angeles County<br />
Department of <strong>Health</strong> Services<br />
313 North Figueroa Street, Room 127<br />
Los Angeles, CA 90012<br />
213-240-7785<br />
The Los Angeles County <strong>Health</strong> Survey is a periodic, population-based telephone survey that collects information on sociodemographic characteristics,<br />
health status, health behaviors, and access to health services among adults and children in the county. The 2002–2003 survey collected information on a<br />
random sample of 8,167 adults and 5,995 children. Interviews were offered in English, Spanish, Cantonese, Mandarin, Korean, and Vietnamese.<br />
The most recent survey was supported by grants from First 5 <strong>LA</strong>, the California Department of <strong>Health</strong> Services through grants to the Family <strong>Health</strong>,Tobacco<br />
Control and Prevention, and Alcohol and Drug Programs, and the Public <strong>Health</strong> Response and Bioterrorism Preparedness federal grant. The survey was<br />
conducted for the Los Angeles County Department of <strong>Health</strong> Services between October 2002 and March 2003 by Field Research Corporation.<br />
L. A. County Department of <strong>Health</strong> Services<br />
Thomas L. Garthwaite, MD<br />
Director and Chief Medical Officer<br />
Jonathan Fielding, MD, MPH<br />
Director of Public <strong>Health</strong> and <strong>Health</strong> Officer<br />
For additional information about the<br />
L.A. Survey: www.lapublichealth.org/ha<br />
Acknowledgements<br />
Paul Simon, MD, MPH, Director, <strong>Health</strong> Assessment & Epidemiology;<br />
Cheryl Wold, MPH, Chief, <strong>Health</strong> Assessment Unit;<br />
<strong>Health</strong> Assessment Unit Staff: Curtis Croker, MPH; Benedict Lee,<br />
PhD; Amy S. Lightstone, MPH; Gigi Mathew, DrPH; Wazim Narain,<br />
MPH; Cynthia Recio; Zhiwei (Waley) Zeng, MD, MPH<br />
We are grateful to Valerie Ruelas, M.S.W., L.C.S.W. for<br />
researching and co-authoring this report.<br />
Special thanks to Johanna Asarian-Anderson, MPH, RD; Cynthia<br />
Harding, MPH; Wendy Schiffer, MSPH; and Anna Long, PhD, MPH;<br />
for their contributions to this report.<br />
Presorted<br />
Standard<br />
U.S. Postage<br />
PAID<br />
Los Angeles, CA<br />
Permit No. 32365