Level and distrortion in digital broadcasting - EBU Technical
Level and distrortion in digital broadcasting - EBU Technical
Level and distrortion in digital broadcasting - EBU Technical

You also want an ePaper? Increase the reach of your titles
YUMPU automatically turns print PDFs into web optimized ePapers that Google loves.
AUDIO LEVELS<br />
<strong>Level</strong> <strong>and</strong><br />
Distortion <strong>in</strong> <strong>digital</strong> broadcast<strong>in</strong>g<br />
Thomas Lund<br />
TC Electronic A/S<br />
CD master<strong>in</strong>g – the most seasoned <strong>digital</strong> audio discipl<strong>in</strong>e – has turned <strong>in</strong>to a loudness war<br />
rather than a quest for gett<strong>in</strong>g decent audio quality out of a potentially well-sound<strong>in</strong>g media.<br />
Maximum loudness is also becom<strong>in</strong>g a goal <strong>in</strong> itself <strong>in</strong> new movies, so that film operators are<br />
hav<strong>in</strong>g to turn down the replay level to avoid compla<strong>in</strong>ts from the audience.<br />
In general, when audio normalization is based on peak-level detection, material with narrow<br />
dynamic range ends up the loudest. CD production not only relies on a peak-level measure<br />
(i.e. measurement scheme), it relies on a particularly bad <strong>and</strong> simplistic one, allow<strong>in</strong>g<br />
massive amounts of distortion to be generated downstream of the studio <strong>in</strong> data-reduction<br />
systems <strong>and</strong> consumer equipment.<br />
The purpose of this article is to justify <strong>and</strong> recommend more fitt<strong>in</strong>g ways of measur<strong>in</strong>g <strong>and</strong><br />
controll<strong>in</strong>g the audio level <strong>in</strong> <strong>digital</strong> broadcast<strong>in</strong>g than look<strong>in</strong>g at isolated samples or quasipeak<br />
levels. The new ITU-R BS.1770 st<strong>and</strong>ard, specify<strong>in</strong>g long-term loudness <strong>and</strong> peak-level<br />
detection, is evaluated <strong>and</strong> a centre of gravity approach to loudness control is suggested.<br />
Metadata associated with Dolby AC3 is shown to be <strong>in</strong>sufficient at tackl<strong>in</strong>g the level <strong>and</strong><br />
distortion issues across broadcast platforms, while legitimate control practices may be<br />
derived more cheaply <strong>and</strong> without ambiguity us<strong>in</strong>g statistical<br />
descriptors <strong>and</strong> real-time meter<strong>in</strong>g derived from BS.1770.<br />
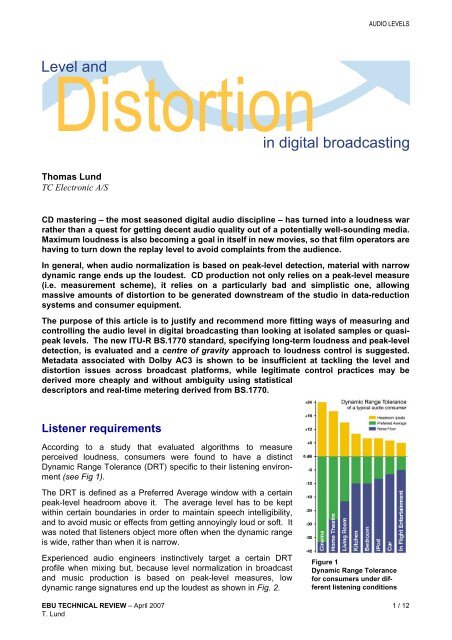
Listener requirements<br />
Accord<strong>in</strong>g to a study that evaluated algorithms to measure<br />
perceived loudness, consumers were found to have a dist<strong>in</strong>ct<br />
Dynamic Range Tolerance (DRT) specific to their listen<strong>in</strong>g environment<br />
(see Fig 1).<br />
The DRT is def<strong>in</strong>ed as a Preferred Average w<strong>in</strong>dow with a certa<strong>in</strong><br />
peak-level headroom above it. The average level has to be kept<br />
with<strong>in</strong> certa<strong>in</strong> boundaries <strong>in</strong> order to ma<strong>in</strong>ta<strong>in</strong> speech <strong>in</strong>telligibility,<br />
<strong>and</strong> to avoid music or effects from gett<strong>in</strong>g annoy<strong>in</strong>gly loud or soft. It<br />
was noted that listeners object more often when the dynamic range<br />
is wide, rather than when it is narrow.<br />
Experienced audio eng<strong>in</strong>eers <strong>in</strong>st<strong>in</strong>ctively target a certa<strong>in</strong> DRT<br />
profile when mix<strong>in</strong>g but, because level normalization <strong>in</strong> broadcast<br />
<strong>and</strong> music production is based on peak-level measures, low<br />
dynamic range signatures end up the loudest as shown <strong>in</strong> Fig. 2.<br />
Figure 1<br />
Dynamic Range Tolerance<br />
for consumers under different<br />
listen<strong>in</strong>g conditions<br />
<strong>EBU</strong> TECHNICAL REVIEW – April 2007 1 / 12<br />
T. Lund
Eng<strong>in</strong>eers therefore learn to “move right” <strong>in</strong> the diagram, go<strong>in</strong>g for<br />
ever-decreas<strong>in</strong>g dynamic range. The music <strong>in</strong>dustry is far to the<br />
right by now, beyond “In Flight Enterta<strong>in</strong>ment” <strong>in</strong> the illustration.<br />
Digital peak level<br />
When the first <strong>digital</strong> mass media – the CD – was <strong>in</strong>troduced,<br />
analogue tapes were generally used for production. Dur<strong>in</strong>g<br />
master<strong>in</strong>g, the sound was passed through analogue process<strong>in</strong>g <strong>and</strong><br />
eventually converted to <strong>digital</strong>, where the level was read sample-bysample<br />
straight out of the AD converter. Under such circumstances,<br />
sample detection was a reliable <strong>in</strong>dicator of peak level.<br />
Today, with <strong>digital</strong> processors manipulat<strong>in</strong>g the samples without any<br />
respect for the sampl<strong>in</strong>g theorem, the situation is very different, but<br />
the way we measure the level has rema<strong>in</strong>ed the same. Sample<br />
detection has even spread to other areas, such as broadcast <strong>and</strong><br />
film – all now rely<strong>in</strong>g on a simplistic <strong>and</strong> easily-fooled peak-level<br />
measurement.<br />
Figure 3<br />
Digital (red dots) vs. Analogue<br />
level (black l<strong>in</strong>e)<br />
In this article, the<br />
result<strong>in</strong>g reconstructed or re-sampled true-peak level will be<br />
called <strong>in</strong>tr<strong>in</strong>sic level, <strong>and</strong> when it is above Full Scale (with<br />
ideal reconstruction), it will be referred to as “0 dBFS+”. A<br />
<strong>digital</strong> level meter show<strong>in</strong>g the max. sample level will be<br />
called a Digital Sample Meter, while a meter show<strong>in</strong>g <strong>in</strong>tr<strong>in</strong>sic<br />
level will be called a Digital Signal Meter.<br />
Distortion<br />
Distortion is the price we pay for try<strong>in</strong>g to set the listener’s<br />
level control through the use of compression, limit<strong>in</strong>g <strong>and</strong><br />
clipp<strong>in</strong>g. However, only some of the deterioration may<br />
AUDIO LEVELS<br />
Figure 2<br />
Peak level normalization<br />
means that narrow dynamic<br />
range material gets loud<br />
Even the simplest of waveforms, the s<strong>in</strong>e wave, can be<br />
constructed <strong>in</strong> ways which cause analogue peaks not to align<br />
with <strong>digital</strong> peaks represent<strong>in</strong>g the same signal (see Fig 3).<br />
The analogue level of a s<strong>in</strong>e wave at f s/6 can be up to<br />
1.25 dB above the peak level <strong>in</strong> the <strong>digital</strong> doma<strong>in</strong>, while at f s /<br />
4 the discrepancy can be up to 3 dB.<br />
Put differently, s<strong>in</strong>e waves may need a DA conversion headroom<br />
of 3 dB for distortion-free reproduction <strong>in</strong> a l<strong>in</strong>ear<br />
system such as CD, while other signals can be created <strong>in</strong> the<br />
<strong>digital</strong> doma<strong>in</strong> where a headroom of 6 dB or more is needed<br />
for reconstruction.<br />
A square wave can be constructed from <strong>in</strong>dividual cos<strong>in</strong>e<br />
components as shown <strong>in</strong> Fig 4. For each higher harmonic<br />
added, the peak magnitude decreases slightly. The effect of<br />
omitt<strong>in</strong>g the third harmonic of a (1, 3, 5) harmonic series is<br />
also illustrated. Note how the peak value is <strong>in</strong>creased<br />
substantially. This k<strong>in</strong>d of peak<strong>in</strong>g happens when clipp<strong>in</strong>g is<br />
performed <strong>in</strong> the <strong>digital</strong> doma<strong>in</strong> <strong>and</strong> a b<strong>and</strong>-stop filter is later<br />
applied.<br />
Figure 4<br />
When <strong>digital</strong> clipp<strong>in</strong>g is used,<br />
the peak level <strong>in</strong>creases with<br />
downstream low-pass filter<strong>in</strong>g<br />
<strong>EBU</strong> TECHNICAL REVIEW – April 2007 2 / 12<br />
T. Lund
AUDIO LEVELS<br />
currently be recognized <strong>in</strong> the studio; namely the dynamic distortion. Excessive level doesn’t show<br />
on the studio meters, <strong>and</strong> isn’t taken <strong>in</strong>to account before the signal goes through a reproduction<br />
cha<strong>in</strong>.<br />
Therefore, an additional penalty is added to an already compromised signal: unpredictable reproduction<br />
due to exhausted headroom <strong>in</strong> DA converters, sample-rate converters <strong>and</strong> data-reduction<br />
systems.<br />
In previous papers [1][2][3][4], it has been shown how the 0 dBFS+ level generates massive<br />
amounts of distortion <strong>in</strong> CD players <strong>and</strong> data-reduction systems, <strong>and</strong> with the Sample Meter way of<br />
detect<strong>in</strong>g the level, the offend<strong>in</strong>g signals are not recognized. A typical way of generat<strong>in</strong>g the<br />
0 dBFS+ level is by clipp<strong>in</strong>g <strong>in</strong> the <strong>digital</strong> doma<strong>in</strong> <strong>and</strong> afterwards attenuat<strong>in</strong>g the signal by a fraction<br />
of a dB, so the abuse rema<strong>in</strong>s undetected by a Sample Meter.<br />
A <strong>digital</strong> square wave with its steep slopes, sharp edges <strong>and</strong> flat top does not fulfil the sampl<strong>in</strong>g<br />
theorem as expla<strong>in</strong>ed <strong>in</strong> Fig. 4. The results are therefore alias<strong>in</strong>g – a perceptually unpleasant artefact<br />
– <strong>and</strong>, if the clipp<strong>in</strong>g happens close to Full Scale, peaks of 0 dBFS+. Overly fast dynamics<br />
processors can also generate various amounts of alias distortion, so a familiar name – such as a<br />
compressor or limiter – is no guarantee aga<strong>in</strong>st <strong>in</strong>visible pollution of the signal <strong>in</strong> ways that analogue<br />
processors would not have suffered.<br />
Distortion <strong>in</strong> CD players<br />
While test<strong>in</strong>g a selection of older <strong>and</strong> newer CD players, we<br />
didn’t f<strong>in</strong>d a s<strong>in</strong>gle one that doesn’t significantly distort when<br />
subjected to 0 dBFS+ signals (see Fig. 5). When the <strong>in</strong>tr<strong>in</strong>sic<br />
level reaches +3 dBFS, most players distort more than 10%.<br />
Many of them also display a prolong<strong>in</strong>g effect: they latch-up,<br />
<strong>and</strong> take a little while to get out of distortion mode aga<strong>in</strong>,<br />
mean<strong>in</strong>g that distortion will l<strong>in</strong>ger for a period of time after a<br />
peak has occurred.<br />
For a presumably l<strong>in</strong>ear system like CD, we used a simple<br />
subtractive method to listen to these artefacts (Fig. 6).<br />
You may listen to examples of these artefacts by follow<strong>in</strong>g<br />
this l<strong>in</strong>k: http://www.tcelectronic.com/<strong>EBU</strong><strong>Technical</strong>Review<br />
There is a good reason why music lovers favour orig<strong>in</strong>al CD<br />
releases rather than re-mastered ones. The recent detrimental<br />
use of limit<strong>in</strong>g, clipp<strong>in</strong>g <strong>and</strong> loudness optimization on<br />
CD re-releases outweigh the positive effect of all our better<br />
converters <strong>and</strong> high-resolution processors comb<strong>in</strong>ed. Th<strong>in</strong>k<br />
about it: mixes captured with non-over-sampled 14-bit<br />
converters, brick-wall analogue filters <strong>and</strong> a L/R tim<strong>in</strong>g offset<br />
of one sample (Sony F1) sound better than new pop tracks.<br />
Distortion <strong>in</strong> data reduction<br />
Most new audio delivery systems, <strong>in</strong>clud<strong>in</strong>g <strong>digital</strong> broadcast<strong>in</strong>g,<br />
make use of perceptually-based data-reduction<br />
systems. Inside these codecs, the signal is filtered <strong>and</strong> quantized,<br />
often with quite narrowb<strong>and</strong> filters, so they would likely<br />
be sensitive to 0 dBFS+ level if special precautions were not<br />
taken <strong>in</strong> the design.<br />
Figure 5<br />
S<strong>in</strong>e waves reproduced by a<br />
NAD512 CD player, analogue out<br />
measured with LeCroy 9350A:<br />
Black curve: Intr<strong>in</strong>sic level =<br />
0dBFS<br />
Red curve: Intr<strong>in</strong>sic level =<br />
+3 dBFS<br />
Blue l<strong>in</strong>e: Sample position for red<br />
curve (0 dBFS)<br />
Figure 6<br />
Listen<strong>in</strong>g for headroom problems<br />
<strong>in</strong> CD players:<br />
Commercial CD is red, test CD is<br />
white;<br />
CD player (DUT) is shown as a<br />
square box<br />
<strong>EBU</strong> TECHNICAL REVIEW – April 2007 3 / 12<br />
T. Lund
AUDIO LEVELS<br />
In order to <strong>in</strong>vestigate the <strong>in</strong>fluence of different encod<strong>in</strong>g sett<strong>in</strong>gs, various comb<strong>in</strong>ations of cod<strong>in</strong>g<br />
algorithms, data rates <strong>and</strong> cod<strong>in</strong>g modes have also been tested. The test signals used were<br />
excerpts from some typical off-the-shelf CDs known to conta<strong>in</strong> 0 dBFS+ level. It was noticed that<br />
the peak level <strong>in</strong>deed rises when apply<strong>in</strong>g perceptual codecs to hot signals. Overshoots occur<br />
depend<strong>in</strong>g on the cod<strong>in</strong>g scheme <strong>and</strong> its parameters. The size of the overshoots corresponds well<br />
with the encoded data rate, <strong>in</strong> that the lower data rates generate higher output peak values than the<br />
higher data rates. MP3 encod<strong>in</strong>gs at 128 kbit/s should for <strong>in</strong>stance stay below –5 dBFS sample<br />
peak <strong>in</strong> order not to get exhausted frequently.<br />
The evaluation of data-reduction codecs was recently complemented by M/S listen<strong>in</strong>g tests.<br />
Because data reduction isn’t a l<strong>in</strong>ear process, the leveltest<strong>in</strong>g<br />
procedure used with CD players can’t be directly<br />
applied. The method used <strong>in</strong>stead is shown <strong>in</strong> Fig. 7.<br />
It was evident how MP3 <strong>and</strong> AAC tracks at 128 kbit/s sacrifice<br />
imag<strong>in</strong>g <strong>in</strong> general, <strong>and</strong> they clip audibly when subjected<br />
to 0 dBFS+ level. Data-reduction listen<strong>in</strong>g examples are also<br />
available if you follow the l<strong>in</strong>k given above for CD player<br />
distortion examples.<br />
It will be apparent that iTunes encod<strong>in</strong>g at default sett<strong>in</strong>gs<br />
ought not to be described as stereo. “Mono with side effects”<br />
would be more appropriate. The author really only has two<br />
th<strong>in</strong>gs aga<strong>in</strong>st his iPod: the sound is too compromised at its<br />
default data rate, which is the same used for Music Store<br />
Figure 7<br />
AAC <strong>and</strong> MP3 codec M <strong>and</strong> S listen<strong>in</strong>g<br />
tests<br />
Upper draw<strong>in</strong>g shows normal level<br />
encod<strong>in</strong>g<br />
Lower draw<strong>in</strong>g shows attenuated<br />
encod<strong>in</strong>g<br />
downloads; <strong>and</strong> iTunes attaches an “Explicit Language” warn<strong>in</strong>g to Always Look On the Bright Side<br />
of Life.<br />
In conclusion, the default sett<strong>in</strong>gs <strong>in</strong> Apple iTunes <strong>and</strong> other low-bitrate music systems lead to image<br />
distortion at any level, comb<strong>in</strong>ed with glitches <strong>and</strong> extra distortion when the level is pushed <strong>in</strong>to the<br />
0 dBFS+ zone. If the consequence is early listener fatigue, then pop CDs mastered with<strong>in</strong> the past<br />
10 years have long-term survival odds stacked aga<strong>in</strong>st them.<br />
Music eng<strong>in</strong>eers should therefore listen through an encode-decode signal path when master<strong>in</strong>g, like<br />
film eng<strong>in</strong>eers have been do<strong>in</strong>g for years with AC3. Data reduction isn’t a free lunch, <strong>and</strong> it won’t be<br />
for <strong>digital</strong> broadcast either. The behaviour of data-reduction systems should give reasons for<br />
concern, because broadcast stations typically rip music CDs <strong>and</strong> transfer them data reduced to a<br />
server on entry, thereby end<strong>in</strong>g up with audio conta<strong>in</strong><strong>in</strong>g distortion <strong>in</strong> their archives.<br />
A brief history of “ever louder”<br />
1900-1950 – Mechanical record<strong>in</strong>g <strong>and</strong> reproduction led to favour<strong>in</strong>g Brass sections on popular record<strong>in</strong>gs,<br />
<strong>and</strong> later, massive str<strong>in</strong>g sections.<br />
1940-1970 – Juke boxes had fixed ga<strong>in</strong>, so varigroove 45rpm record<strong>in</strong>gs resulted <strong>in</strong> maximum impact.<br />
1950 to date – US AM radio stations have a limited statutory ERP, but found that they could extend their<br />
effective coverage area (<strong>and</strong> thus advertis<strong>in</strong>g <strong>in</strong>come) by <strong>in</strong>creas<strong>in</strong>g the apparent modulation us<strong>in</strong>g signal<br />
process<strong>in</strong>g.<br />
2010 predictions – Digital Radio has no need to restrict the dynamic range at all, <strong>and</strong> FSD will always be<br />
FSD. However, music from the 1950s onwards is very popular <strong>and</strong> so, <strong>in</strong> order to quickly recognise such a<br />
themed Radio station, software versions of the old signal processors are used.<br />
Madonna produces an album download consist<strong>in</strong>g entirely of square-waves, but process<strong>in</strong>g downstream is<br />
found to actually reduce the loudness.<br />
Dr John Emmett,<br />
Chairman of P/AGA<br />
(<strong>EBU</strong> Advisory Group on Production Audio)<br />
<strong>EBU</strong> TECHNICAL REVIEW – April 2007 4 / 12<br />
T. Lund
Distortion <strong>in</strong> sample-rate conversion<br />
All types of real-time re-samplers are prone to add distortion<br />
to 0 dBFS+ signals, unless they <strong>in</strong>corporate limiters – which<br />
none of the currently-available ASRC (Audio SRC) chips do.<br />
See the example <strong>in</strong> Fig. 8.<br />
Studios <strong>and</strong> broadcast stations often employ sample-rate<br />
converters or asynchronous routers. If distortion is to be<br />
avoided, CDs need to be attenuated before rate conversion<br />
or rout<strong>in</strong>g. This wouldn’t have been so needed, had the<br />
music <strong>in</strong>dustry followed the <strong>EBU</strong> R89 <strong>digital</strong>-delivery specification,<br />
call<strong>in</strong>g for sample peaks below –3 dBFS.<br />
<strong>Level</strong> meters<br />
AUDIO LEVELS<br />
The <strong>in</strong>sufficient level control <strong>in</strong> music CD production causes distortion to develop several places<br />
downstream of the studio. Unfortunately, there is still a trend towards more <strong>and</strong> more level maximization<br />
<strong>and</strong> <strong>digital</strong>-doma<strong>in</strong> clipp<strong>in</strong>g on new CDs <strong>and</strong> commercials [1][2][3][4].<br />
All pro <strong>and</strong> consumer equipment should therefore be able to process <strong>and</strong> h<strong>and</strong>le 0 dBFS+ audio <strong>in</strong> a<br />
rational way. At the broadcast station, a better way of look<strong>in</strong>g at level is an important part of the<br />
solution. It won’t make the alias distortion go away, but at least level jumps <strong>and</strong> extra distortion may<br />
be avoided.<br />
Sample based meters are cheap to implement <strong>and</strong> are currently widely used, but tell little about<br />
loudness, <strong>and</strong> are easy to fool. Max. sample detection is the general rule <strong>in</strong> <strong>digital</strong> mixers <strong>and</strong><br />
DAWs. The side effect of us<strong>in</strong>g such a simplistic measure has become clear over the last decade,<br />
<strong>and</strong> CD music production st<strong>and</strong>s as a monument to its deficiency. Sample-based peak meters<br />
require a headroom of at least 3 dB <strong>in</strong> order to prevent downstream distortion [3][4].<br />
Quasi-peak level meters conform<strong>in</strong>g to IEC 268-18 are also peak oriented, <strong>and</strong> therefore favour lowdynamic-range<br />
material when used unconsciously for normalization. The headroom needed to stay<br />
clear of distortion is 8-9 dB. However, <strong>in</strong> recent <strong>in</strong>vestigations we found this type of meter to be less<br />
of an open <strong>in</strong>vitation to clipp<strong>in</strong>g than sample-peak meters.<br />
The only type of st<strong>and</strong>ard-level <strong>in</strong>strument that does not display some sort of peak level is the VU<br />
meter. Though developed for another era, this k<strong>in</strong>d of meter is arguably better at present<strong>in</strong>g an<br />
audio segment’s centre of gravity. However, a VU meter is not perceptually optimized, or ideal for<br />
look<strong>in</strong>g at audio with markedly different dynamic-range signatures.<br />
AAC (MPEG) Advanced Audio Cod<strong>in</strong>g<br />
AD Analogue-to-Digital<br />
ASRC Asynchronous Sample-Rate Converter<br />
CD A music album on a CD-A carrier at 16-bit<br />
41.1 kHz<br />
BLV Between Listener Variability<br />
CLM Consistency Loudness Measure<br />
DA Digital-to-Analogue<br />
DAW Digital Audio Workstation<br />
DRC Dynamic Range Control<br />
Abbreviations<br />
Figure 8<br />
S<strong>in</strong>e wave at +0.7 dBFS through<br />
SRC.<br />
CS8420 re-sampl<strong>in</strong>g from 44.1 to<br />
48 kHz.<br />
Note the tone at 5 5 kHz <strong>and</strong> the<br />
distortion products<br />
DRT Dynamic Range Tolerance<br />
FSD Full-Scale Deflection<br />
LU Loudness Unit<br />
MP3 Formerly known as “MPEG Layer II”<br />
PPM Peak Programme Meter<br />
SLM St<strong>and</strong>ard Loudness Measure<br />
SPL Sound Pressure <strong>Level</strong><br />
SRC Sample-Rate Converter<br />
VU (Audio) Volume Units<br />
WLV With<strong>in</strong> Listener Variability<br />
<strong>EBU</strong> TECHNICAL REVIEW – April 2007 5 / 12<br />
T. Lund
Loudness meters <strong>and</strong> ITU-R BS.1770<br />
Unlike electrical level, loudness is subjective <strong>and</strong><br />
listeners weigh its most important factors – SPL,<br />
Frequency contents <strong>and</strong> Duration – differently. In<br />
search of an “objective” loudness measure, a certa<strong>in</strong><br />
Between Listener Variability (BLV) <strong>and</strong> With<strong>in</strong> Listener<br />
Variability (WLV) must be accepted, mean<strong>in</strong>g that<br />
even loudness assessments by the same person are<br />
only consistent to some extent, <strong>and</strong> depends on the<br />
time of day, his/her mood etc. BLV adds further to the<br />
blur, when sex, culture, age etc. are <strong>in</strong>troduced as<br />
variables. In the real world, unknown reproduction<br />
systems, of course, add even more blur.<br />
Because of the variations, a generic loudness<br />
measure is only mean<strong>in</strong>gful when it is based on large<br />
subjective reference tests <strong>and</strong> solid statistics.<br />
Together with McGill University <strong>in</strong> Montreal, TC Electronic<br />
has undertaken extensive loudness model<br />
<strong>in</strong>vestigations <strong>and</strong> evaluations (see Fig. 9). Each th<strong>in</strong><br />
blue l<strong>in</strong>e represents hundreds of human judgments of<br />
Loudness algorithms<br />
AUDIO LEVELS<br />
A total of ten commercially developed<br />
monophonic loudness meters/algorithms<br />
were submitted by seven different proponents<br />
for evaluation at the Audio Perception<br />
Lab of the Communications Research<br />
Centre, Canada.<br />
In addition, Soulodre contributed two additional<br />
basic loudness algorithms to serve<br />
as a performance basel<strong>in</strong>e. These two<br />
objective measures consisted of a simple<br />
frequency-weight<strong>in</strong>g function, followed by<br />
an RMS measurement block.<br />
One of the two measures, Leq(RLB) uses<br />
a high-pass frequency weight<strong>in</strong>g curve<br />
referred to as the revised low-frequency<br />
B-curve (RLB). The other measure, Leq<br />
(Equivalent Sound <strong>Level</strong>), is simply an<br />
unweighted RMS measure.<br />
a particular audio segment; for <strong>in</strong>stance speech, guitar, yodell<strong>in</strong>g, pop music, a battle scene, etc. If<br />
Figure 9<br />
Evaluation of different Loudness Models us<strong>in</strong>g a wide range of broadcast audio material [5].<br />
Loudness models to the left are <strong>in</strong> better agreement with human listeners than models to the right of the<br />
chart.<br />
A red mark<strong>in</strong>g above the diagram <strong>in</strong>dicates if a particular loudness model was ever more than 6 dB off target.<br />
The number <strong>in</strong>side the red mark<strong>in</strong>g denotes how many audio segments were misjudged by this<br />
amount.<br />
<strong>EBU</strong> TECHNICAL REVIEW – April 2007 6 / 12<br />
T. Lund
AUDIO LEVELS<br />
many of the blue l<strong>in</strong>es occur at the top of the illustration, that particular loudness model is not do<strong>in</strong>g<br />
a very good job.<br />
The results denounce a couple of Leq measures – namely A <strong>and</strong> M weighted – as be<strong>in</strong>g trustworthy<br />
generic loudness measures. In fact, a quasi-peak meter showed better judgement of loudness than<br />
Leq(A) or Leq(M). Even used just for speech, Leq(A) is a poor choice [5][6][7], <strong>and</strong> it performs<br />
worse on music <strong>and</strong> effects. The mediocre performance of Leq(M) might be a reason why c<strong>in</strong>ema<br />
replay levels are currently out of control.<br />
An appropriate choice for a low complexity, generic measurement algorithm has been labelled<br />
Leq(RLB). Though it better describes loudness than a quasi-peak meter [5], its performance aga<strong>in</strong>st<br />
normal VU or slow VU has not yet been systematically tested.<br />
In 2006, ITU-R Work<strong>in</strong>g Party 6J drafted a new loudness <strong>and</strong> peak-level measure, BS.1770 [8].<br />
Concerns have been raised about the loudness part not be<strong>in</strong>g robust enough, because it will obviously<br />
be exploited where possible. However, with homogenous<br />
mono material, Leq(RLB) has been verified <strong>in</strong><br />
<strong>in</strong>dependent studies to be a relatively accurate measure [5].<br />
It therefore seemed justified to use Leq(RLB) as a basel<strong>in</strong>e<br />
measure for long-term loudness, as long as room for<br />
improvement was built <strong>in</strong>to the st<strong>and</strong>ard. However, despite<br />
be<strong>in</strong>g less verified, a stereo <strong>and</strong> multichannel annex us<strong>in</strong>g a<br />
revised weight<strong>in</strong>g filter, R2LB, made it <strong>in</strong>to the f<strong>in</strong>al st<strong>and</strong>ard.<br />
The multichannel extension, especially, should be used with<br />
great caution [2] until it has been properly verified. Different<br />
weight<strong>in</strong>g curves typically used with Leq measur<strong>in</strong>g are<br />
shown <strong>in</strong> Fig. 10.<br />
The other aspect of BS.1770, the algorithm to measure truepeak,<br />
is built on more solid ground. Inconsistent peak meter<br />
read<strong>in</strong>gs, unexpected overloads, distortion <strong>in</strong> data-reduced<br />
delivery <strong>and</strong> conversion etc. has been extensively described<br />
[1][2][3][4], so, <strong>in</strong> liaison with AES SC-02-01, an over-<br />
sampled true-peak level measure is <strong>in</strong>cluded with BS.1770. Depend<strong>in</strong>g on the over-sample ratio,<br />
different maximum under-read ratios can be anticipated, e.g. 0.7 dB at four times over-sampl<strong>in</strong>g.<br />
In conclusion, BS.1770 is an honourable attempt at specify<strong>in</strong>g loudness <strong>and</strong> peak level separately,<br />
<strong>in</strong>stead of the simplistic (sample peak) <strong>and</strong> mixed-up measures (quasi-peak) <strong>in</strong> use today.<br />
BS.1770-compliant meter<strong>in</strong>g<br />
Figure 10<br />
Weight<strong>in</strong>g filters used with Leq<br />
measures<br />
A weight<strong>in</strong>g: Red, RLB: Green,<br />
R2LB: Blue<br />
The BS.1770 measure may be presented to the user on a traditional real-time display with certa<strong>in</strong><br />
rise-<strong>and</strong>-fall times to be specified. The ITU-R BS.1771 draft covers this type of meter [9]. However,<br />
loudness control is not just a matter of absolute limits. Overly loud auditory events don’t have to last<br />
for long before we react or get annoyed.<br />
TC Electronic has conducted listen<strong>in</strong>g tests to design a precise loudness model suited for both<br />
short-term <strong>and</strong> long-term measurements on speech, music <strong>and</strong> effects [5][6]. We were concerned<br />
that describ<strong>in</strong>g the level variations of an entire programme us<strong>in</strong>g just one number was an oversimplification,<br />
<strong>and</strong> would not provide enough <strong>in</strong>formation about its broadcast suitability.<br />
To control loudness developments consistently over time, we believe the most transparent method<br />
would be to have the loudness history visualized already <strong>in</strong> production. A mix<strong>in</strong>g eng<strong>in</strong>eer or a journalist<br />
should be able to identify long-term as well as short-term loudness developments.<br />
An example of a meter show<strong>in</strong>g <strong>in</strong>stant loudness, history <strong>and</strong> long-term descriptors is shown <strong>in</strong><br />
Fig. 11. The OBS <strong>in</strong>dicator (top left) was used <strong>in</strong> our concept study to show a “possible problem”: for<br />
<strong>in</strong>stance, a channel completely dead, phase anomalies etc. It’s a prompt to make the user try<br />
<strong>EBU</strong> TECHNICAL REVIEW – April 2007 7 / 12<br />
T. Lund
another type of view such as stereo or 5.1<br />
bargraph meter.<br />
The loudness history can be set at, for <strong>in</strong>stance,<br />
one revolution per m<strong>in</strong>ute. The round display<br />
dist<strong>in</strong>guishes itself from a normal PPM or VU<br />
meter, mak<strong>in</strong>g a po<strong>in</strong>t that the measure is also<br />
different. Its angular read<strong>in</strong>g, like a watch, means<br />
that the numbers need not be visible. Reference<br />
loudness is at 12 o’clock <strong>and</strong> can be seen on<br />
even a small picture, for <strong>in</strong>stance a superimposed<br />
image.<br />
If only a long-term average number is displayed,<br />
local soft or loud events rema<strong>in</strong> undetected, <strong>and</strong><br />
real-time work is jeopardized. If only short-term<br />
loudness is displayed, a programme’s St<strong>and</strong>ard<br />
Loudness Measure (i.e. its centre of gravity) is<br />
unknown <strong>and</strong> therefore how well it fits with other<br />
programmes, <strong>and</strong> across a variety of broadcast<br />
platforms.<br />
For broadcast programm<strong>in</strong>g meant to be distributed<br />
over a number of platforms, it is fundamental<br />
to def<strong>in</strong>e its centre of gravity. With this centre<br />
po<strong>in</strong>t well def<strong>in</strong>ed, it is simple to transcode a given<br />
programme to any platform with a m<strong>in</strong>imum of process<strong>in</strong>g.<br />
Delivery specifications<br />
AUDIO LEVELS<br />
Figure 11<br />
Real-time Loudness meter show<strong>in</strong>g Current<br />
Loudness <strong>in</strong> the outer r<strong>in</strong>g, History <strong>in</strong> the<br />
“radar view” <strong>and</strong> Statistical descriptors at the<br />
bottom<br />
It has been suggested that programm<strong>in</strong>g should be referenced to the level of its dialogue, which to<br />
some extent works for film. However, this has bad consequences <strong>in</strong> broadcast, where mix<strong>in</strong>g<br />
aesthetics between programmes may vary significantly, where dialogue not always take centre<br />
stage, where any type of sound may be disturb<strong>in</strong>g, <strong>and</strong> where the consumer Dynamic Range Tolerance<br />
is lower. The sound of a phone r<strong>in</strong>g<strong>in</strong>g <strong>in</strong> a commercial, John Frusciante’s guitar, or a fight<strong>in</strong>g<br />
scene <strong>in</strong> Pirates of the Caribbean can all make some people reach for the remote, <strong>and</strong> should naturally<br />
have an <strong>in</strong>fluence on the loudness of a programme. Even if a station carries only news, documentaries<br />
or drama, it will still have accompany<strong>in</strong>g sounds that can be annoy<strong>in</strong>g.<br />
BS.1770 is an open st<strong>and</strong>ard for measur<strong>in</strong>g the peak level <strong>and</strong> loudness. It may be used to enable<br />
level offsets (long-term loudness) to correspond with real-time measur<strong>in</strong>g <strong>and</strong> correction (short-term<br />
loudness) across programme transitions, <strong>and</strong> across multiple broadcast platforms such as HD, SD,<br />
IP <strong>and</strong> iCast. For this to work, however, consistency has to be established between long-term <strong>and</strong><br />
short-term corrections.<br />
When all programm<strong>in</strong>g hits master control at the same St<strong>and</strong>ard Loudness Measure (SLM), on-l<strong>in</strong>e<br />
correction for the various platforms can be centred around this value, <strong>and</strong> be as gentle, transparent<br />
<strong>and</strong> foreseeable as possible (see Figs 12-14). Content with different dynamic-range signatures can<br />
be seamlessly mixed this way. Production, live <strong>and</strong> external content should be aimed at the HDTV<br />
dynamic-range signature, which is a little wider than what is used for today’s analogue TV delivery.<br />
The HDTV signature is automatically narrowed dur<strong>in</strong>g transmission to fit other broadcast platforms<br />
<strong>in</strong> a predictable way which is also transparent to a production eng<strong>in</strong>eer.<br />
Despite the improved loudness consistency enabled by us<strong>in</strong>g a centre of gravity anchor, HDTV<br />
should not be aimed at a wider dynamic range than requested by most consumers. For some<br />
stations, it may even be advantageous to use the SDTV dynamic-range signature for all HD delivery,<br />
with the possible exception of film. Long-term loudness normalization (level offsets) can be taken<br />
<strong>EBU</strong> TECHNICAL REVIEW – April 2007 8 / 12<br />
T. Lund
Figure 12<br />
Film to Broadcast<br />
Black arrows: <strong>Level</strong> offset<br />
Red arrows: Dynamics process<strong>in</strong>g<br />
AUDIO LEVELS<br />
care of dur<strong>in</strong>g <strong>in</strong>gest or <strong>in</strong>side a file server. Under the same off-l<strong>in</strong>e conditions, relevant statistical<br />
<strong>in</strong>formation other than the SLM may be derived.<br />
Studies of dialogue from broadcasts, films, music, commercials <strong>and</strong> sound effects have led to the<br />
conclusion that at least one more tell<strong>in</strong>g parameter should be used for programme-delivery specification,<br />
for <strong>in</strong>stance the Consistency Loudness Measure (CLM). CLM is a long-term statistical<br />
measure also rooted <strong>in</strong> BS.1770. It <strong>in</strong>dicates <strong>in</strong>tr<strong>in</strong>sic loudness variations with<strong>in</strong> a programme. A<br />
comb<strong>in</strong>ation of the SLM <strong>and</strong> the CLM is a superior broadcast-suitability predictor than a s<strong>in</strong>gle<br />
number such as, for <strong>in</strong>stance, Dialnorm.<br />
In the example of Fig. 11, the source is a hot pop track from CD, Madonna’s Hung Up. The current<br />
loudness is at +14 LU (outer r<strong>in</strong>g), the history is almost as loud (SLM=+13.5), <strong>and</strong> the consistency<br />
history shows very little variation (CLM=+14.8). It should be noted how the SLM <strong>and</strong> CLM numbers<br />
are directly operational. In the example, Hung Up would be broadcast-fit if offset by -13.5 dB. In this<br />
case, with a high positive CLM value, no further dynamics process<strong>in</strong>g is needed to transmit Hung Up<br />
to any broadcast platform.<br />
Film would typically have a negative CLM ... production material on target should read around “0” ...<br />
while a commercial, like <strong>in</strong> Fig. 13, would often have a positive CLM – but less extreme than hypercompressed<br />
pop music such as Hung Up.<br />
Metadata <strong>and</strong> end-listener level control<br />
Figure 13<br />
Commercial to Broadcast<br />
In DTV us<strong>in</strong>g Dolby AC3, extra <strong>in</strong>formation may be sent alongside the audio. Such <strong>in</strong>formation is<br />
known as “metadata” <strong>and</strong> is added before transmission at the broadcast station. AC3 metadata<br />
allows three end-listener level-control parameters to be set:<br />
Dialnorm adjusts the receiver’s level control. The closer this sett<strong>in</strong>g gets to 0 dBFS, the lower<br />
the reproduction level.<br />
L<strong>in</strong>e-mode DRC enables dynamic range restrictions with a wideb<strong>and</strong> boost be<strong>in</strong>g given to low<br />
levels, <strong>and</strong> compression be<strong>in</strong>g applied to high levels.<br />
RF-mode DRC does the same with additional level boosts <strong>and</strong> limit<strong>in</strong>g meant to be compatible<br />
with analogue TV.<br />
<strong>EBU</strong> TECHNICAL REVIEW – April 2007 9 / 12<br />
T. Lund
AUDIO LEVELS<br />
The DRC sett<strong>in</strong>gs specify a dynamic range reduction profile, with names such as “None”, “Speech”,<br />
“Music Light”, “Film St<strong>and</strong>ard” etc.<br />
The hope that decoders deployed <strong>in</strong>side consumer equipment would be able to restrict dynamic<br />
range appropriately at the end-listener has not been fulfilled, because AC3 is far from able to fill the<br />
gap between c<strong>in</strong>ema <strong>and</strong> iPod. With its wideb<strong>and</strong> design, pump<strong>in</strong>g <strong>and</strong> other artefacts already<br />
become notable at boost or cut ratios of 6 dB [2], with much more regulation be<strong>in</strong>g <strong>in</strong>dicated (see<br />
Fig. 1).<br />
Metadata only get used if they provide clear advantages without downsides. When benefits are not<br />
obvious, the extra work <strong>and</strong> equipment needed to create metadata, the extra latency, <strong>and</strong> the potential<br />
compatibility issues they will pose over time, work aga<strong>in</strong>st the concept. It’s no wonder why<br />
broadcasters are seek<strong>in</strong>g more effective methods to control loudness than bas<strong>in</strong>g a station on part<br />
of a solution for just one platform.<br />
To use AC3 metadata as the ma<strong>in</strong> level <strong>and</strong> range control, actually has further downsides. It is<br />
unpredictable how a consumer has his/her receiver set up, <strong>and</strong> the reproduction level can become a<br />
mess when metadata is miss<strong>in</strong>g or wrong. Acknowledg<strong>in</strong>g these problems, Dolby has <strong>in</strong>troduced a<br />
loudness control solution, Dolby Volume, for manufacturers of consumer equipment. Dolby Volume<br />
is s<strong>in</strong>gle-ended <strong>and</strong> doesn’t require metadata to function. If its complexity is high enough, it may<br />
completely disregard metadata <strong>and</strong> not worry about whether they are correct or not.<br />
S<strong>in</strong>gle-ended consumer control of loudness has been a long time com<strong>in</strong>g, but should be welcomed.<br />
Apple’s relatively simple solution <strong>in</strong> iTunes was among the first to offer an answer better than peaklevel<br />
normalization to the general public. With Dolby Volume, <strong>and</strong> other technologies on the horizon,<br />
we can f<strong>in</strong>ally hope to rebuke the loudness war <strong>in</strong> music <strong>and</strong> film production.<br />
With regard to broadcast, however, <strong>in</strong>tangible consumer process<strong>in</strong>g cannot be relied on. Metadata<br />
is one layer of extra unpredictability; s<strong>in</strong>gle-ended consumer process<strong>in</strong>g is another. Audio should<br />
therefore be adequately preconditioned at the station, <strong>and</strong> transmitted with fixed metadata to keep<br />
uncerta<strong>in</strong>ties at a m<strong>in</strong>imum. Fortunately, AC3 can work well without stations hav<strong>in</strong>g to go through<br />
the trouble of us<strong>in</strong>g more of its metadata extension than to signal changes between stereo <strong>and</strong> 5.1.<br />
Best practice<br />
Based on experiences from broadcasters around the world,<br />
consistent audio is best assured when aim<strong>in</strong>g HDTV transmissions<br />
at nearly the same dynamic-range signature as SDTV.<br />
The dynamic range should be only slightly wider, see Fig 14,<br />
with other platforms be<strong>in</strong>g fed <strong>and</strong> suitably processed from the<br />
HDTV stream. The widened dynamic range is made possible<br />
by centr<strong>in</strong>g all programm<strong>in</strong>g around a long-term loudness<br />
measure derived from ITU-R BS.1770 rather than the vary<strong>in</strong>g<br />
degrees of peak normalization used <strong>in</strong> broadcast<strong>in</strong>g today.<br />
Dur<strong>in</strong>g <strong>in</strong>gest or <strong>in</strong>side the server, programm<strong>in</strong>g is offset us<strong>in</strong>g<br />
the long-term St<strong>and</strong>ard Loudness Measure. If the Loudness<br />
Consistency of <strong>in</strong>gested material is not high enough, dynamics<br />
process<strong>in</strong>g is applied to comply with the HDTV dynamic range<br />
signature. Access to a BS.1770-based loudness meter should<br />
also be provided <strong>in</strong> production <strong>and</strong> edit<strong>in</strong>g. The new loudness<br />
measure has the advantage of be<strong>in</strong>g underst<strong>and</strong>able not only<br />
to audio experts, but to video editors, journalists <strong>and</strong> other nonspecialists<br />
as well.<br />
In master control <strong>and</strong> transmission, dynamic-range condition<strong>in</strong>g<br />
for the different platforms takes place. The HD dynamic-range<br />
Figure 14<br />
Suggested target dynamic<br />
range for different broadcast<br />
platforms. The Loudness target<br />
of –20 dB is used as an example<br />
<strong>EBU</strong> TECHNICAL REVIEW – April 2007 10 / 12<br />
T. Lund
AUDIO LEVELS<br />
signature has already been targeted dur<strong>in</strong>g production <strong>and</strong> <strong>in</strong>gest, so process<strong>in</strong>g for this platform<br />
only plays a role when errors have been made at previous stages. Audio condition<strong>in</strong>g for other platforms<br />
is performed automatically (Figs 12-14).<br />
For transmission where metadata is required, e.g. with Dolby AC3, the best practice is to keep Dialnorm,<br />
L<strong>in</strong>e-mode DRC <strong>and</strong> RF-mode DRC fixed at certa<strong>in</strong> values. With the gently widened dynamic<br />
range suggested here, Dialnorm should be set between –20 <strong>and</strong> –26 dBFS. A lower sett<strong>in</strong>g may<br />
generate more loudness at the end listener, but also with more wideb<strong>and</strong> process<strong>in</strong>g tak<strong>in</strong>g place.<br />
Therefore, it’s a sign of <strong>in</strong>adequate upstream level <strong>and</strong>/or process<strong>in</strong>g, if the Dialnorm number has to<br />
be lowered to keep loudness aligned with other stations. The DRC parameters too are set <strong>in</strong> a way<br />
not ask<strong>in</strong>g the impossible of the decode process<strong>in</strong>g. The most predictable results are obta<strong>in</strong>ed with<br />
L<strong>in</strong>e-mode DRC disabled (sett<strong>in</strong>g “None”). RF-mode DRC should also be disabled, or set to one of<br />
the gentle profiles, “Music Light” or “Film Light”.<br />
A content provider delivery specification should as a m<strong>in</strong>imum describe the required SLM, <strong>and</strong> the<br />
max peak level tolerated. Peak detection is based on over-sampl<strong>in</strong>g, <strong>and</strong> is typically set 10 to 14 dB<br />
above the SLM. If only a sample peak measure is available, which is the rule today, <strong>digital</strong> <strong>in</strong>gest<br />
<strong>and</strong> files transfer may be louder <strong>and</strong> more distorted than expected [4]. It is helpful for a content<br />
provider to also know a CLM target <strong>in</strong> order to underst<strong>and</strong> how much process<strong>in</strong>g can be expected<br />
dur<strong>in</strong>g delivery to various platforms.<br />
Conclusions<br />
The article has described an <strong>in</strong>creas<strong>in</strong>g level-maximization problem <strong>in</strong> music, commercial <strong>and</strong> film<br />
production – which causes distortion to be developed downstream of the studio, <strong>and</strong> also leads to<br />
unexpected level jumps <strong>in</strong> broadcasts. It has been demonstrated how a sample peak meter does<br />
not display the level reliably, <strong>and</strong> how peak-level normalization <strong>in</strong> general makes low dynamic-range<br />
material appear loud.<br />
A peak measure is therefore a poor guidel<strong>in</strong>e <strong>in</strong> <strong>digital</strong> broadcast<strong>in</strong>g, where content with different<br />
dynamic-range signatures is mixed, <strong>and</strong> more <strong>in</strong>telligent ways of measur<strong>in</strong>g <strong>and</strong> controll<strong>in</strong>g levels<br />
should be realized. In essence, a programme’s centre of gravity should be used as a guidel<strong>in</strong>e for<br />
level offsets, plus a dependable peak level measure to stay clear of distortion. It is important that the<br />
centre of gravity calculation takes all audio content <strong>in</strong>to account – speech, music <strong>and</strong> effects – <strong>and</strong><br />
that the peak measure is based on <strong>in</strong>tr<strong>in</strong>sic level rather than a sample-by-sample assessment.<br />
The new ITU-R BS.1770 st<strong>and</strong>ard may eventually fulfil both criteria. Its Leq(RLB) long-term<br />
measure for mono signals was verified <strong>in</strong> 2003-04 but, later, stereo <strong>and</strong> multi-channel extensions<br />
us<strong>in</strong>g a revised weight<strong>in</strong>g, Leq(R2LB), have not been confirmed <strong>in</strong> <strong>in</strong>dependent studies. At this<br />
po<strong>in</strong>t, the 5.1 annex should therefore only be considered an early draft.<br />
A centre of gravity number alone, however, cannot be regarded as a “loudness meter”, <strong>and</strong> therefore<br />
cannot express a programme’s broadcast suitability. The number must be complemented by at<br />
least one more descriptor, namely<br />
Thomas Lund started as a musician, drift<strong>in</strong>g<br />
<strong>in</strong>to audio eng<strong>in</strong>eer<strong>in</strong>g while study<strong>in</strong>g medic<strong>in</strong>e<br />
at the University of Aarhus <strong>in</strong> Denmark.<br />
For the past 10 years, he has been with TC<br />
Electronic <strong>in</strong> Denmark, where he currently<br />
holds the title of Program Manager.<br />
Mr Lund has written papers for Nordic<br />
organizations, the AES, SMPTE, NAB <strong>and</strong><br />
BCA. He has participated <strong>in</strong> peer review<br />
boards <strong>and</strong> taken part <strong>in</strong> various <strong>in</strong>ternational<br />
audio st<strong>and</strong>ardization activities.<br />
a consistency measure; <strong>and</strong>, for<br />
use <strong>in</strong> mix<strong>in</strong>g <strong>and</strong> live situations,<br />
compliant real-time meter<strong>in</strong>g.<br />
Neither of these essential factors<br />
were <strong>in</strong>vestigated <strong>in</strong> the st<strong>and</strong>ardization<br />
process, even though they<br />
were clearly part of the orig<strong>in</strong>al<br />
ITU question.<br />
Consequently, TC Electronic <strong>and</strong><br />
McGill University, have carried<br />
out additional listen<strong>in</strong>g tests <strong>and</strong><br />
experiments to extract short-term<br />
<strong>EBU</strong> TECHNICAL REVIEW – April 2007 11 / 12<br />
T. Lund
AUDIO LEVELS<br />
functionality from the BS.1770 measure, <strong>and</strong> to derive statistical descriptors more mean<strong>in</strong>gful than<br />
Dialnorm from the results.<br />
A multifaceted solution has been described, where a comb<strong>in</strong>ation of a real-time loudness meter <strong>and</strong><br />
statistical descriptors may be used to streaml<strong>in</strong>e content delivery, <strong>in</strong>gest, production <strong>and</strong> transmission<br />
across various platforms. With: (i) long-term adjustments be<strong>in</strong>g applicable <strong>in</strong>side a file server,<br />
(ii) a meter be<strong>in</strong>g readable by a person who is not an audio expert <strong>and</strong> (iii) an automatic trickle-down<br />
rout<strong>in</strong>e from HD to SD to IPTV be<strong>in</strong>g available dur<strong>in</strong>g transmission ... these solutions call for less<br />
time be<strong>in</strong>g spent per audio stream at the station. Dur<strong>in</strong>g delivery, fixed metadata may be used to<br />
keep consumer uncerta<strong>in</strong>ties <strong>and</strong> station workload at a m<strong>in</strong>imum, while <strong>digital</strong> transmission us<strong>in</strong>g<br />
the AC3 format is improved thanks to light be<strong>in</strong>g automatically shed on its bl<strong>in</strong>d angles.<br />
The extension of BS.1770 together with the procedures described <strong>in</strong> this article could help put an<br />
end to the <strong>digital</strong> production loudness war, <strong>and</strong> hopefully make the CD format its last casualty.<br />
References<br />
[1] S. Nielsen <strong>and</strong> T. Lund: Overload <strong>in</strong> Signal Conversion<br />
AES 23 conference, Copenhagen, Denmark, 2003.<br />
[2] T. Lund: Control of Loudness <strong>in</strong> Digital TV<br />
NAB BEC, Las Vegas, United States, April 2006.<br />
[3] T. Lund: Distortion to The People<br />
Tonmeistertagung 23, Leipzig, Germany, 2004. Paper A05.<br />
[4] T. Lund: Stop Count<strong>in</strong>g Samples<br />
AES 121 convention, San Francisco, United States, October 2006. Prepr<strong>in</strong>t 6972.<br />
[5] Skovenborg & Nielsen: Evaluation of Different Loudness Models with Music <strong>and</strong> Speech<br />
AES 117 convention, SFO, United States, 2004. Prepr<strong>in</strong>t 6234.<br />
[6] Skovenborg, Quesnel & Nielsen: Loudness Assessment of Music <strong>and</strong> Speech<br />
AES 116 convention, Berl<strong>in</strong>, Germany, 2004. Prepr<strong>in</strong>t 6143.<br />
[7] Brian C.J. Moore, Brian R. Glasberg <strong>and</strong> Michael A. Stone: Why Are Commercials so Loud?<br />
– Perception <strong>and</strong> Model<strong>in</strong>g of Amplitude-Compressed Speech<br />
JAES, no. 12, December 2003.<br />
[8] ITU-R, Draft BS.1770: Algorithms to measure audio programme loudness <strong>and</strong> true-peak<br />
level<br />
Geneva, Switzerl<strong>and</strong>, April 2006.<br />
[9] ITU-R, Draft BS.1771: Requirements for loudness <strong>and</strong> true-peak <strong>in</strong>dicat<strong>in</strong>g meters<br />
Geneva, Switzerl<strong>and</strong>, April 2006.<br />
<strong>EBU</strong> TECHNICAL REVIEW – April 2007 12 / 12<br />
T. Lund