Levelling and Loudness - in radio and television ... - EBU Technical
Levelling and Loudness - in radio and television ... - EBU Technical
Levelling and Loudness - in radio and television ... - EBU Technical

Create successful ePaper yourself
Turn your PDF publications into a flip-book with our unique Google optimized e-Paper software.
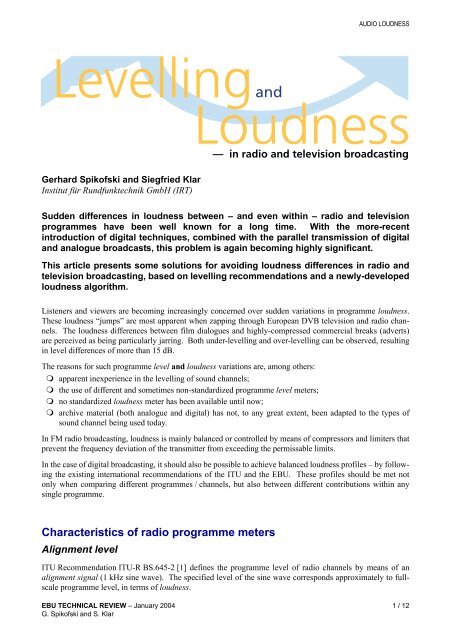
Gerhard Spikofski <strong>and</strong> Siegfried Klar<br />
Institut für Rundfunktechnik GmbH (IRT)<br />
AUDIO LOUDNESS<br />
<strong>Levell<strong>in</strong>g</strong> <strong>and</strong><br />
<strong>Loudness</strong><br />
Sudden differences <strong>in</strong> loudness between – <strong>and</strong> even with<strong>in</strong> – <strong>radio</strong> <strong>and</strong> <strong>television</strong><br />
programmes have been well known for a long time. With the more-recent<br />
<strong>in</strong>troduction of digital techniques, comb<strong>in</strong>ed with the parallel transmission of digital<br />
<strong>and</strong> analogue broadcasts, this problem is aga<strong>in</strong> becom<strong>in</strong>g highly significant.<br />
This article presents some solutions for avoid<strong>in</strong>g loudness differences <strong>in</strong> <strong>radio</strong> <strong>and</strong><br />
<strong>television</strong> broadcast<strong>in</strong>g, based on levell<strong>in</strong>g recommendations <strong>and</strong> a newly-developed<br />
loudness algorithm.<br />
Listeners <strong>and</strong> viewers are becom<strong>in</strong>g <strong>in</strong>creas<strong>in</strong>gly concerned over sudden variations <strong>in</strong> programme loudness.<br />
These loudness “jumps” are most apparent when zapp<strong>in</strong>g through European DVB <strong>television</strong> <strong>and</strong> <strong>radio</strong> channels.<br />
The loudness differences between film dialogues <strong>and</strong> highly-compressed commercial breaks (adverts)<br />
are perceived as be<strong>in</strong>g particularly jarr<strong>in</strong>g. Both under-levell<strong>in</strong>g <strong>and</strong> over-levell<strong>in</strong>g can be observed, result<strong>in</strong>g<br />
<strong>in</strong> level differences of more than 15 dB.<br />
The reasons for such programme level <strong>and</strong> loudness variations are, among others:<br />
� apparent <strong>in</strong>experience <strong>in</strong> the levell<strong>in</strong>g of sound channels;<br />
� the use of different <strong>and</strong> sometimes non-st<strong>and</strong>ardized programme level meters;<br />
� no st<strong>and</strong>ardized loudness meter has been available until now;<br />
� archive material (both analogue <strong>and</strong> digital) has not, to any great extent, been adapted to the types of<br />
sound channel be<strong>in</strong>g used today.<br />
In FM <strong>radio</strong> broadcast<strong>in</strong>g, loudness is ma<strong>in</strong>ly balanced or controlled by means of compressors <strong>and</strong> limiters that<br />
prevent the frequency deviation of the transmitter from exceed<strong>in</strong>g the permissable limits.<br />
In the case of digital broadcast<strong>in</strong>g, it should also be possible to achieve balanced loudness profiles – by follow<strong>in</strong>g<br />
the exist<strong>in</strong>g <strong>in</strong>ternational recommendations of the ITU <strong>and</strong> the <strong>EBU</strong>. These profiles should be met not<br />
only when compar<strong>in</strong>g different programmes / channels, but also between different contributions with<strong>in</strong> any<br />
s<strong>in</strong>gle programme.<br />
Characteristics of <strong>radio</strong> programme meters<br />
Alignment level<br />
— <strong>in</strong> <strong>radio</strong> <strong>and</strong> <strong>television</strong> broadcast<strong>in</strong>g<br />
ITU Recommendation ITU-R BS.645-2 [1] def<strong>in</strong>es the programme level of <strong>radio</strong> channels by means of an<br />
alignment signal (1 kHz s<strong>in</strong>e wave). The specified level of the s<strong>in</strong>e wave corresponds approximately to fullscale<br />
programme level, <strong>in</strong> terms of loudness.<br />
<strong>EBU</strong> TECHNICAL REVIEW – January 2004 1 / 12<br />
G. Spikofski <strong>and</strong> S. Klar
Table 1<br />
Audio levels <strong>in</strong> studio <strong>and</strong> transmission environments<br />
Recommendations for<br />
analogue & digital audio levels<br />
ITU-R BS.645-2 Transmission Level<br />
(<strong>in</strong>ternational)<br />
ARD HFBL-K Studio Level<br />
(national)<br />
US Reference Level<br />
(national)<br />
<strong>EBU</strong> digital Transmission & Studio Level<br />
(<strong>in</strong>ternational)<br />
a. PML = Permitted Maximum Level<br />
b. 0 dBu = 0.775 V rms (s<strong>in</strong>e wave) = 1.1 V peak<br />
c. dBFS = Clipp<strong>in</strong>g Level (FS = Full Scale)<br />
AUDIO LOUDNESS<br />
As the alignment signal is “static”, it can be measured by means of typical RMS meters as well as specific programme<br />
meters.<br />
It should be noted that the analogue alignment level (AL), <strong>and</strong> the “nom<strong>in</strong>al” or permitted maximum level<br />
(PML), are specified diversely due to the different national <strong>and</strong> <strong>in</strong>ternational recommendations <strong>in</strong> use (see<br />
Table 1).<br />
In the case of digital audio channels, the relationship between the alignment signal <strong>and</strong> the full-scale or clipp<strong>in</strong>g<br />
level was already specified <strong>in</strong> 1992 (<strong>EBU</strong> Rec. R68 [2]). When follow<strong>in</strong>g this recommendation, the difference<br />
between full-scale (or clipp<strong>in</strong>g) level <strong>and</strong> the alignment level is 18 dB (Table 1). In other words, the<br />
alignment level should be –18 dBFS.<br />
Audio programme meters for broadcast<strong>in</strong>g<br />
Alignment Level (AL)<br />
–9 dB (35%)<br />
0dBu b<br />
Nom<strong>in</strong>al Level (PML) a<br />
0 dB (100%)<br />
+9 dBu<br />
–3 dBu (adaptation) +6 dBu (adaptation)<br />
+4 dBu (adaptation)<br />
–18 dBFS –9 dBFS c<br />
Today, many different programme meters are <strong>in</strong> use at professional studios, with widely vary<strong>in</strong>g ballistical features<br />
(see Table 2 <strong>and</strong> Fig. 1b).<br />
Table 2<br />
Programme meters used <strong>in</strong> <strong>in</strong>ternational transmission <strong>and</strong> studio environments<br />
Programme<br />
Meter Type<br />
Recommendation<br />
VU Meter ANSI C 16.5<br />
IEC 268-17<br />
DIN PPM<br />
(QPPM)<br />
BBC PPM<br />
(QPPM)<br />
<strong>EBU</strong> PPM Std<br />
(QPPM)<br />
<strong>EBU</strong> Digi<br />
PPM (QPPM)<br />
IRT Digi<br />
PPM (QPPM)<br />
DIN 45406<br />
IEC 268-10/1<br />
ARD Pfl.H.3/6<br />
PML a<br />
100%<br />
0VU<br />
+0 dBu<br />
0dBr<br />
+9 dBu<br />
IEC 268-10 / IIa ‘6'<br />
+8 dBu<br />
<strong>EBU</strong> 3205 E<br />
IEC 268-10 / IIb<br />
<strong>EBU</strong><br />
IEC 268-18<br />
+9 dB<br />
+9 dBu<br />
IRT proposal 0dBr<br />
100%<br />
Limit<br />
Level<br />
+16 dBr<br />
+25 dBu<br />
Scale Attack time<br />
(<strong>in</strong>tegration)<br />
–20 to +3<br />
[dB]<br />
–50 to +5<br />
[dB]<br />
Decay time<br />
(fall-back)<br />
a. Permitted Maximum Level (PML): 100% Modulation = +9 dBu = –9 dBFS for transmission l<strong>in</strong>es [1][2]<br />
≡ +6 dBu ARD Nom<strong>in</strong>al Studio Level [3].<br />
Invisible<br />
peaks<br />
300 ms / 90% 300 ms / 10% +13 ... +16<br />
dB<br />
10 ms / 90%<br />
5 ms / 80%<br />
20 dB / 1.5 s<br />
=13dB/s<br />
+3 ... +4<br />
dB<br />
<strong>EBU</strong> TECHNICAL REVIEW – January 2004 2 / 12<br />
G. Spikofski <strong>and</strong> S. Klar<br />
1 to 7<br />
[ ]<br />
–12 to +12<br />
[dB]<br />
–9 dBFS 0dBFS –40 to +0<br />
[dB]<br />
≤ +10 dBr –50 to +10<br />
[dB]<br />
10 ms / 80% 24 dB / 2.8 s<br />
=8.6dB/s<br />
10 ms / 80% 24 dB / 2.8 s<br />
=8.6dB/s<br />
≤ 5 ms / 80% 20 dB / 1.7 s<br />
=12dB/s<br />
5 ... 10 ms /<br />
to 80%<br />
20 dB / 1.7 s<br />
=12dB/s<br />
+4 ... +6<br />
dB<br />
+4 ... +6<br />
dB<br />
+3 ... +4<br />
dB<br />
+3 ... +4<br />
dB
Broadcast peak programme meter for analogue <strong>and</strong> digital audio<br />
Switchable attack time QPPM (5 ms) / Fast PPM (0 ms)<br />
Modulation Range<br />
Headroom<br />
Programme level 9% 35% 100% PPM FAST<br />
>5 ms → 80% <strong>in</strong>dication<br />
–51 relative level –21 –9 0 +5 +9 dB<br />
>5 ms → 80% <strong>in</strong>dication<br />
9% 35% 100% 180%<br />
–60 digital level –18 –9 0 dBFS<br />
–45 analogue level ITU-R 0 +9 +14 +18 dBm<br />
–45 analogue level ARD –3 +6 +11 +15 dBm<br />
© IRT/ AS - sk<br />
<strong>EBU</strong> Alignment Level ARD HFBL-K<br />
Figure 1a<br />
Recommended broadcast peak-programme meter<br />
clipp<strong>in</strong>g level<br />
s<strong>in</strong>gle peak<br />
© IRT/ AS - sk<br />
QPPM<br />
headroom<br />
Ls<br />
AL<br />
PPM<br />
FAST<br />
0 ms to 100% <strong>in</strong>dication<br />
0<br />
–3<br />
–6<br />
–9<br />
–18<br />
dBFS<br />
–24<br />
DIN<br />
5 ms to 80% <strong>in</strong>dication<br />
IEC<br />
QPPM<br />
+9<br />
+6<br />
+3<br />
0<br />
BBC<br />
10 ms to 80% <strong>in</strong>dication<br />
VU<br />
+9 dBm = 3.09 V peak<br />
different<br />
attack times<br />
300 ms <strong>in</strong>teg.<br />
dB dBµ dB<br />
–15<br />
+12<br />
+9<br />
–9 0<br />
–6<br />
+3<br />
–9 dBFS<br />
–18 dBFS<br />
AUDIO LOUDNESS<br />
Whereas <strong>in</strong> America <strong>and</strong> Australia,<br />
VU meters [4] are ma<strong>in</strong>ly used, the<br />
peak programme meter (PPM) is<br />
recommended by the <strong>EBU</strong> [5] for<br />
use <strong>in</strong> European countries. They<br />
are specified <strong>in</strong> the follow<strong>in</strong>g IEC<br />
recommendations:<br />
� IEC 268-10 [6]<br />
(analogue PPM);<br />
� IEC 268-18 [7]<br />
(digital PPM).<br />
The IEC category of PPM is the<br />
so-called quasi-peak programme<br />
meter (QPPM) which neglects any<br />
short-duration signal variations.<br />
For digital PPMs, the <strong>EBU</strong> recommends<br />
almost the same ballistical<br />
characteristics as that described <strong>in</strong><br />
IEC 268-10 (Type 1).<br />
S<strong>in</strong>ce the <strong>in</strong>troduction of digital<br />
audio techniques <strong>in</strong> broadcast<strong>in</strong>g,<br />
additional – but not precisely specified<br />
– PPMs have caused some<br />
confusion. Besides their different<br />
scale layouts, these PPMs primarily<br />
vary <strong>in</strong> their ballistical features<br />
– described by parameters such as<br />
attack time or <strong>in</strong>tegration time, <strong>and</strong><br />
fall-back time or decay time.<br />
Table 2 shows the PPMs that are<br />
currently used <strong>in</strong> Europe. Regard<strong>in</strong>g<br />
the layout of the scale, the fullscale<br />
tag (100% tag = 0 dB) – <strong>and</strong><br />
also the specified headroom –<br />
should take <strong>in</strong>to account the “attack<br />
time” of the programme meter.<br />
As an example, the VU meter –<br />
which can be considered as relatively<br />
slow – obviously needs an appropriate headroom because of the “<strong>in</strong>visible” signal peaks. Consequently,<br />
the difference between the 100% tag <strong>and</strong> the alignment level has to be smaller than <strong>in</strong> the case of other meter<br />
types.<br />
Note: The attack time of the PPM used by the German broadcasters ARD <strong>and</strong> ZDF [8] is specified as<br />
10 ms / 90%. This means that it takes 10 ms to reach the 90% tag. The IEC meter type which is used by<br />
the BBC is specified slightly differently (10 ms / 80%).<br />
In the case of the fast digital sample programme meter (SPPM), theoretically no headroom is needed. These<br />
meters are appropriate for controll<strong>in</strong>g signal peaks with respect to clipp<strong>in</strong>g but they are not as suitable as<br />
QPPMs for normal programme levell<strong>in</strong>g. For example, signals with a high proportion of peaks tend to be<br />
under-levelled whereas heavily-compressed signals with limited peaks tend to be over-levelled. This can<br />
result <strong>in</strong> huge jumps <strong>in</strong> loudness, which seem to be more <strong>in</strong>tensive than when us<strong>in</strong>g a QPPM.<br />
The use of unspecified level meters is widely observed <strong>in</strong> the digital audio field. If sound eng<strong>in</strong>eers are reasonably<br />
familiar with a particular level meter, the use of an unspecified device could result <strong>in</strong> severe levell<strong>in</strong>g<br />
<strong>EBU</strong> TECHNICAL REVIEW – January 2004 3 / 12<br />
G. Spikofski <strong>and</strong> S. Klar<br />
100% VU<br />
L<br />
R<br />
Ballistical behaviour of<br />
programme meter types<br />
0<br />
–6<br />
different<br />
headrooms<br />
100%<br />
QPPM<br />
<strong>Loudness</strong><br />
Level<br />
Alignment<br />
Level<br />
(35%)<br />
PPM display decay = 12 dB/s<br />
Figure 1b<br />
Ballistical characteristics of different broadcast programme meters
AUDIO LOUDNESS<br />
mistakes such as clipp<strong>in</strong>g <strong>and</strong> loudness jumps. Because unspecified <strong>in</strong>struments offer a wide gamut of characteristics,<br />
it is difficult to become familiar with them <strong>and</strong> ga<strong>in</strong> sufficient experience <strong>in</strong> levell<strong>in</strong>g.<br />
Digital programme meters are frequently software applications. As is well known from such applications,<br />
there are “<strong>in</strong>f<strong>in</strong>ite” error sources. Because the “attack time” tends towards 0 ms, this means that the peak samples<br />
are <strong>in</strong>dicated correctly. However, there are wide variations <strong>in</strong> the decay time. Those effects can result <strong>in</strong><br />
different displays as well as differences <strong>in</strong> level.<br />
In Germany, the QPPM is precisely specified <strong>in</strong> ARD-Pflichtenheft 3/6 [8]. This meter is recommended for<br />
the levell<strong>in</strong>g of both analogue <strong>and</strong> digital audio signals. Additional PPMs – with attack times shorter than<br />
10 ms – are also specified here, but should only be used for monitor<strong>in</strong>g – not for levell<strong>in</strong>g.<br />
In order to avoid confusion, the IRT recommends that the scale layout of the digital PPM is adapted to that of<br />
the analogue QPPM [6] (Fig. 1a, Table 2). That means that the 100% tag has to be 9 dB below full scale.<br />
Dynamic range of digital audio systems<br />
Programme levell<strong>in</strong>g <strong>and</strong> headroom<br />
As already mentioned, the levell<strong>in</strong>g range <strong>and</strong> the necessary headroom depend on the ballistical features of the<br />
meter <strong>in</strong> use. Whereas VU meters need up to 18 dB headroom, PPMs only require 9 dB [1][9][10].<br />
The 9 dB headroom of the <strong>EBU</strong> PPM is strictly l<strong>in</strong>ked to QPPMs that accord with [1] <strong>and</strong> the alignment level<br />
specified <strong>in</strong> [2]. Us<strong>in</strong>g <strong>in</strong>struments with different ballistical features obviously results <strong>in</strong> other headroom recommendations.<br />
Headroom has to be considered as a buffer range between the nom<strong>in</strong>al <strong>and</strong> clipp<strong>in</strong>g levels. If the European<br />
recommendation is followed, the exchange of programme material is guaranteed to have no levell<strong>in</strong>g problems.<br />
German broadcasters have accepted this recommendation <strong>and</strong> the headroom is specified <strong>in</strong> document<br />
ARD HFBL-K Rec. 15 IRT [3], which accords with the <strong>EBU</strong> recommendation. In the case of analogue signals<br />
<strong>and</strong> also devices that <strong>in</strong>volve A/D <strong>and</strong> D/A conversions, the absolute audio limit at German broadcast studios<br />
is +15 dBu (100% tag = +6 dBu, plus another 9 dB headroom) (see Fig. 1a).<br />
Usable dynamic range – objective <strong>and</strong> subjective considerations<br />
When discuss<strong>in</strong>g headroom <strong>and</strong> footroom [10], the question always arises – whether the result<strong>in</strong>g system<br />
dynamics are sufficient to accommodate the full dynamic range of the human ear. In other words, which quantization<br />
level or how many bits are necessary to guarantee the transmission of music signals without any perceivable<br />
noise.<br />
One answer to this question was given <strong>in</strong> a paper published <strong>in</strong> 1985 [11]. In the follow<strong>in</strong>g section, the conditions<br />
<strong>and</strong> results of this 1985 study are presented.<br />
This <strong>in</strong>vestigation was conducted before the era of bitrate reduction systems such as M<strong>in</strong>iDisc (ATRAC),<br />
MPEG-1 Layer 2 (mp2) <strong>and</strong> Layer 3 (mp3). Bitrate reduction systems are therefore not considered <strong>in</strong> this context.<br />
Compared to PCM (Pulse Code Modulation) systems, the aforementioned bitrate reduction systems evidently<br />
need less quantization. The fact that they allow noise-free record<strong>in</strong>gs nevertheless shows that, <strong>in</strong> these<br />
cases, other quality features have to be considered.<br />
In PCM systems, the dynamic range of a system is def<strong>in</strong>ed as the level differences between full-scale programme<br />
level <strong>and</strong> the <strong>in</strong>herent noise level of the system.<br />
The dynamic range, the signal-to-noise ratio <strong>and</strong> the quantization noise can be calculated by means of the follow<strong>in</strong>g<br />
formula:<br />
... where n = quantization level (number of bits).<br />
S/N [dB] = 6n + 2<br />
<strong>EBU</strong> TECHNICAL REVIEW – January 2004 4 / 12<br />
G. Spikofski <strong>and</strong> S. Klar
AUDIO LOUDNESS<br />
The calculated value – with a negative sign – corresponds to the RMS value of the quantization noise, relative<br />
to 0 dBFS programme level (the Full Scale / Clipp<strong>in</strong>g Level of a digital system). Table 3 shows the RMS<br />
noise values for three typical quantizations. These absolute values represent the maximum dynamic range (<strong>in</strong><br />
dB) for each of the three quantizations shown <strong>in</strong> the table.<br />
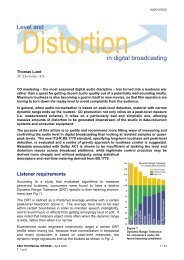
If we consider a headroom of 9 dB [2] <strong>and</strong> a footroom of 20 dB [10], the derived values for dynamic range are<br />
shown <strong>in</strong> Fig. 2 as a function of quantization.<br />
Usable system dynamics (dB)<br />
140<br />
120<br />
100<br />
80<br />
60<br />
40<br />
20<br />
0<br />
Table3<br />
Achievable signal-to-noise ratios for different quantizations <strong>and</strong> noise-level measurements<br />
Noise voltage level 16-bit 20-bit 24-bit<br />
RMS (dB) –98 –122 –146<br />
DIN 45 405 (dB) [12] –90 –114 –138<br />
ITU 468 (dBqps) [13] –86 –110 –134<br />
Footroom Effectively usable system dynamics Headroom<br />
Objective measurement Subjective measurement<br />
pmax = 0 dBFS<br />
Quantization noise<br />
SPLmax<br />
= 100 dBA<br />
16-bit system 20-bit system 24-bit system CD Loudspeaker<br />
90% values<br />
Perception limit<br />
SPLmax<br />
= 104 dBA<br />
Headphone<br />
(cumulative)<br />
Figure 2<br />
Usable dynamic range of digital PCM systems – both subjective <strong>and</strong><br />
objective<br />
In pr<strong>in</strong>ciple, the reference values<br />
for the dynamic range – the maximum<br />
full-scale programme level<br />
on the one h<strong>and</strong> <strong>and</strong> the system<br />
noise level on the other – correspond<br />
to certa<strong>in</strong> sound pressure<br />
levels <strong>in</strong> the reproduction of music<br />
signals. The relevant sound pressure<br />
levels are the maximum listen<strong>in</strong>g<br />
level <strong>and</strong> the just<br />
imperceptible noise level.<br />
These two levels were actually<br />
<strong>in</strong>vestigated separately by the IRT,<br />
despite the fact that they are l<strong>in</strong>ked<br />
together as system features. The<br />
five selected test items (female<br />
speech, male speech, orchestral,<br />
str<strong>in</strong>g quartet <strong>and</strong> rock music)<br />
were only used to determ<strong>in</strong>e the<br />
maximum listen<strong>in</strong>g level. The representative noise signals (idle channel noises, white noise, etc.) were <strong>in</strong>vestigated<br />
<strong>in</strong> the absence of programme signals. That meant that the disturb<strong>in</strong>g noises were only assessed dur<strong>in</strong>g<br />
music pauses – without hav<strong>in</strong>g to consider the mask<strong>in</strong>g effect that would occur <strong>in</strong> the presence of programme<br />
signals.<br />
Subjective experiments were carried out with 20 normal “listeners” <strong>in</strong> <strong>in</strong>dividual sessions. The listen<strong>in</strong>g setup<br />
met the requirements for professional listen<strong>in</strong>g evaluations, <strong>in</strong>clud<strong>in</strong>g stereo loudspeaker <strong>and</strong> headphone<br />
reproduction [14][15].<br />
The results of the <strong>in</strong>vestigation are presented <strong>in</strong> Fig. 2. The two aforementioned reference values correspond<br />
to (i) the 90% value of the cumulative frequency distribution of the maximum listen<strong>in</strong>g levels (dBA) <strong>and</strong> (ii)<br />
the average value of the <strong>in</strong>dividual perception limits for the system noises that were <strong>in</strong>vestigated.<br />
In the left part of Fig. 2, the relationship between quantization <strong>and</strong> system dynamics is shown for three l<strong>in</strong>ear<br />
PCM systems (16-bit, 20-bit <strong>and</strong> 24-bit). In each case, the recommended headroom of 9 dB <strong>and</strong> footroom of<br />
20 dB have been <strong>in</strong>cluded. The results show that a l<strong>in</strong>ear 16-bit system, such as CD, just meets the requirements<br />
of the human ear for loudspeaker reproduction. In the case of headphone reproduction, the human<br />
requirements are only met if the headroom allowance is rel<strong>in</strong>quished – which is normally the case with CD<br />
production today. Consequently, for digital audio studio production, where headroom <strong>and</strong> footroom are essential,<br />
the test results presented show that professional audio production needs at least 18-bit systems.<br />
<strong>EBU</strong> TECHNICAL REVIEW – January 2004 5 / 12<br />
G. Spikofski <strong>and</strong> S. Klar
Programme levell<strong>in</strong>g <strong>and</strong> loudness<br />
Programme levell<strong>in</strong>g<br />
AUDIO LOUDNESS<br />
Level adjustments are controlled by means of a level meter (e.g. QPPM) such that the maximum programme<br />
levels almost meet but do not exceed the 100% tag. In German broadcast<strong>in</strong>g, the level meter QPPM accords<br />
with IEC 268-10 [6] <strong>and</strong> is st<strong>and</strong>ardized for both analogue <strong>and</strong> digital signals. Meet<strong>in</strong>g the 100% tag, which<br />
implies a 9 dB headroom, guarantees transmissions that are free of distortions. This does not mean that no<br />
amplitudes greater than 100% occur. Any short-term peaks that are <strong>in</strong>visible to the sound eng<strong>in</strong>eer should not<br />
generally produce clipp<strong>in</strong>g – because a sufficient headroom of 9 dB is provided, as a result of extensive programme<br />
signal analysis [9].<br />
Programme loudness<br />
As is generally known, the same levell<strong>in</strong>g applied to different programme signals does not normally result <strong>in</strong><br />
the same loudness impression. This discrepancy is especially evident when compar<strong>in</strong>g music <strong>and</strong> speech. In<br />
order to reach a uniform loudness balance <strong>in</strong> mixed broadcast programm<strong>in</strong>g, special levell<strong>in</strong>g recommendations<br />
have been def<strong>in</strong>ed follow<strong>in</strong>g detailed <strong>in</strong>vestigations [17][18].<br />
Meet<strong>in</strong>g these recommendations <strong>in</strong> situations where speech is more important (e.g. magaz<strong>in</strong>es, motor<strong>in</strong>g programmes<br />
<strong>and</strong> commercials), the speech should be levelled to 0 dB <strong>and</strong> the music to between –8 dB <strong>and</strong> –4 dB.<br />
Those recommendations are useful for avoid<strong>in</strong>g extreme loudness differences between <strong>and</strong> with<strong>in</strong> broadcast<br />
programmes. However, adapt<strong>in</strong>g the programme loudness to suit the requirements of the human ear cannot<br />
always be achieved by this means alone. This is particularly true when us<strong>in</strong>g special audio processors. In this<br />
case, when adapt<strong>in</strong>g the loudness of broadcast programmes to the characteristics of the human ear, an additional<br />
loudness meter is necessary along with the level meter which is controll<strong>in</strong>g the technical levels.<br />
Although some <strong>in</strong>vestigations had been carried out <strong>in</strong> this field [16][19][20][21], no st<strong>and</strong>ardized loudness<br />
meter is available at the moment. <strong>Loudness</strong> corrections today still have to be done manually by the control<br />
eng<strong>in</strong>eer. This, of course, is not practicable when most of the control functions are h<strong>and</strong>led automatically.<br />
However, new <strong>in</strong>vestigations have shown that a studio loudness meter may be realizable [21], us<strong>in</strong>g new loudness<br />
algorithms based on measur<strong>in</strong>g both the signal level <strong>and</strong> the signal power.<br />
The follow<strong>in</strong>g methods were tested:<br />
� loudness measurement – RTW [16];<br />
� loudness measurement – EMMETT [19];<br />
� signal level – QPPM;<br />
� signal power level – PWR.<br />
The study dealt with both the subjective <strong>and</strong> objective aspects of loudness measurements. In the former case,<br />
psychoacoustic measurements were carried out to determ<strong>in</strong>e the subjectively-perceived loudness of the<br />
selected broadcast programme material. In the latter case, objective measurements were aimed at deriv<strong>in</strong>g rel-<br />
A/D Analogue-to-Digital<br />
ADR Astra Digital Radio<br />
AL Alignment Level<br />
dBFS dB relative to Full-Scale read<strong>in</strong>g<br />
D/A Digital-to-Analogue<br />
DAB Digital Audio Broadcast<strong>in</strong>g (Eureka-147)<br />
DSR Digital Satellite Radio<br />
DVB Digital Video Broadcast<strong>in</strong>g<br />
FM Frequency Modulation<br />
IEC International Electrotechnical Commission<br />
Abbreviations<br />
ISO International Organization for St<strong>and</strong>ardization<br />
ITU International Telecommunication Union<br />
MPEG (ISO/IEC) Mov<strong>in</strong>g Picture Experts Group<br />
PCM Pulse Code Modulation<br />
PML Permitted Maximum Level<br />
PPM Peak Programme Meter<br />
QPPM Quasi-Peak Programme Meter<br />
RMS Root-Mean-Square<br />
SPPM Sample Peak Programme Meter<br />
VU (Audio) Volume Units<br />
<strong>EBU</strong> TECHNICAL REVIEW – January 2004 6 / 12<br />
G. Spikofski <strong>and</strong> S. Klar
Cumulative freqency distribution ( %)<br />
Spearman Rank Correlation<br />
100<br />
80<br />
60<br />
40<br />
20<br />
30% level<br />
50% level<br />
QPPM / Piano<br />
10% level<br />
0<br />
–30 –25 –20 –15 –10 –5 0<br />
Level (dB)<br />
Figure 3<br />
Pr<strong>in</strong>cipal analysis of the cumulative frequency<br />
distribution of objective loudness levels<br />
100<br />
80<br />
60<br />
40<br />
20<br />
0<br />
[ A ] 10 %<br />
[ A ] 30 %<br />
Subjective (average values) <strong>and</strong> Objective <strong>Loudness</strong><br />
[ A ] 50 %<br />
[ B ] 10 %<br />
[ B ] 30 %<br />
[ B ] 50 %<br />
[ C ] 10 %<br />
[ C ] 30 %<br />
Figure 5<br />
Spearman Rank Correlation between subjective<br />
(average values) <strong>and</strong> objective loudness<br />
parameters (A - F, not specified, are the six loudness<br />
algorithms under test)<br />
[ C ] 50 %<br />
[ D ] 30 %<br />
[ D ] 50 %<br />
[ E ] 30 %<br />
[ E ] 50 %<br />
[ F ] 30 %<br />
[ F ] 50 %<br />
QPPM / Piano<br />
AUDIO LOUDNESS<br />
–24<br />
0 2 4 6 8 10 12<br />
Time (sec)<br />
14 16 18 20<br />
evant signal parameters which would allow us to def<strong>in</strong>e objective loudness. The performance/accuracy of the<br />
objective parameters was assessed by correlat<strong>in</strong>g them with the associated subjective loudness values.<br />
The test material comprised record<strong>in</strong>gs of DSR (Digital Satellite Radio) with 16 stereo <strong>radio</strong> programmes,<br />
recorded <strong>in</strong> 1984. Each of the 16 programmes was represented by audio clips of about 15 s duration. The 56<br />
clips eventually chosen conta<strong>in</strong>ed announcements, orchestral, chamber, piano, vocal <strong>and</strong> pop music. This<br />
selection of clips was considered to be representative of actual <strong>radio</strong> programm<strong>in</strong>g at the time, especially with<br />
respect to levell<strong>in</strong>g <strong>and</strong> audio process<strong>in</strong>g.<br />
In order to derive relevant objective parameters for each of the loudness algorithms <strong>and</strong> programmes, audiolevel<br />
histograms (frequency of specific level values with<strong>in</strong> the item duration) were analysed. In each case, the<br />
cumulative frequency distribution was plotted, to illustrate how programme levels were be<strong>in</strong>g exceeded for<br />
10%, 30% <strong>and</strong> 50% of the time (Fig. 3).<br />
As an example, the measurement of QPPM vs. Time (<strong>in</strong>corporat<strong>in</strong>g the analysed cumulative frequency distribution)<br />
is presented <strong>in</strong> Fig. 4. The measurements were made us<strong>in</strong>g the ARD-Pflichtenheft Nr. 3/6 level meter,<br />
with 10 ms <strong>in</strong>tegration time <strong>and</strong> a release time of 1.5 s [8].<br />
The criterion used for assess<strong>in</strong>g the performance of these loudness algorithms is the Spearman Rank Correlation<br />
between the subjective <strong>and</strong> objective loudness measurements. Whereas subjective loudness is represented<br />
<strong>EBU</strong> TECHNICAL REVIEW – January 2004 7 / 12<br />
G. Spikofski <strong>and</strong> S. Klar<br />
QPPM level (dB) [ 0 dB = –9 dBFS ]<br />
Spearman Rank Correlation (%)<br />
0<br />
–3<br />
–6<br />
–9<br />
–12<br />
–15<br />
–18<br />
–21<br />
Figure 4<br />
QPPM level <strong>and</strong> cumulative frequency rates<br />
under test (test item = piano)<br />
100%<br />
90%<br />
80%<br />
70%<br />
60%<br />
50%<br />
40%<br />
30%<br />
20%<br />
10%<br />
0%<br />
10% level<br />
30% level<br />
50% level<br />
Subjective <strong>Loudness</strong> & Analys<strong>in</strong>g Time<br />
Cumulative frequency distribution of QPPM = 50% ( 56 items )<br />
1s 3s 5s 7s 10s Total time<br />
Figure 6<br />
Correlation between subjective <strong>and</strong> objective<br />
QPPM loudness – variation of analys<strong>in</strong>g time
Spearman Rank Correlation (%)<br />
100<br />
90<br />
80<br />
70<br />
60<br />
50<br />
40<br />
30<br />
20<br />
10<br />
0<br />
Subjective <strong>Loudness</strong> & Cumulative Frequency Distribution<br />
of QPPM ( 56 items )<br />
80% level 70% level 60% level 50% level<br />
Figure 7<br />
Correlation between subjective <strong>and</strong> objective<br />
QPPM loudness<br />
– variation of cumulative frequency rate<br />
AUDIO LOUDNESS<br />
by the average values of the subjective loudness<br />
assessments, the correspond<strong>in</strong>g objective parameters<br />
are the levels that were exceeded for 10%, 30% <strong>and</strong><br />
50% of the time.<br />
With reference to Fig. 5, it can be seen that the 50%<br />
level displays the highest correlation, for all the algorithms<br />
tested.<br />
If we consider just the 50% values <strong>in</strong> Fig. 5, a correlation<br />
> 67% is achieved with each algorithm (labelled A<br />
- F), whereas algorithms A <strong>and</strong> B display the highest<br />
correlation (78%).<br />
Because of the high correlation coefficients of algorithms<br />
A <strong>and</strong> B, <strong>and</strong> because of the relatively small<br />
deviations between the subjective <strong>and</strong> objective loudness<br />
parameters [21], these two algorithms form a<br />
good basis for develop<strong>in</strong>g a studio loudness meter. It can be stated that these programme meters are <strong>in</strong> accordance<br />
with the meter specified <strong>in</strong> [8], with an <strong>in</strong>tegration time of 10 ms.<br />
In order to optimize the loudness algorithm with the level meter specified <strong>in</strong> [6] (with 10 ms <strong>in</strong>tegration time<br />
<strong>and</strong> 1.5 s release time), additional measurements were carried out. Among other parameters, the cumulative<br />
frequency distribution (60%, 70% <strong>and</strong> 80%) <strong>and</strong> the analys<strong>in</strong>g time (1 s, 3 s, 5 s, 7 s <strong>and</strong> 10 s) were tested. The<br />
correspond<strong>in</strong>g results are presented <strong>in</strong> Figs 6 - 8.<br />
After optimiz<strong>in</strong>g the parameters under test, the result<strong>in</strong>g correlation between subjective <strong>and</strong> objective loudness<br />
amounts to 90%. The <strong>in</strong>dividual results of subjective <strong>and</strong> objective loudness are presented <strong>in</strong> Fig. 8 with additional<br />
<strong>in</strong>dication of the average values <strong>and</strong> the 95% confidence <strong>in</strong>tervals of the subjective loudness levels.<br />
Based on these results, a loudness algorithm was def<strong>in</strong>ed <strong>and</strong> a prototype of the studio loudness meter was<br />
developed. At the moment, this prototype is undergo<strong>in</strong>g tests – with special emphasis be<strong>in</strong>g given to practical<br />
performance problems.<br />
phon<br />
90<br />
80<br />
70<br />
60<br />
50<br />
40<br />
Item 12<br />
Item 11<br />
Item 04<br />
Item 03<br />
Item 55<br />
Item 46<br />
Item 09<br />
Item 02<br />
Item 06<br />
Subjective & Objective loudness<br />
Spearman Rank Correlation = 90% ( 56 items )<br />
Item 29<br />
Item 45<br />
Figure 8<br />
Subjective (averages <strong>and</strong> 95% confidence <strong>in</strong>tervals) <strong>and</strong> objective QPPM loudness<br />
Item 33<br />
Item 56<br />
Item 41<br />
<strong>EBU</strong> TECHNICAL REVIEW – January 2004 8 / 12<br />
G. Spikofski <strong>and</strong> S. Klar<br />
Item 59<br />
Item 60<br />
Item 58<br />
Item 27<br />
Item 37<br />
Item 43<br />
Item 50<br />
Item 25<br />
Item 40<br />
OBJ SUBJ<br />
Item 42<br />
Item 19<br />
Item 52<br />
Item 34<br />
Item 39
Signal amplitude<br />
9<br />
6<br />
3<br />
0<br />
–3<br />
–6<br />
–9<br />
–12<br />
–15<br />
–18<br />
3<br />
4<br />
2 1<br />
5<br />
Clipp<strong>in</strong>g Level 280%<br />
100% QPPM Programme Level<br />
Nom<strong>in</strong>al Level 0 dBr<br />
–21<br />
1E-06 1E-03 1 10 30 60 80<br />
Signal level (dB)<br />
DVB Radio & TV Sound (R/TV):<br />
[1] R, news, es<br />
[2] R, rock music fr<br />
[3] R, easy listen<strong>in</strong>g music uk<br />
[4] TV, news, fem. de<br />
[5] test, p<strong>in</strong>k noise > 0dB QPPM<br />
Probability of excessive amplitude (%)<br />
Figure 9<br />
Amplitude statistics of DVB <strong>radio</strong> <strong>and</strong> TV signals<br />
9<br />
6<br />
3<br />
0<br />
–3<br />
–6<br />
–9<br />
–12<br />
Alignment Level 35%<br />
clipp<strong>in</strong>g level +9 dB<br />
0 dB = 100% QPPM true peaks SPM1<br />
–15<br />
–18<br />
pow1 (1s-rms)<br />
LsM<br />
–21<br />
DVB Radio Channel 4<br />
0 3 6 9 12 15 18 21<br />
time (sec)<br />
24 27 30<br />
Figure 10<br />
Programme levels (QPPM, SPPM, PWR 1s, QPPM <strong>Loudness</strong> LsM) –<br />
female speaker (no compression)<br />
Signal level (dB)<br />
9<br />
6<br />
3<br />
0<br />
–3<br />
–6<br />
–9<br />
–12<br />
–15<br />
–18<br />
–21<br />
pow1s (1s-rms)<br />
DVB Radio Channel 2<br />
0 dB = 100% QPPM<br />
clipp<strong>in</strong>g level +9 dB<br />
QPPM<br />
AUDIO LOUDNESS<br />
Programme analysis<br />
of DVB channels<br />
In order to ga<strong>in</strong> experience with<br />
this newly-developed studio loudness<br />
meter, audio measurements<br />
were carried out on different European<br />
DVB channels. Besides the<br />
loudness levels (LsM) <strong>and</strong> the signal<br />
levels (PPM, QPPM), the signal<br />
amplitudes were also <strong>in</strong>cluded<br />
<strong>in</strong> the measurement campaign.<br />
The follow<strong>in</strong>g two methods of analys<strong>in</strong>g<br />
the derived data were considered<br />
as appropriate:<br />
� Amplitude statistics – analysis<br />
of the cumulative frequency<br />
distribution of the<br />
audio samples. The form of<br />
the diagrams presented here<br />
(signal amplitude vs. probability<br />
of exceed<strong>in</strong>g the amplitude)<br />
yield <strong>in</strong>terest<strong>in</strong>g<br />
<strong>in</strong>formation about loudness<br />
<strong>and</strong> compression features of<br />
the analysed signals (Fig. 9).<br />
� Level registration vs. time –<br />
record<strong>in</strong>g the normally displayed<br />
levels (e.g. QPPM,<br />
SPPM, PWR 1s, QPPM-<br />
<strong>Loudness</strong> LsM) for later evaluation<br />
of the programme signals<br />
(Figs 10 - 11).<br />
The measurement results presented<br />
<strong>in</strong> Figs 9 - 11 show beyond doubt<br />
that there are tremendous differences<br />
between the DVB channels<br />
under test, when consider<strong>in</strong>g<br />
amplitude statistics, QPPM, PPM<br />
<strong>and</strong> LsM. In other words, the<br />
results clearly display non-adherence<br />
to the relevant ITU levell<strong>in</strong>g<br />
recommendations [1].<br />
Programme <strong>and</strong><br />
loudness levell<strong>in</strong>g <strong>in</strong><br />
digital sound<br />
broadcast<strong>in</strong>g<br />
General aspects<br />
Digital Radio offers the chance to<br />
get rid of those constra<strong>in</strong>ts that<br />
<strong>EBU</strong> TECHNICAL REVIEW – January 2004 9 / 12<br />
G. Spikofski <strong>and</strong> S. Klar<br />
QPPM<br />
0 3 6 9 12 15 18 21 24 27 30<br />
time (sec)<br />
Figure 11<br />
Programme levels (QPPM, SPPM, PWR 1s, QPPM <strong>Loudness</strong> LsM) –<br />
pop music (high compression)<br />
SPM1<br />
LsM
AUDIO LOUDNESS<br />
are well known <strong>in</strong> analogue FM <strong>radio</strong>. In Digital Radio, there is no relationship between loudness <strong>and</strong><br />
transmission range that requires audio process<strong>in</strong>g. Therefore, the wide dynamic range of Digital Radio can<br />
be used to good effect, e.g. to broadcast the full dynamic range of top-quality CD record<strong>in</strong>gs.<br />
First of all, the transmitters have to be levelled correctly accord<strong>in</strong>g to the relevant ITU/<strong>EBU</strong> Recommendations<br />
[1][2]. This should prevent the occurrence of extreme variations <strong>in</strong> programme loudness. In today’s<br />
European <strong>radio</strong> channels (DVB, DAB <strong>and</strong> ADR), programme signals equivalent to 20-bit PCM quantization<br />
can be transmitted – with a headroom of 9 dB <strong>and</strong> without compromis<strong>in</strong>g the perceived audio quality. These<br />
arguments support the 9 dB <strong>EBU</strong> headroom as well as the use of QPPM <strong>in</strong> the broadcast studios, <strong>and</strong> should<br />
result <strong>in</strong> a much-needed homogenisation of eng<strong>in</strong>eer<strong>in</strong>g operations <strong>and</strong> ma<strong>in</strong>tenance.<br />
With respect to manual levell<strong>in</strong>g, only specified <strong>and</strong> correctly calibrated IEC <strong>in</strong>struments (QPPM) should be<br />
used (see Table 2). In order to control the loudness profile with<strong>in</strong> a s<strong>in</strong>gle programme, an additional loudness<br />
meter – such as the algorithm proposed <strong>in</strong> this article – should be used. The proposed loudness meter, moreover,<br />
offers the opportunity to control the loudness profile automatically.<br />
Automatic pre-fad<strong>in</strong>g ... <strong>and</strong> adjust<strong>in</strong>g archive programme material<br />
Because of level <strong>and</strong> loudness differences<br />
<strong>in</strong> archive material, an<br />
accompany<strong>in</strong>g archive (database)<br />
of level <strong>and</strong> loudness correction<br />
values would be useful for automatic<br />
broadcast operations.<br />
Fig. 12 shows a possible signal<br />
process<strong>in</strong>g scheme for computeraided<br />
<strong>radio</strong> (CAR). The archive<br />
material is pre-levelled by means<br />
of an “automatic fader” (AF). The<br />
archive contribution on the “broadcast<br />
server” (BS) can be levelled<br />
optimally before broadcast<strong>in</strong>g, by<br />
means of “level correction” (K)<br />
<strong>and</strong> “loudness correction” (LsM),<br />
which is realized by the automatic<br />
fader. Controll<strong>in</strong>g all the contributions<br />
<strong>in</strong> the sum channel are the<br />
QPPM <strong>and</strong> the proposed loudness meter (LsM).<br />
<strong>Loudness</strong> meter<strong>in</strong>g<br />
In addition to the 100% tag of QPPM, the loudness meter (LsM) also needs a 100% tag. For optimal levell<strong>in</strong>g<br />
of digital sound channels, an additional limit value has to be def<strong>in</strong>ed along with the headroom. Unwanted<br />
high-level signals could be controlled by means of loudness limitation (Ls-Lim).<br />
The loudness limiter can be realized by means of an automatic fader that is controlled by the proposed loudness<br />
meter. By ensur<strong>in</strong>g that the velocity of the loudness fad<strong>in</strong>g matches that of manual fad<strong>in</strong>g by a sound<br />
eng<strong>in</strong>eer, audible distortion could be avoided. This operation could be described as “headroom adaptation”.<br />
Conclusions<br />
Digital Broadcast Studio<br />
Archive<br />
A BS<br />
Live<br />
Metadata<br />
K<br />
If the relevant recommendations of the ITU [1] <strong>and</strong> <strong>EBU</strong> [2] are met, <strong>and</strong> the broadcast signal is levelled optimally<br />
by means of QPPM [6], a certa<strong>in</strong> loudness balance could be achieved – thus avoid<strong>in</strong>g extreme jumps <strong>in</strong><br />
loudness. Nevertheless, loudness differences will rema<strong>in</strong> because of diverse record<strong>in</strong>g <strong>and</strong> audio process<strong>in</strong>g<br />
<strong>EBU</strong> TECHNICAL REVIEW – January 2004 10 / 12<br />
G. Spikofski <strong>and</strong> S. Klar<br />
AF<br />
PPM<br />
& LsM<br />
A<br />
D<br />
C<br />
SP<br />
VP<br />
0 dB<br />
F1<br />
F2<br />
Audio meter<strong>in</strong>g<br />
QPPM LsM<br />
A = Archive (CD player) AF = Automatic fader<br />
BS = Broadcast Server LsM = <strong>Loudness</strong> meter DVB = Digital sound channel<br />
K = Level-correction data SP/VP = Sound/voice processor FM = Analogue Sound Channel<br />
100%<br />
+<br />
ext<br />
100%<br />
Head-<br />
Ad<br />
[Ls-Lim]<br />
FM limiter<br />
Figure 12<br />
Proposed levell<strong>in</strong>g scheme for digital sound broadcast<strong>in</strong>g<br />
Audio<br />
channel<br />
100% = –9 dBFS<br />
DVB<br />
100% = 40 kHz<br />
FM Deviation<br />
FM
AUDIO LOUDNESS<br />
techniques. These rema<strong>in</strong><strong>in</strong>g loudness differences can be controlled by an additional loudness meter at the studio<br />
output.<br />
In order to achieve loudness balanc<strong>in</strong>g of digital audio broadcasts (such as DVB, DAB <strong>and</strong> ADR), the first<br />
step is to meet the 9 dB headroom proposal. The result<strong>in</strong>g reduction of the available dynamic range is of no<br />
consequence to current Digital Radio <strong>and</strong> TV sound channels – with their quasi 20-bit resolution. As high<br />
audio levels cannot be avoided <strong>in</strong> practice <strong>and</strong>, at the same time, <strong>in</strong> order to guarantee an agreed loudness<br />
limit, an automatic loudness limiter is suggested – a so called headroom adapter. This solution (to avoid clipp<strong>in</strong>g<br />
of the signal) seems to be preferable to that of us<strong>in</strong>g limiters. The automatic controll<strong>in</strong>g of both level <strong>and</strong><br />
loudness is achieved by the proposed loudness meter.<br />
Because of the different requirements of archive <strong>and</strong> broadcast material, it is advisable to dist<strong>in</strong>guish between<br />
the levell<strong>in</strong>g of archive <strong>and</strong> broadcast material. In the case of archive material that will be broadcast, it is<br />
highly recommended that this programme material is properly adjusted to suit the new transmission channels<br />
available today.<br />
Bibliography<br />
Gerhard Spikofski studied electrical eng<strong>in</strong>eer<strong>in</strong>g at Berl<strong>in</strong> <strong>Technical</strong> University, one<br />
of his ma<strong>in</strong> areas of study be<strong>in</strong>g technical acoustics. S<strong>in</strong>ce 1980, he has been on<br />
the scientific staff of the Institut für Rundfunktechnik, Munich (IRT). His field of <strong>in</strong>terest<br />
covers development <strong>and</strong> optimization of audio systems <strong>in</strong> broadcast<strong>in</strong>g, with special<br />
reference to the psychoacoustic aspects.<br />
Dipl.-Ing. Spikofski has published many articles <strong>in</strong> national <strong>and</strong> <strong>in</strong>ternational specialist<br />
journals <strong>and</strong> is a regular speaker at national <strong>and</strong> <strong>in</strong>ternational technical conferences.<br />
He is also a member of various national <strong>and</strong><br />
<strong>in</strong>ternational st<strong>and</strong>ardization bodies.<br />
Siegfried Klar studied communications eng<strong>in</strong>eer<strong>in</strong>g at the<br />
academy of Giessen (Germany). S<strong>in</strong>ce 1978, he has been on<br />
the scientific staff of the Institut für Rundfunktechnik, Munich (IRT). After deal<strong>in</strong>g with<br />
video measurement eng<strong>in</strong>eer<strong>in</strong>g, he changed to the <strong>radio</strong> broadcast department. In<br />
this new work<strong>in</strong>g field, he concentrated on problems address<strong>in</strong>g analogue <strong>and</strong> digital<br />
audio process<strong>in</strong>g <strong>and</strong> the broadcast<strong>in</strong>g of <strong>radio</strong> <strong>and</strong> TV signals.<br />
Dipl.-Ing. Klar's current area of activity covers the analysis <strong>and</strong> optimization of digital<br />
audio broadcast<strong>in</strong>g systems.<br />
[1] ITU-R Recommendation BS.645-2: Test signals <strong>and</strong> meter<strong>in</strong>g to be used on <strong>in</strong>ternational sound programme<br />
connections<br />
ITU, Geneva, 1992.<br />
[2] <strong>EBU</strong> Recommendation R68-2000: Alignment level <strong>in</strong> digital audio production equipment <strong>and</strong> <strong>in</strong> digital<br />
audio recorders<br />
<strong>EBU</strong>, Geneva, 2000.<br />
[3] Empfehlung 15 IRT der ARD-Hörfunk-betriebsleiterkonferenz: Headroom bei digitalen Tonsignalen<br />
(Headroom <strong>in</strong> digital audio)<br />
Institut für Rundfunktechnik, München, Okt. 1994.<br />
[4] International St<strong>and</strong>ard IEC 268-17: Sound system equipment, St<strong>and</strong>ard volume <strong>in</strong>dicators<br />
IEC, Geneva, 1990.<br />
[5] <strong>EBU</strong> Tech. 3205-E: <strong>EBU</strong> St<strong>and</strong>ard peak programme meter for the control of <strong>in</strong>ternational transmissions.<br />
<strong>EBU</strong>, Geneva, 1979.<br />
<strong>EBU</strong> TECHNICAL REVIEW – January 2004 11 / 12<br />
G. Spikofski <strong>and</strong> S. Klar
AUDIO LOUDNESS<br />
[6] International St<strong>and</strong>ard IEC 268-10, 2 nd Edition: Sound system equipment, Peak programme level<br />
meters<br />
IEC, Geneva, 1991.<br />
[7] International St<strong>and</strong>ard IEC 268-18: Sound system equipment, Peak programme level meters - Digital<br />
audio peak level meter<br />
IEC, Geneva, 1995.<br />
[8] ARD Pflichtenheft 3/6: Aussteuerungsmesser (Level meter)<br />
Institut für Rundfunktechnik, München, Jan. 1977 / März. 1998<br />
(Technische Pflichtenhefte der öffentlich-rechtlichen Rundfunkanstalten <strong>in</strong> der Bundesrepublik Deutschl<strong>and</strong>;<br />
3/6)<br />
[9] Horst Jakubowski: Analyse des Programmaterials des Hörrundfunks (Analysis of <strong>radio</strong> programme<br />
material)<br />
Rundfunktechnische Mitteilungen (RTM) 15 (1980), H. 5, S. 197 - 202.<br />
[10] Horst Jakubowski: Aussteuerung <strong>in</strong> der digitalen Tonstudiotechnik (<strong>Levell<strong>in</strong>g</strong> <strong>in</strong> digital audio)<br />
Rundfunktechnische Mitteilungen (RTM) 28 (1984), H. 5, S. 213 - 219.<br />
[11] Gerhard Spikofski: Signal-to-noise-ratio for digital transmission systems<br />
Prepr<strong>in</strong>t No. 2196, 77 th AES Convention, Hamburg, 1985.<br />
[12] DIN 45405: Störspannungsmessung <strong>in</strong> der Tontechnik (Measurement of disturbance voltage <strong>in</strong> audio)<br />
Deutsch Normen, Nov. 1983.<br />
[13] ITU-R Recommendation BS.468: Measurement of audio-frequency noise voltage level <strong>in</strong> sound<br />
broadcast<strong>in</strong>g<br />
ITU, Geneva, 1990, 1997.<br />
[14] ITU-R Recommendation BS.708: Determ<strong>in</strong>ation of the electro-acoustical properties of studio monitor<br />
headphones<br />
ITU, Geneva, 1990, 1997.<br />
[15] <strong>EBU</strong> Tech. 3276-E-2nd edition: Listen<strong>in</strong>g conditions for the assessment of sound programme material:<br />
Monophonic <strong>and</strong> two-channel stereophonic<br />
<strong>EBU</strong>, Geneva, 1998.<br />
[16] Die Lautheitsanzeige <strong>in</strong> RTW Peakmetern (<strong>Loudness</strong> display of RTW peak meters)<br />
RTW (Radio-Technische Werkstätten GmbH & Co. KG), 1997<br />
[17] Jens Blauert <strong>and</strong> Jobst P. Fricke: Optimale Aussteuerung <strong>in</strong> der Sendung (Optimal levell<strong>in</strong>g <strong>in</strong> broadcast<strong>in</strong>g)<br />
Rundfunktechnische Mitteilungen (RTM) 24 (1980), S. 63 - 71.<br />
[18] Horst Jakubowski: Das Problem der Programmlautstärke (The problem of programme loudness)<br />
Rundfunktechnische Mitteilungen (RTM) 12 (1968), S. 53 ff.<br />
[19] John Emmett <strong>and</strong> Charles Girdwood: Programme <strong>Loudness</strong> Meter<strong>in</strong>g.<br />
http://www.bpr.org.uk<br />
[20] John Emmett: Programme <strong>Loudness</strong> Meter<strong>in</strong>g <strong>and</strong> Control.<br />
Prepr<strong>in</strong>t No. 3295, 92 nd AES Convention, Vienna, March 1992.<br />
[21] Gerhard Spikofski,: Lautstärkemessung im Rundfunk-Sendestudio (<strong>Loudness</strong> measurement <strong>in</strong> broadcast<br />
studios)<br />
Tonmeistertagung < 21, 2000, Hannover >: Bericht. München: Saur, 2001, S. 604 - 618.<br />
<strong>EBU</strong> TECHNICAL REVIEW – January 2004 12 / 12<br />
G. Spikofski <strong>and</strong> S. Klar